Business Analysis Icon
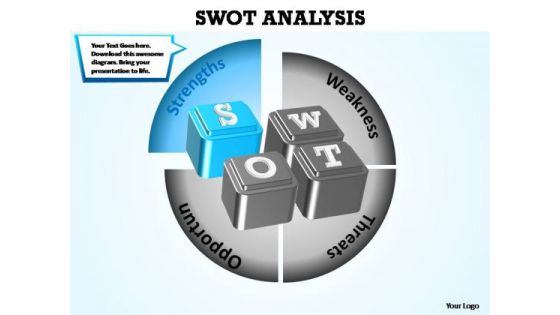
PowerPoint Template Success Swot Analysis Ppt Slide Designs
PowerPoint Template Success Swot Analysis PPT Slide Designs Business Power Points-These high quality powerpoint pre-designed slides and powerpoint templates have been carefully created by our professional team to help you impress your audience. All slides have been created and are 100% editable in powerpoint. Each and every property of any graphic - color, size, orientation, shading, outline etc. can be modified to help you build an effective powerpoint presentation. Any text can be entered at any point in the powerpoint template or slide. Simply DOWNLOAD, TYPE and PRESENT!-These amazing PowerPoint pre-designed slides and PowerPoint templates have been carefully created by our team of experts to help you impress your audience. Our stunning collection of Powerpoint slides are 100% editable and can easily fit in any PowerPoint presentations. By using these animations and graphics in PowerPoint and you can easily make professional presentations. Any text can be entered at any point in the PowerPoint template or slide. Just DOWNLOAD our awesome PowerPoint templates and you are ready to go.

Five Steps For Data Compare And Analysis Powerpoint Template
Our above slide contains graphics of five steps chart. This PowerPoint template is useful for data compare and analysis. Use this diagram to impart more clarity to subject and to create more sound impact on viewers.

Sample Value Chain Analysis Manufacturing Company Diagram Slides
This is a sample value chain analysis manufacturing company diagram slides. This is a eight stage process. The stages in this process are manufacturer production processes, factory location near rm or customer, production time rate, error rate quality, ability to scale up, wastages, allied components, quality of components, cost of components, speed of delivery, time for scaling up, margins incentives to dealers, timely distribution wh salers, competition from local products, retail level promotions, distributor wholesaler, retailer, exclusive showrooms, cost benefit of having exclusive show rooms, benefit of additional visibility through showroom, transportation time efficiency of routing and scheduling, cost of raw mat, procurement time, adequacy of supply, long term supply contracts, cost of transport, intermediaries in raw material procurement, allied services like transportation security etc, raw material.

Four Steps For Financial Data Analysis Powerpoint Slides
This PowerPoint contains four circles with percentage values. Download this diagram slide to display financial data analysis. This template is editable, You can edit text, color, shade and style of this diagram as per you need.

Bar Graph For Profit Growth Analysis Powerpoint Slides
This PowerPoint template has been designed with bar graph with percentage values. This diagram is useful to exhibit profit growth analysis. This diagram slide can be used to make impressive presentations.

Bar Graph For Yearly Statistical Analysis Powerpoint Slides
This PowerPoint template has been designed with bar graph. This PowerPoint diagram is useful to exhibit yearly statistical analysis. This diagram slide can be used to make impressive presentations.

Bar Graph For Year Based Analysis Powerpoint Slides
This PowerPoint template has been designed with year based bar graph. This diagram may be used to display yearly statistical analysis. Use this PPT slide design to make impressive presentations.

Four Tags For Financial Review And Analysis Powerpoint Slides
This PowerPoint template has been designed with four tags and financial values. This PowerPoint template helps to exhibit financial review and analysis. Use this diagram slide to build an exclusive presentation.
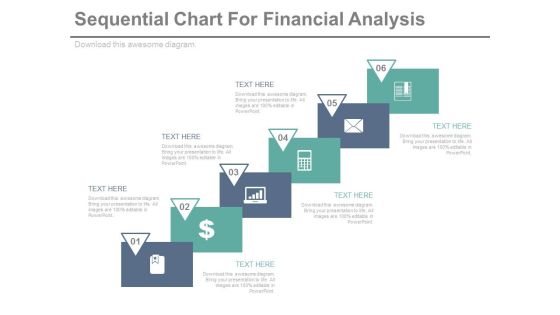
Sequential Steps Chart For Data Analysis Powerpoint Slides
This PowerPoint template has been designed sequential steps chart with icons. This PPT slide can be used to display corporate level financial strategy. You can download finance PowerPoint template to prepare awesome presentations.

Puzzle Pie Chart With Team For Financial Analysis Powerpoint Slides
This PPT slide contains graphics of puzzle pie chart with team icons. You may use this PowerPoint template to display team strategy and success. Download this professional slide design to deliver amazing presentations.

Information Analysis And BI Playbook How To Overcome Automated Data Analysis Powered By Ml Challenges Clipart PDF
This template illustrates that automated discovery of insights utilizes machine learning algorithms to analyze billions of data points in seconds to perform complex segmentation, anomaly detection, and trend-based analysis without coding. Make sure to capture your audiences attention in your business displays with our gratis customizable Information Analysis And BI Playbook How To Overcome Automated Data Analysis Powered By Ml Challenges Clipart PDF. These are great for business strategies, office conferences, capital raising or task suggestions. If you desire to acquire more customers for your tech business and ensure they stay satisfied, create your own sales presentation with these plain slides.
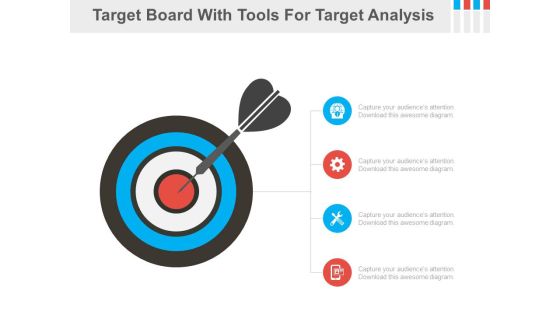
Four Tools For Marketing Target Analysis Powerpoint Slides
This PPT slide contains graphics of target board with four icons. You may download this PPT slide as tool for marketing target analysis. Impress your audiences by using this PPT slide.
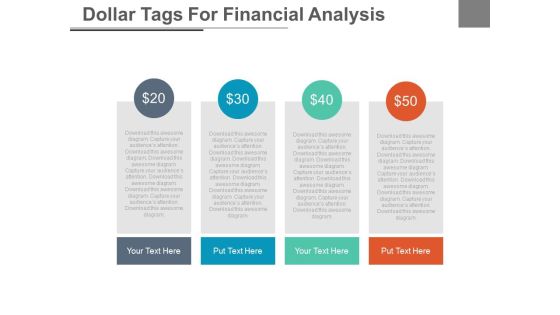
Four Tags With Dollar Values For Financial Analysis Powerpoint Slides
This PowerPoint template has been designed with dollar value pricing table chart. This PPT slide may be used for sample marketing proposal. Download this slide to build unique presentation.

Venn Circles Infographic For Financial Analysis PowerPoint Templates
This PowerPoint template has been designed with Venn circles infographic. This infographic template useful for financial analysis. Accelerate the impact of your ideas using this template.

Pie Chart For Financial Ratio Analysis PowerPoint Templates
Create visually amazing presentations with this slide of pie chart. This PPT slide of pie chart for financial ratio analysis. Add this diagram in your presentations to visually support your content.
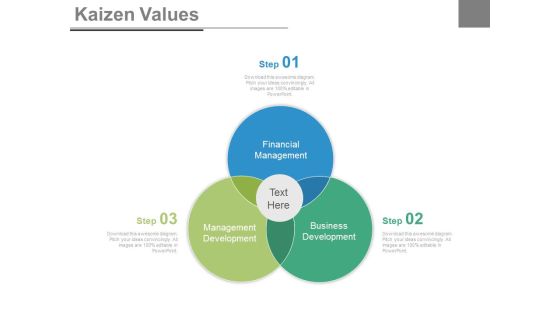
Venn Diagram For Kaizen Values Analysis Powerpoint Slides
This power point template has been designed with graphic of Venn diagram. Use this Venn diagram to display kaizen value analysis. Illustrate your ideas and imprint them in the minds of your team with this template.

Pie Charts For Percentage Value Analysis Powerpoint Slides
Our above PPT slide displays graphics of Pie charts. This PowerPoint template may be used to display percentage value analysis. Download this template to leave permanent impression on your audience.

Dashboard Diagram For Finance And Strategic Analysis Powerpoint Slides
This PowerPoint template display graphics of clock with arrows around it and dollar symbol in center. You may use this PPT slide for financial and strategic analysis. This dashboard slide may useful for multilevel status report creation and approval process.

Test Tubes And Beaker For Ratio Analysis Powerpoint Template
Visually support your presentation with our above template containing diagram of test tubes and beaker. This diagram is excellent visual tools for explaining ratio analysis. Use this diagram to make interactive presentations.
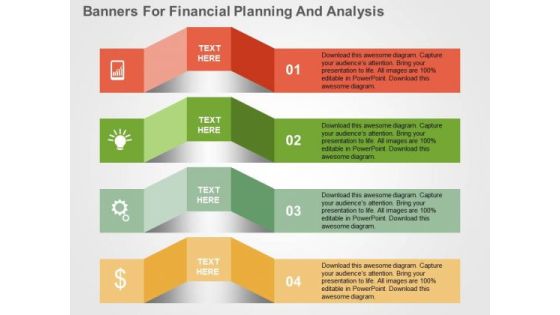
Banners For Financial Planning And Analysis PowerPoint Template
Visually support your presentation with our above template illustrating diagram of banners. It contains graphics of concepts of financial planning and analysis. Etch your views in the brains of your audience with this diagram slide.

Fish Bone For Cause And Effect Analysis PowerPoint Templates
This PPT slide has been designed with graphic fish bone diagram. Download this fishbone slide to present cause and effect analysis. Accelerate the impact of your ideas using this image.

Bar Graph With Yearly Statistical Analysis Powerpoint Slides
This PowerPoint template contains diagram of bar graph with yearly percentage ratios. You may download this slide to display statistical analysis. You can easily customize this template to make it more unique as per your need.

Finland Map With Economic Data Analysis Powerpoint Slides
This PowerPoint template has been designed with Finland Map and areas highlighted. You may use this slide to display financial strategy analysis. This diagram provides an effective way of displaying information you can edit text, color, shade and style as per you need.

Year Based Linear Timeline For Sales Analysis Powerpoint Slides
This PowerPoint template has been designed with linear timeline diagram. This timeline template can be used in presentations where you need to display sales planning and analysis. You can modify the template like add new milestones and tasks, or change the colors and shapes.
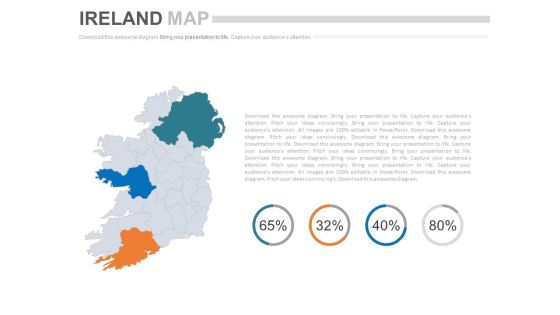
Ireland Map With Financial Ratio Analysis Powerpoint Slides
This PowerPoint template has been designed with Ireland Map and areas highlighted. You may use this slide to display financial strategy analysis. This diagram provides an effective way of displaying information you can edit text, color, shade and style as per you need.

Map Of India With Population Analysis Powerpoint Slides
This PowerPoint template has been designed with graphics of India map. You may use this slide to display population analysis. This diagram provides an effective way of displaying information you can edit text, color, shade and style as per you need.

Benefits Cost Analysis Chart Ppt Powerpoint Presentation Summary Visuals
This is a balance scale with cost and benefits ppt powerpoint presentation show. This is a two stage process. The stages in this process are business, finance, marketing, strategy, compare, management.
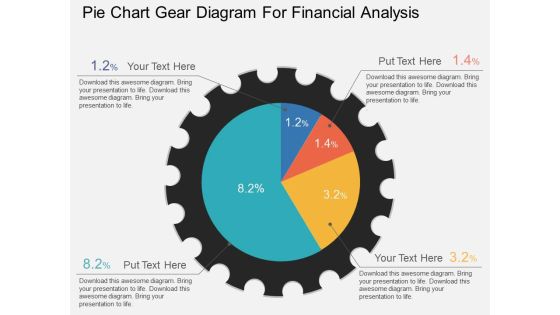
Pie Chart Gear Diagram For Financial Analysis Powerpoint Template
This PowerPoint template has been designed with graphic of pie chart gear diagram. This PPT slide can be used to display financial analysis. Download this PPT diagram slide to make your presentations more effective.

Corporate Vision And Mission Analysis Diagram Powerpoint Slides
This PPT slide contains corporate vision diagram slide. Use this PPT slide to depict companys vision and strategy. This PowerPoint template can be customized as per your requirements.

Bar Graph Of Lego Blocks For Data Analysis Powerpoint Slides
This PowerPoint template contains bar graph made of Lego blocks. You may use this slide to display growth process. This diagram provides an effective way of displaying information you can edit text, color, shade and style as per you need.

Five Vertical Steps For Agenda Analysis Powerpoint Slides
This PPT slide contains five vertical steps diagram. Download this PowerPoint template to depict agenda points in informative and descriptive manner. Deliver amazing presentations to mesmerize your audience by using this agenda slide design.
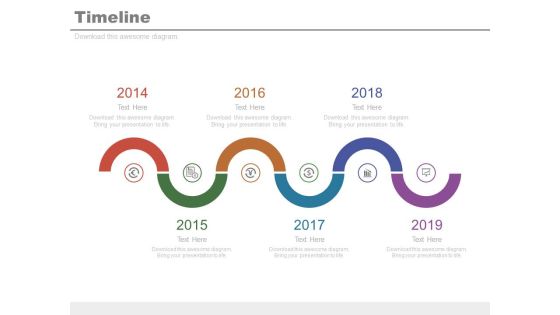
Six Staged Spiral Timeline For Financial Analysis Powerpoint Slides
This infographic template contains graphics of six staged spiral timeline diagram. This PPT slide may be helpful to display financial strategy timeline. Download this PowerPoint timeline template to make impressive presentations.

Timeline Design For Year Based Analysis Powerpoint Slides
This PowerPoint diagram consists of timeline tags design representing planning steps. This PowerPoint template may be used to display when events or steps should happen. This timeline design is most useful for showing important milestones and deadlines.
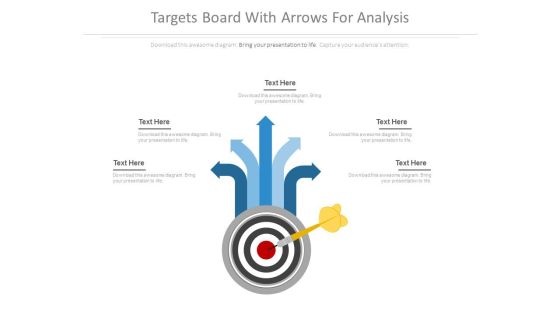
Targets Board With Arrows For Analysis Powerpoint Slides
This PowerPoint template has been designed with target diagram with arrows. Download this slide design for target management development processes. Enlighten others on the process with this innovative PowerPoint template.
Icon Slide For SEO Analysis Report For Better Organic Search Results And Improved Website Slide2 Background PDF
Download our innovative and attention grabbing icon slide for seo analysis report for better organic search results and improved website slide2 background pdf template. The set of slides exhibit completely customizable icons. These icons can be incorporated into any business presentation. So download it immediately to clearly communicate with your clientele.
Icon Slide For SEO Analysis Report For Better Organic Search Results And Improved Website Slide3 Template PDF
Presenting our innovatively structured icon slide for seo analysis report for better organic search results and improved website slide3 template pdf set of slides. The slides contain a hundred percent editable icons. You can replace these icons without any inconvenience. Therefore, pick this set of slides and create a striking presentation
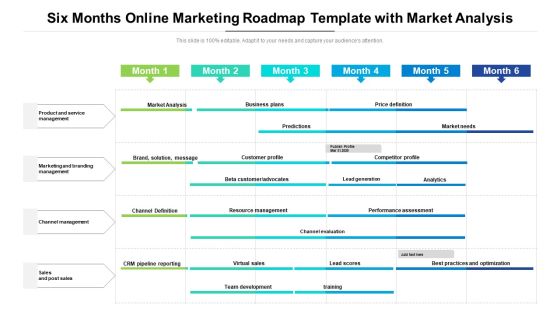
Six Months Online Marketing Roadmap Template With Market Analysis Professional
Introducing our six months online marketing roadmap template with market analysis professional. This PPT presentation is Google Slides compatible, therefore, you can share it easily with the collaborators for measuring the progress. Also, the presentation is available in both standard screen and widescreen aspect ratios. So edit the template design by modifying the font size, font type, color, and shapes as per your requirements. As this PPT design is fully editable it can be presented in PDF, JPG and PNG formats.

Issues And Impact Of Failure Mode And Effects Analysis Dashboard Failure Mode Effects Analysis FMEA Clipart PDF
Deliver an awe inspiring pitch with this creative Issues And Impact Of Failure Mode And Effects Analysis Dashboard Failure Mode Effects Analysis FMEA Clipart PDF bundle. Topics like Overdue Recommended, Responsibility Problems, Landing Functionality can be discussed with this completely editable template. It is available for immediate download depending on the needs and requirements of the user.
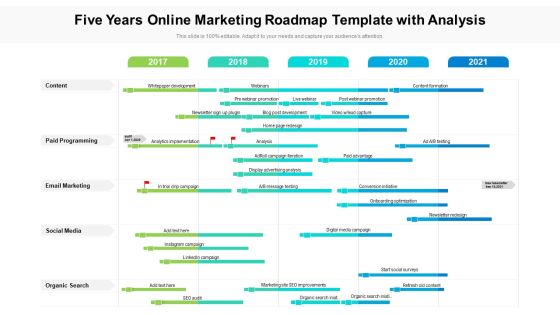
Five Years Online Marketing Roadmap Template With Analysis Download
Presenting the five years online marketing roadmap template with analysis download. The template includes a roadmap that can be used to initiate a strategic plan. Not only this, the PowerPoint slideshow is completely editable and you can effortlessly modify the font size, font type, and shapes according to your needs. This PPT slide can be easily reached in standard screen and widescreen aspect ratios. The set is also available in various formats like PDF, PNG, and JPG. So download and use it multiple times as per your knowledge.

Analysis Of Grains Fruits And Vegetables Segment In Food Manufacturing Industry Industry Analysis Of Food Demonstration PDF
This slide showcase the market analysis of grains fruits and vegetables in food manufacturing industry providing information regarding top states, total production both weight and value wise, key export destinations and innovations in processing equipment.Formulating a presentation can take up a lot of effort and time, so the content and message should always be the primary focus. The visuals of the PowerPoint can enhance the presenters message, so our Analysis Of Grains Fruits And Vegetables Segment In Food Manufacturing Industry Industry Analysis Of Food Demonstration PDF was created to help save time. Instead of worrying about the design, the presenter can concentrate on the message while our designers work on creating the ideal templates for whatever situation is needed. Slidegeeks has experts for everything from amazing designs to valuable content, we have put everything into Analysis Of Grains Fruits And Vegetables Segment In Food Manufacturing Industry Industry Analysis Of Food Demonstration PDF.

Data Interpretation And Analysis Playbook How To Overcome Automated Data Analysis Powered By Ml Challenges Summary PDF
This template illustrates that automated discovery of insights utilizes machine learning algorithms to analyze billions of data points in seconds to perform complex segmentation, anomaly detection, and trend-based analysis without coding. Deliver and pitch your topic in the best possible manner with this data interpretation and analysis playbook how to overcome automated data analysis powered by ml challenges summary pdf. Use them to share invaluable insights on opportunity, service, analytics, industry and impress your audience. This template can be altered and modified as per your expectations. So, grab it now.

Fishbone Ishikawa Cause And Effect Analysis What Is Cause And Effect Analysis Ppt PowerPoint Presentation Professional Diagrams PDF
Presenting this set of slides with name fishbone ishikawa cause and effect analysis what is cause and effect analysis ppt powerpoint presentation professional diagrams pdf. This is a five stage process. The stages in this process are business, analysts, problem, individuals, relationship. This is a completely editable PowerPoint presentation and is available for immediate download. Download now and impress your audience.

Issues And Impact Of Failure Mode And Effects Analysis Major Steps In Failure Mode And Effects Analysis Process Download PDF
This slide provides the major steps in Failure Mode and Effects Analysis FMEA Process. It covers all the phases from reviewing the process to calculating the resulting RPNs risk priority numbers.This is a Issues And Impact Of Failure Mode And Effects Analysis Major Steps In Failure Mode And Effects Analysis Process Download PDF template with various stages. Focus and dispense information onten stages using this creative set, that comes with editable features. It contains large content boxes to add your information on topics like Process And Assemble, Assign Detection, Occurrence Ranking. You can also showcase facts, figures, and other relevant content using this PPT layout. Grab it now.

Fishbone Ishikawa Cause And Effect Analysis Process Flow Of Cause And Effect Analysis Ppt PowerPoint Presentation Show Design Ideas PDF
Presenting this set of slides with name fishbone ishikawa cause and effect analysis process flow of cause and effect analysis ppt powerpoint presentation show design ideas pdf. This is a seven stage process. The stages in this process are test for reliability, examine root cause, allocate causes, align output with cause categories, draw fishbone diagram, brainstorm, identify problem. This is a completely editable PowerPoint presentation and is available for immediate download. Download now and impress your audience.

Convertible Note Pitch Deck Funding Strategy Competitive Analysis By Company Size Ppt PowerPoint Presentation Model Icon PDF
Presenting this set of slides with name convertible note pitch deck funding strategy competitive analysis by company size ppt powerpoint presentation model icon pdf. The topics discussed in these slides are customers, user traffic visitors per month, employee count, revenue, net income. This is a completely editable PowerPoint presentation and is available for immediate download. Download now and impress your audience.
Fishbone Ishikawa Cause And Effect Analysis Sources Of Variation Method Ppt PowerPoint Presentation Icon Example Topics PDF
Presenting this set of slides with name fishbone ishikawa cause and effect analysis sources of variation method ppt powerpoint presentation icon example topics pdf. The topics discussed in these slides are different methods followed produce products, alterations caused inappropriate methods, processes, effectiveness. This is a completely editable PowerPoint presentation and is available for immediate download. Download now and impress your audience.
Business Diagram Global Business Icons For Business Activities Presentation Template
This Power Point template slide has been designed with graphic of globe and business icons. This PPT slide contains the concept of global business activities. Use this PPT slide for your business and global agenda related presentations.
Types Of Enterprise Decision Management With Accounting System And Data Analysis System Ppt PowerPoint Presentation Outline Icon PDF
Presenting this set of slides with name types of enterprise decision management with accounting system and data analysis system ppt powerpoint presentation outline icon pdf. This is a five stage process. The stages in this process are status inquiry system, information analysis system, model based system data analysis system. This is a completely editable PowerPoint presentation and is available for immediate download. Download now and impress your audience.
Umbrella With Threat Symbol For Financial Risk Analysis Vector Icon Ppt PowerPoint Presentation Styles Background Image PDF
Persuade your audience using this umbrella with threat symbol for financial risk analysis vector icon ppt powerpoint presentation styles background image pdf. This PPT design covers three stages, thus making it a great tool to use. It also caters to a variety of topics including umbrella with threat symbol for financial risk analysis vector icon. Download this PPT design now to present a convincing pitch that not only emphasizes the topic but also showcases your presentation skills.
Staff Analysis And Potential Matrix With Low Medium And High Levels Ppt PowerPoint Presentation Icon Styles PDF
Persuade your audience using this staff analysis and potential matrix with low medium and high levels ppt powerpoint presentation icon styles pdf. This PPT design covers nine stages, thus making it a great tool to use. It also caters to a variety of topics including potential, performance, questionable. Download this PPT design now to present a convincing pitch that not only emphasizes the topic but also showcases your presentation skills.
Investor Pitch Deck For Short Term Bridge Loan SWOT Analysis Of The Company Ppt PowerPoint Presentation Icon Grid PDF
This slide shows the strengths, weaknesses, opportunities and threats of the company.This is a investor pitch deck for short term bridge loan swot analysis of the company ppt powerpoint presentation icon grid pdf template with various stages. Focus and dispense information on four stages using this creative set, that comes with editable features. It contains large content boxes to add your information on topics like strenth, weakness, opportunities, threats. You can also showcase facts, figures, and other relevant content using this PPT layout. Grab it now.

Icons Slide For Data And Customer Analysis Company Outline Brochure PDF
Introducing our well designed Icons Slide For Data And Customer Analysis Company Outline Brochure PDF set of slides. The slide displays editable icons to enhance your visual presentation. The icons can be edited easily. So customize according to your business to achieve a creative edge. Download and share it with your audience.
Icons Slide For Customer Segmentation And Behavioral Analysis For Effective Marketing Sample PDF
Introducing our well designed Icons Slide For Customer Segmentation And Behavioral Analysis For Effective Marketing Sample PDF set of slides. The slide displays editable icons to enhance your visual presentation. The icons can be edited easily. So customize according to your business to achieve a creative edge. Download and share it with your audience.

Icons Slide For Marketers Guide To Data Analysis And Optimization Formats PDF
Help your business to create an attention grabbing presentation using our Icons Slide For Marketers Guide To Data Analysis And Optimization Formats PDF set of slides. The slide contains innovative icons that can be flexibly edited. Choose this Icons Slide For Marketers Guide To Data Analysis And Optimization Formats PDF template to create a satisfactory experience for your customers. Go ahead and click the download button.
Fishbone Ishikawa Cause And Effect Analysis How Do I Do It Ppt PowerPoint Presentation Icon Graphics Tutorials PDF
Presenting this set of slides with name fishbone ishikawa cause and effect analysis how do i do it ppt powerpoint presentation icon graphics tutorials pdf. This is a one stage process. The stages in this process are identify problem, business, analyzed, problem. This is a completely editable PowerPoint presentation and is available for immediate download. Download now and impress your audience.
Icons Slide For Feasibility Analysis Report For Construction Project Demonstration PDF
Help your business to create an attention-grabbing presentation using our Icons Slide For Feasibility Analysis Report For Construction Project Demonstration PDF set of slides. The slide contains innovative icons that can be flexibly edited. Choose this Icons Slide For Feasibility Analysis Report For Construction Project Demonstration PDF template to create a satisfactory experience for your customers. Go ahead and click the download button.
International Cloud Kitchen Industry Analysis Emerging Global Trends In Cloud Kitchen Market Icons PDF
The slide highlights emerging trends in global cloud kitchen market for sustainable growth and development. It highlights trends such as vertical consolidation, automation, recipe improvement and data driven. Make sure to capture your audiences attention in your business displays with our gratis customizable International Cloud Kitchen Industry Analysis Emerging Global Trends In Cloud Kitchen Market Icons PDF. These are great for business strategies, office conferences, capital raising or task suggestions. If you desire to acquire more customers for your tech business and ensure they stay satisfied, create your own sales presentation with these plain slides.
Icons Slide For Webpage Analysis Action Plan Proposal Ppt PowerPoint Presentation Professional Images PDF
Help your business to create an attention-grabbing presentation using our icons slide for webpage analysis action plan proposal ppt powerpoint presentation professional images pdf set of slides. The slide contains innovative icons that can be flexibly edited. Choose this icons slide for webpage analysis action plan proposal ppt powerpoint presentation professional images pdf template to create a satisfactory experience for your customers. Go ahead and click the download button.

Comprehensive Solution Analysis And Testing Model With Process Activities And Inputs For Icons Slide Portrait PDF
Help your business to create an attention-grabbing presentation using our comprehensive solution analysis and testing model with process activities and inputs for icons slide portrait pdf set of slides. The slide contains innovative icons that can be flexibly edited. Choose this comprehensive solution analysis and testing model with process activities and inputs for icons slide portrait pdf template to create a satisfactory experience for your customers. Go ahead and click the download button.
Icons Slide For Risk Analysis Strategies For Real Estate Construction Project Diagrams PDF
Download our innovative and attention grabbing icons slide for risk analysis strategies for real estate construction project diagrams pdf template. The set of slides exhibit completely customizable icons. These icons can be incorporated into any business presentation. So download it immediately to clearly communicate with your clientele.

 Home
Home