AI PPT Maker
Templates
PPT Bundles
Design Services
Business PPTs
Business Plan
Management
Strategy
Introduction PPT
Roadmap
Self Introduction
Timelines
Process
Marketing
Agenda
Technology
Medical
Startup Business Plan
Cyber Security
Dashboards
SWOT
Proposals
Education
Pitch Deck
Digital Marketing
KPIs
Project Management
Product Management
Artificial Intelligence
Target Market
Communication
Supply Chain
Google Slides
Research Services
 One Pagers
All Categories
-
Home
- Customer Favorites
- Budget Vs Actual Dashboard
Budget Vs Actual Dashboard

Budget Vs Actual Dashboard For Finance Department Brochure PDF
The slide illustrates the dashboard showing the income and expenses incurred by the finance department. The purpose of this slide is compare the budgeted figures with the actual cost, enabling effective analysis of financial activities. It include income budget, expense budget, and difference. Showcasing this set of slides titled Budget Vs Actual Dashboard For Finance Department Brochure PDF. The topics addressed in these templates are Income, Expenses, Expense Budget. All the content presented in this PPT design is completely editable. Download it and make adjustments in color, background, font etc. as per your unique business setting.

Spend Analysis Budget Vs Actual Dashboard Ppt PowerPoint Presentation Gallery Clipart PDF
Presenting this set of slides with name spend analysis budget vs actual dashboard ppt powerpoint presentation gallery clipart pdf. The topics discussed in these slides are analysis, budget, actual. This is a completely editable PowerPoint presentation and is available for immediate download. Download now and impress your audience.

Organizational Project Budget Vs Actual Expense Analysis Dashboard Sample PDF
Showcasing this set of slides titled Organizational Project Budget Vs Actual Expense Analysis Dashboard Sample PDF. The topics addressed in these templates are Process Improvement, Equipment, Budget. All the content presented in this PPT design is completely editable. Download it and make adjustments in color, background, font etc. as per your unique business setting.

HR Budget Vs Actual KPI Dashboard Ppt PowerPoint Presentation File Structure PDF
The given below slide highlights the key metrics of HR budget to manage expense stream and take assist decision making. It includes KPAs such as month wise variations in budget, total amount allocated, actual expenditures etc. Pitch your topic with ease and precision using this HR Budget Vs Actual KPI Dashboard Ppt PowerPoint Presentation File Structure PDF. This layout presents information on Amount Allocated, Expenses by Heads, Budget Achieved. It is also available for immediate download and adjustment. So, changes can be made in the color, design, graphics or any other component to create a unique layout.

Actual Vs Budgeted Earning Breakup Dashboard Inspiration PDF
This style showcases revenue breakdown dashboard that can help organization to compare the actual vs budgeted amount and calculate the variance in target achievements. Its key components are product revenue, services revenue and total revenues. Showcasing this set of slides titled Actual Vs Budgeted Earning Breakup Dashboard Inspiration PDF. The topics addressed in these templates are Actual Vs Budgeted, Earning Breakup Dashboard. All the content presented in this PPT design is completely editable. Download it and make adjustments in color, background, font etc. as per your unique business setting.

Budget Vs Actual Cost Comparison Dashboard Ppt PowerPoint Presentation Professional Format Ideas PDF
This slide illustrates fact and figures relating to various project budgets of a company. It includes monthly budget graph, project budget meter and budget vs. Actual costs chart.Pitch your topic with ease and precision using this Budget Vs Actual Cost Comparison Dashboard Ppt PowerPoint Presentation Professional Format Ideas PDF. This layout presents information on Milestones, Budget Graph, Manager. It is also available for immediate download and adjustment. So, changes can be made in the color, design, graphics or any other component to create a unique layout.

KPI Dashboard Of Projected Vs Actual Business Budget Pictures PDF
This slide shows the comparison between actual and Projected Budget dashboard of different departments. It includes sales, HR, marketing, research and development budget. Showcasing this set of slides titled KPI Dashboard Of Projected Vs Actual Business Budget Pictures PDF. The topics addressed in these templates are Marketing Budget, Development Budget, Sales Budget. All the content presented in this PPT design is completely editable. Download it and make adjustments in color, background, font etc. as per your unique business setting.
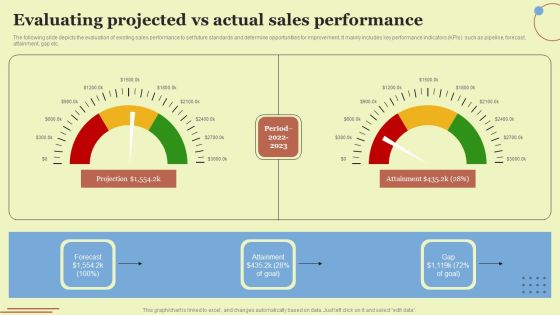
Evaluating Projected Vs Actual Sales Performance Diagrams PDF
The following slide depicts the evaluation of existing sales performance to set future standards and determine opportunities for improvement. It mainly includes key performance indicators KPIs such as pipeline, forecast, attainment, gap etc. There are so many reasons you need a Evaluating Projected Vs Actual Sales Performance Diagrams PDF. The first reason is you can not spend time making everything from scratch, Thus, Slidegeeks has made presentation templates for you too. You can easily download these templates from our website easily.

Evaluating Projected Vs Actual Sales Performance Microsoft PDF
The following slide depicts the evaluation of existing sales performance to set future standards and determine opportunities for improvement. It mainly includes key performance indicators KPIs such as pipeline, forecast, attainment, gap etc. Get a simple yet stunning designed Evaluating Projected Vs Actual Sales Performance Microsoft PDF. It is the best one to establish the tone in your meetings. It is an excellent way to make your presentations highly effective. So, download this PPT today from Slidegeeks and see the positive impacts. Our easy to edit Evaluating Projected Vs Actual Sales Performance Microsoft PDF can be your go to option for all upcoming conferences and meetings. So, what are you waiting for Grab this template today.
Project Tracking Planned Vs Actual Project Progress Tracker Pictures PDF
The following slide highlights the variations in the project progress to manage the its and ensure timely delivery. It includes KPIs such as completion percentage and the gap in the planned versus actual hours. Pitch your topic with ease and precision using this Project Tracking Planned Vs Actual Project Progress Tracker Pictures PDF. This layout presents information on Project Tracking Planned, Project Progress Tracker. It is also available for immediate download and adjustment. So, changes can be made in the color, design, graphics or any other component to create a unique layout.

Evaluating Projected Vs Actual Sales Performance Ppt Ideas Template PDF
The following slide depicts the evaluation of existing sales performance to set future standards and determine opportunities for improvement. It mainly includes key performance indicators KPIs such as pipeline, forecast, attainment, gap etc. The Evaluating Projected Vs Actual Sales Performance Ppt Ideas Template PDF is a compilation of the most recent design trends as a series of slides. It is suitable for any subject or industry presentation, containing attractive visuals and photo spots for businesses to clearly express their messages. This template contains a variety of slides for the user to input data, such as structures to contrast two elements, bullet points, and slides for written information. Slidegeeks is prepared to create an impression.
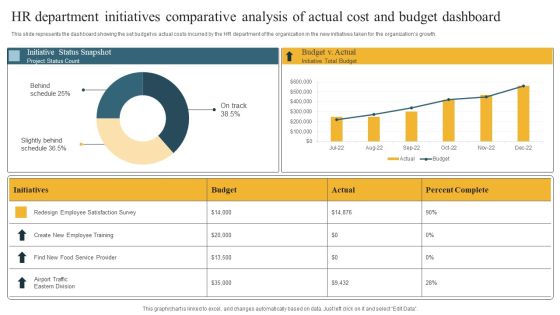
HR Department Initiatives Comparative Analysis Of Actual Cost And Budget Dashboard Introduction PDF
This slide represents the dashboard showing the set budget vs actual costs incurred by the HR department of the organization in the new initiatives taken for the organizations growth. Showcasing this set of slides titled HR Department Initiatives Comparative Analysis Of Actual Cost And Budget Dashboard Introduction PDF. The topics addressed in these templates are Behind Schedule, Slightly Behind Schedule, Initiative Status Snapshot. All the content presented in this PPT design is completely editable. Download it and make adjustments in color, background, font etc. as per your unique business setting.

Actual Vs Target Data Driven Dashboard Ppt PowerPoint Presentation Icon Files PDF
Presenting this set of slides with name actual vs target data driven dashboard ppt powerpoint presentation icon files pdf. The topics discussed in these slide is actual vs target data driven dashboard. This is a completely editable PowerPoint presentation and is available for immediate download. Download now and impress your audience.
Target Vs Actual Sales Comparison Dashboard Ppt PowerPoint Presentation File Icons PDF
Presenting this set of slides with name target vs actual sales comparison dashboard ppt powerpoint presentation file icons pdf. The topics discussed in these slides are sales amount, avg commission rate, total commissions, total deductions, commission payable, top sales manager, top sales person. This is a completely editable PowerPoint presentation and is available for immediate download. Download now and impress your audience.
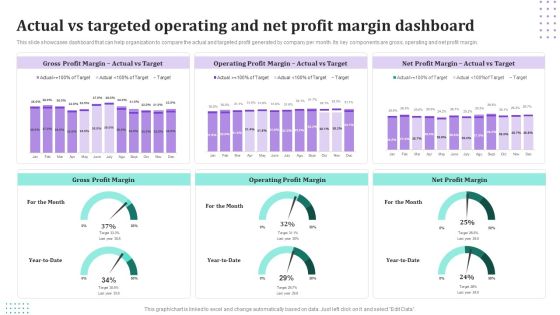
Actual Vs Targeted Operating And Net Profit Margin Dashboard Information PDF
This slide showcases dashboard that can help organization to compare the actual and targeted profit generated by company per month. Its key components are gross, operating and net profit margin. Showcasing this set of slides titled Actual Vs Targeted Operating And Net Profit Margin Dashboard Information PDF. The topics addressed in these templates are Gross Profit Margin, Operating Profit Margin, Net Profit Margin. All the content presented in this PPT design is completely editable. Download it and make adjustments in color, background, font etc. as per your unique business setting.

Actual Vs Budgeted Gross And Net Revenue Comparison Report Sample PDF
This slide covers a profitability dashboard for analyzing gross margin and net profit metrics. It includes evaluation charts such as actual vs budgeted gross profit, net profit, trends, variance analysis table for the selected month and year. Pitch your topic with ease and precision using this Actual Vs Budgeted Gross And Net Revenue Comparison Report Sample PDF. This layout presents information on Gross Profit, Net Profit, Budget. It is also available for immediate download and adjustment. So, changes can be made in the color, design, graphics or any other component to create a unique layout.
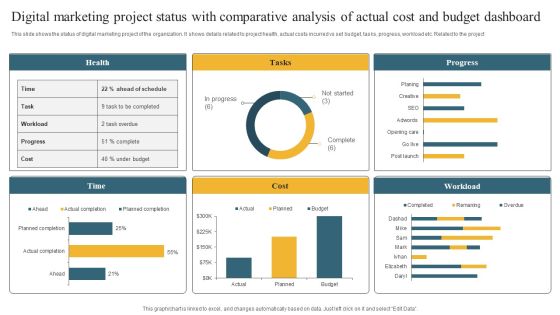
Digital Marketing Project Status With Comparative Analysis Of Actual Cost And Budget Dashboard Information PDF
This slide shows the status of digital marketing project of the organization. It shows details related to project health, actual costs incurred vs set budget, tasks, progress, workload etc. Related to the project Pitch your topic with ease and precision using this Digital Marketing Project Status With Comparative Analysis Of Actual Cost And Budget Dashboard Information PDF. This layout presents information on Health, Tasks, Progress. It is also available for immediate download and adjustment. So, changes can be made in the color, design, graphics or any other component to create a unique layout.

Business Management Dashboards Actual Income Themes PDF
Deliver and pitch your topic in the best possible manner with this business management dashboards actual income themes pdf. Use them to share invaluable insights on actual income vs budget and impress your audience. This template can be altered and modified as per your expectations. So, grab it now.

Determining Risks In Sales Administration Procedure Evaluating Projected Vs Actual Sales Performance Pictures PDF
The following slide depicts the evaluation of existing sales performance to set future standards and determine opportunities for improvement. It mainly includes key performance indicators KPIs such as pipeline, forecast, attainment, gap etc. Explore a selection of the finest Determining Risks In Sales Administration Procedure Evaluating Projected Vs Actual Sales Performance Pictures PDF here. With a plethora of professionally designed and pre made slide templates, you can quickly and easily find the right one for your upcoming presentation. You can use our Determining Risks In Sales Administration Procedure Evaluating Projected Vs Actual Sales Performance Pictures PDF to effectively convey your message to a wider audience. Slidegeeks has done a lot of research before preparing these presentation templates. The content can be personalized and the slides are highly editable. Grab templates today from Slidegeeks.
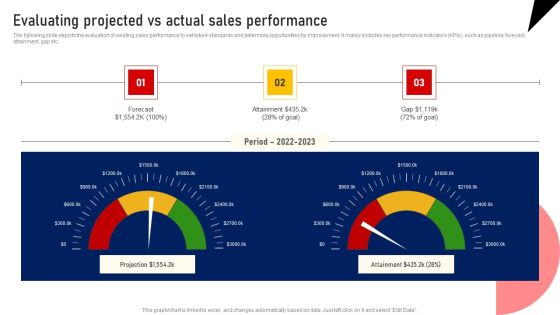
Performing Sales Risk Analysis Procedure Evaluating Projected Vs Actual Sales Performance Pictures PDF
The following slide depicts the evaluation of existing sales performance to set future standards and determine opportunities for improvement. It mainly includes key performance indicators KPIs such as pipeline, forecast, attainment, gap etc. There are so many reasons you need a Performing Sales Risk Analysis Procedure Evaluating Projected Vs Actual Sales Performance Pictures PDF. The first reason is you can not spend time making everything from scratch, Thus, Slidegeeks has made presentation templates for you too. You can easily download these templates from our website easily.
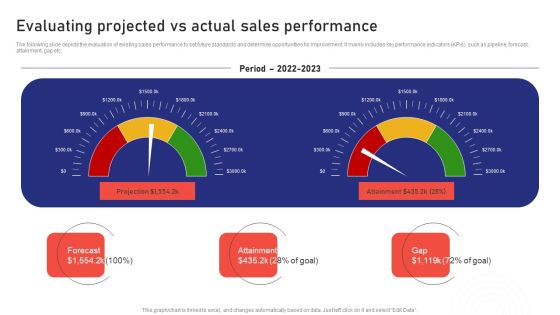
Sales Risk Assessment For Profit Maximization Evaluating Projected Vs Actual Sales Performance Portrait PDF
The following slide depicts the evaluation of existing sales performance to set future standards and determine opportunities for improvement. It mainly includes key performance indicators KPIs such as pipeline, forecast, attainment, gap etc. There are so many reasons you need a Sales Risk Assessment For Profit Maximization Evaluating Projected Vs Actual Sales Performance Portrait PDF. The first reason is you can not spend time making everything from scratch, Thus, Slidegeeks has made presentation templates for you too. You can easily download these templates from our website easily.

Executing Sales Risk Reduction Plan Evaluating Projected Vs Actual Sales Performance Portrait PDF
The following slide depicts the evaluation of existing sales performance to set future standards and determine opportunities for improvement. It mainly includes key performance indicators KPIs such as pipeline, forecast, attainment, gap etc. There are so many reasons you need a Executing Sales Risk Reduction Plan Evaluating Projected Vs Actual Sales Performance Portrait PDF. The first reason is you can not spend time making everything from scratch, Thus, Slidegeeks has made presentation templates for you too. You can easily download these templates from our website easily.

Mitigating Sales Risks With Strategic Action Planning Evaluating Projected Vs Actual Sales Performance Download PDF
The following slide depicts the evaluation of existing sales performance to set future standards and determine opportunities for improvement. It mainly includes key performance indicators KPIs such as pipeline, forecast, attainment, gap etc. Explore a selection of the finest Mitigating Sales Risks With Strategic Action Planning Drafting Checklist For Each Critical Step Diagrams PDF here. With a plethora of professionally designed and pre made slide templates, you can quickly and easily find the right one for your upcoming presentation. You can use our Mitigating Sales Risks With Strategic Action Planning Drafting Checklist For Each Critical Step Diagrams PDF to effectively convey your message to a wider audience. Slidegeeks has done a lot of research before preparing these presentation templates. The content can be personalized and the slides are highly editable. Grab templates today from Slidegeeks.
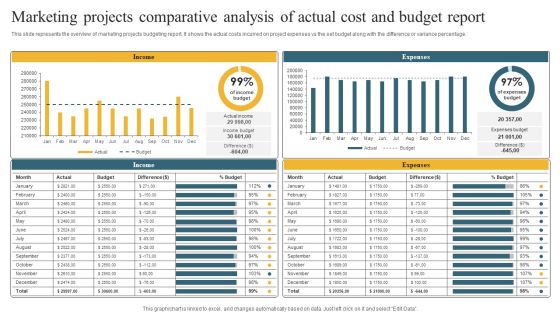
Marketing Projects Comparative Analysis Of Actual Cost And Budget Report Themes PDF
This slide represents the overview of marketing projects budgeting report. It shows the actual costs incurred on project expenses vs the set budget along with the difference or variance percentage. Showcasing this set of slides titled Marketing Projects Comparative Analysis Of Actual Cost And Budget Report Themes PDF. The topics addressed in these templates are Income, Expenses, Report. All the content presented in this PPT design is completely editable. Download it and make adjustments in color, background, font etc. as per your unique business setting.
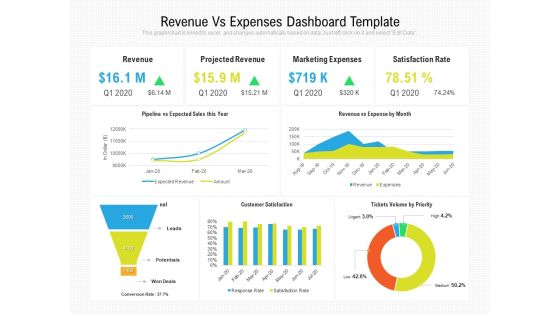
Revenue Vs Expenses Dashboard Template Ppt PowerPoint Presentation Slides Tips PDF
Presenting this set of slides with name revenue vs expenses dashboard template ppt powerpoint presentation slides tips pdf. The topics discussed in these slides are revenue, projected revenue, marketing expenses, satisfaction rate, pipeline vs expected sales this year, revenue vs expense by month, customer satisfaction, tickets volume by priority. This is a completely editable PowerPoint presentation and is available for immediate download. Download now and impress your audience.

Operational Dashboard Powerpoint Images
This is a operational dashboard powerpoint images. This is a four stage process. The stages in this process are cash and equivalents, revenue and expenses actual and forecast, store sales vs budget, expenses actual budget forecast.

Dashboard For Monitoring And Corporate Financial Statement Budgets Template PDF
This slide brings forth dashboard for monitoring and reporting the financial budgets of various branches of an enterprise emphasis on income and expenditure by each branch. The key performing indicators are actual vs budgeted revenue, revenue distribution by branches etc. Showcasing this set of slides titled Dashboard For Monitoring And Corporate Financial Statement Budgets Template PDF. The topics addressed in these templates are Revenue Distribution, Revenue Source, Revenue Expenses. All the content presented in this PPT design is completely editable. Download it and make adjustments in color, background, font etc. as per your unique business setting.
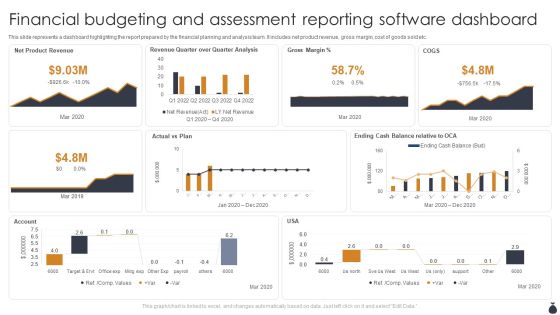
Financial Budgeting And Assessment Reporting Software Dashboard Template PDF
This slide represents a dashboard highlighting the report prepared by the financial planning and analysis team. It includes net product revenue, gross margin, cost of goods sold etc. Showcasing this set of slides titled Financial Budgeting And Assessment Reporting Software Dashboard Template PDF. The topics addressed in these templates are Net Product Revenue, Actual Vs Plan, Account. All the content presented in this PPT design is completely editable. Download it and make adjustments in color, background, font etc. as per your unique business setting.
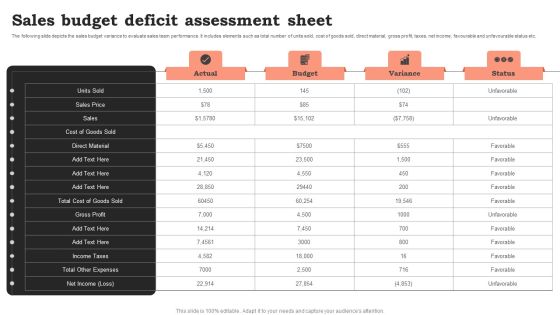
Sales Budget Deficit Assessment Sheet Infographics PDF
The following slide illustrates the process to evaluate budget variances to review actual VS projected cost. It includes elements such as collect data, assess gap, compile management report, adjusts forecast etc. Pitch your topic with ease and precision using this Sales Budget Deficit Assessment Sheet Infographics PDF. This layout presents information on Collect Data, Assess Gap, Adjusts Forecast. It is also available for immediate download and adjustment. So, changes can be made in the color, design, graphics or any other component to create a unique layout.

Business Assessment Outline Business Management Dashboards Budget Ppt Pictures Design Templates PDF
Deliver an awe-inspiring pitch with this creative business assessment outline business management dashboards budget ppt pictures design templates pdf bundle. Topics like actual income vs budget, actual expenses vs budget, actual income vs budget can be discussed with this completely editable template. It is available for immediate download depending on the needs and requirements of the user.

Business Operations Assessment Business Management Dashboards Budget Ppt Infographics Gridlines PDF
Deliver and pitch your topic in the best possible manner with this business operations assessment business management dashboards budget ppt infographics gridlines pdf. Use them to share invaluable insights on actual income vs budget, actual expenses vs budget, payable, budget and impress your audience. This template can be altered and modified as per your expectations. So, grab it now.
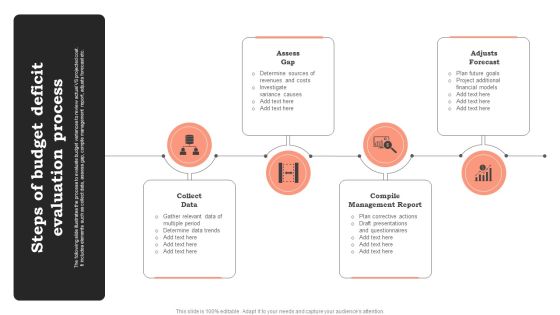
Steps Of Budget Deficit Evaluation Process Diagrams PDF
The following slide illustrates the process to evaluate budget variances to review actual VS projected cost. It includes elements such as collect data, assess gap, compile management report, adjusts forecast etc. Persuade your audience using this Steps Of Budget Deficit Evaluation Process Diagrams PDF. This PPT design covers Three stages, thus making it a great tool to use. It also caters to a variety of topics including Budget Deficit, Evaluation Process. Download this PPT design now to present a convincing pitch that not only emphasizes the topic but also showcases your presentation skills.

Decision Support System Data Warehouse Vs Data Mart Ppt Gallery Portrait PDF
This slide represents a comparison between data warehouse and data mart and how data marts can be designed for sole operational reasons. This is a Decision Support System Data Warehouse Vs Data Mart Ppt Gallery Portrait PDF template with various stages. Focus and dispense information on one stages using this creative set, that comes with editable features. It contains large content boxes to add your information on topics like Data Mart, Sales, Marketing, Finance. You can also showcase facts, figures, and other relevant content using this PPT layout. Grab it now.

Back Propagation Program AI Supervised Vs Unsupervised Machine Learning Techniques Rules PDF
This is a back propagation program ai supervised vs unsupervised machine learning techniques rules pdf template with various stages. Focus and dispense information on two stages using this creative set, that comes with editable features. It contains large content boxes to add your information on topics like input and output data, predictions and predictive models, patterns structure discovery, supervised learning, unsupervised learning. You can also showcase facts, figures, and other relevant content using this PPT layout. Grab it now.
Sales Performance Monthly Strategy Dashboard Icons PDF
Below slide showcases the monthly dashboard of sales performance . Company can measure and evaluate their monthly sales performance using key factors that are sales comparison, monthly sales, planned vs actual sales and gross margin by Pitch your topic with ease and precision using this sales performance monthly strategy dashboard icons pdf. This layout presents information on sales performance monthly strategy dashboard. It is also available for immediate download and adjustment. So, changes can be made in the color, design, graphics or any other component to create a unique layout.
Devops Continuous Workflow Tracking Dashboard Slides PDF
This slide provides the glimpse of facts and figures related to continuous monitoring of project with DevOps. It includes planned vs. completed work items, work item priority wise, active bugs severity wise, etc. Showcasing this set of slides titled Devops Continuous Workflow Tracking Dashboard Slides PDF. The topics addressed in these templates are Continuous Workflow, Tracking Dashboard, Sprint Analysis By Assignee. All the content presented in this PPT design is completely editable. Download it and make adjustments in color, background, font etc. as per your unique business setting.

Crm Sales Rep Dashboard Ppt PowerPoint Presentation Influencers
This is a crm sales rep dashboard ppt powerpoint presentation influencers. This is a three stage process. The stages in this process are opp duration by pipeline, actual vs goal, opportunities est close next 25 days.

Construction Project Quality Management And Performance Monitoring Dashboard Themes PDF
This slide shows the dashboard created for measuring and monitoring the performance quality of the construction project undertaken by the organization. It shows details regarding the project work status, budget variance, actual vs planned resources, workload, project completion percentage, utilized budget etc. of the project.Showcasing this set of slides titled Construction Project Quality Management And Performance Monitoring Dashboard Themes PDF. The topics addressed in these templates are Planned Resources, Project Duration, Budget Variance. All the content presented in this PPT design is completely editable. Download it and make adjustments in color, background, font etc. as per your unique business setting.
Determine IT Project Portfolio Management Tracking Dashboard Clipart PDF
This slide provides information regarding IT project portfolio management tracking dashboard including details about allocated budget across portfolios, used budget percentage, estimated vs. actual cost, etc. Deliver an awe inspiring pitch with this creative Determine IT Project Portfolio Management Tracking Dashboard Clipart PDF bundle. Topics like Financials, Estimated Cost Across Portfolios, Actual Cost Across Portfolios can be discussed with this completely editable template. It is available for immediate download depending on the needs and requirements of the user.
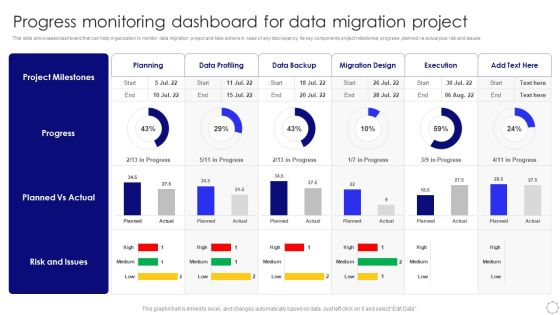
Progress Monitoring Dashboard For Data Migration Project Sample PDF
This slide showcases dashboard that can help organization to monitor data migration project and take actions in case of any discrepancy. Its key components project milestones progress, planned vs actual plus risk and issues. Pitch your topic with ease and precision using this Progress Monitoring Dashboard For Data Migration Project Sample PDF. This layout presents information on Planned Vs Actual, Risk And Issues, Project Milestones. It is also available for immediate download and adjustment. So, changes can be made in the color, design, graphics or any other component to create a unique layout.
Workforce Productivity Tracking Report Kpi Dashboard Icons PDF
The following slide presents the KPAs of project work stream for transparency and better decision making. It includes KPIs such as work stream status, priority check, planned vs actual budget etc. Showcasing this set of slides titled Workforce Productivity Tracking Report Kpi Dashboard Icons PDF. The topics addressed in these templates are Initiation Meeting, Resource Assessment, Technological Analysis. All the content presented in this PPT design is completely editable. Download it and make adjustments in color, background, font etc. as per your unique business setting.

Annual Comparative Assessment Of New Client Acquire Dashboard Topics PDF
The below slide depicts the variance in actual and target KPIs in customer acquisition. It includes previous vs actual year revenue, new customers, average revenue per customer, customer acquisition cost etc. Showcasing this set of slides titled Annual Comparative Assessment Of New Client Acquire Dashboard Topics PDF The topics addressed in these templates are Annual Comparative Assessment OF New Client Acquire Dashboard All the content presented in this PPT design is completely editable. Download it and make adjustments in color, background, font etc. as per your unique business setting.
Workforce Training Performance Tracking Dashboard Contd Mockup PDF
This slide provides information regarding workforce training performance tracking dashboard with training cost, number of participants, hours of training, etc. Deliver and pitch your topic in the best possible manner with this Workforce Training Performance Tracking Dashboard Contd Mockup PDF. Use them to share invaluable insights on Training Cost, Actual Cost Vs Budget, Occupancy Rate and impress your audience. This template can be altered and modified as per your expectations. So, grab it now.

Construction Management Dashboard With Project Phases And Performance Inspiration PDF
This graph for chart is linked to excel, and changes automatically based on data. Just left click on it and select Edit Data. Deliver and pitch your topic in the best possible manner with this Construction Management Dashboard With Project Phases And Performance Inspiration PDF. Use them to share invaluable insights on Project Cost Performance, Actual Cost, Project Performance, Timeline VS Resource Capacity, Time vs Project Phase and impress your audience. This template can be altered and modified as per your expectations. So, grab it now.
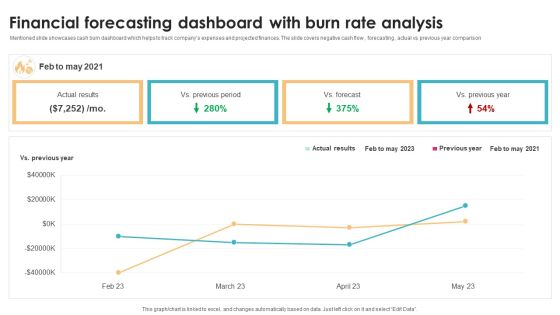
Financial Forecasting Dashboard With Burn Rate Analysis Brochure PDF
Mentioned slide showcases cash burn dashboard which helps to track companys expenses and projected finances. The slide covers negative cash flow , forecasting , actual vs previous year comparison Showcasing this set of slides titled Financial Forecasting Dashboard With Burn Rate Analysis Brochure PDF. The topics addressed in these templates are Previous Year, Analysis, Forecast. All the content presented in this PPT design is completely editable. Download it and make adjustments in color, background, font etc. as per your unique business setting.

Quarterly Analysis Dashboard Of Managing Promotional Activities Ideas PDF
The following slide presents the kpis of marketing operations to assess the performance. It includes quarterly values of elements such as budgeted vs actual total expenditure, impressions, cost per acquisition, clicks etc. Showcasing this set of slides titled Quarterly Analysis Dashboard Of Managing Promotional Activities Ideas PDF. The topics addressed in these templates are Campaign Wise, Daily Impression, Total Impression, Total Clicks. All the content presented in this PPT design is completely editable. Download it and make adjustments in color, background, font etc. as per your unique business setting.

Marketing And Operations Dashboard For Distribution Company Guidelines PDF
This slide covers sales and operations dashboard for distribution company. It involves details such as total sales by location, gross margin, monthly sales trends, average revenue and sales by major customers. Pitch your topic with ease and precision using this Marketing And Operations Dashboard For Distribution Company Guidelines PDF. This layout presents information on Gross Margin, Actual Vs Budget, Product. It is also available for immediate download and adjustment. So, changes can be made in the color, design, graphics or any other component to create a unique layout.

Business Performance Review Dashboard With Customer Acquisition Cost Diagrams PDF
The following slide highlights KPI dashboard which can be used for quarterly business review QBR. It provides detailed information about actual revenue vs target, number of new customers, average revenue per customer, customer acquisition cost CAC etc. Pitch your topic with ease and precision using this Business Performance Review Dashboard With Customer Acquisition Cost Diagrams PDF. This layout presents information on Revenue, Customer Acquisition Cost, Current Quarter. It is also available for immediate download and adjustment. So, changes can be made in the color, design, graphics or any other component to create a unique layout.
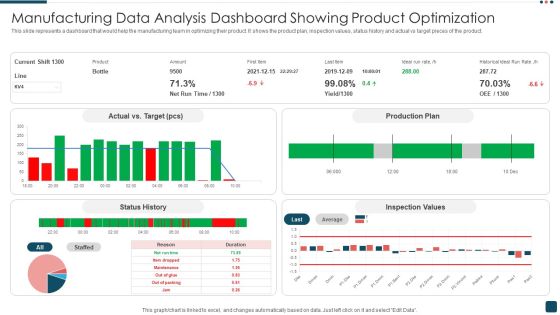
Manufacturing Data Analysis Dashboard Showing Product Optimization Structure PDF
This slide represents a dashboard that would help the manufacturing team in optimizing their product. It shows the product plan, inspection values, status history and actual vs target pieces of the product. Pitch your topic with ease and precision using this Manufacturing Data Analysis Dashboard Showing Product Optimization Structure PDF. This layout presents information on Target, Production Plan, Inspection Values. It is also available for immediate download and adjustment. So, changes can be made in the color, design, graphics or any other component to create a unique layout.
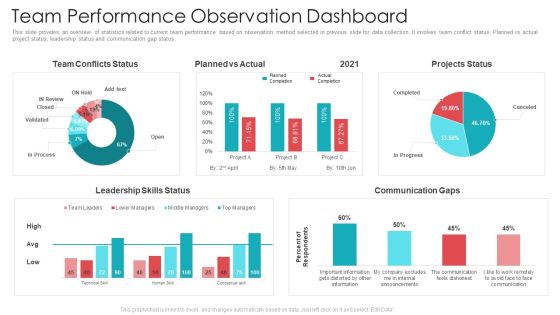
Official Team Collaboration Plan Team Performance Observation Dashboard Background PDF
This slide provides an overview of statistics related to current team performance based on observation method selected in previous slide for data collection. It involves team conflict status, Planned vs actual project status, leadership status and communication gap status. Deliver an awe-inspiring pitch with this creative official team collaboration plan team performance observation dashboard background pdf bundle. Topics like leadership skills status, team conflicts status, communication gaps can be discussed with this completely editable template. It is available for immediate download depending on the needs and requirements of the user.
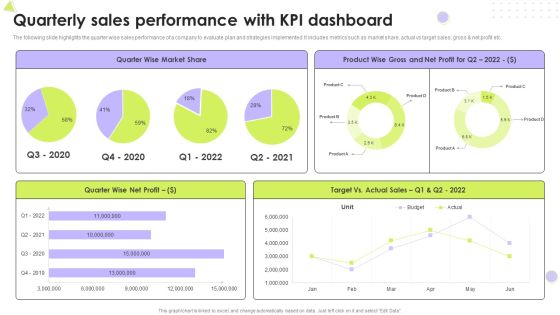
Quarterly Sales Performance With Kpi Dashboard Introduction PDF
The following slide highlights the quarter wise sales performance of a company to evaluate plan and strategies implemented. It includes metrics such as market share, actual vs target sales, gross and net profit etc. Pitch your topic with ease and precision using this Quarterly Sales Performance With Kpi Dashboard Introduction PDF. This layout presents information on Market Share, Net Profit, Target. It is also available for immediate download and adjustment. So, changes can be made in the color, design, graphics or any other component to create a unique layout.

Summary Financial Sales And Profit Margin Analysis Dashboard Pictures PDF
This graph or chart is linked to excel, and changes automatically based on data. Just left click on it and select Edit Data. Deliver an awe inspiring pitch with this creative Summary Financial Sales And Profit Margin Analysis Dashboard Pictures PDF bundle. Topics like Net Profit, Past Year Vs Target Vs Actual, Net Profit Margin By Region, Channel, Expenses Breakdown, Costs And Expenses, Profitability Indicator Ratios can be discussed with this completely editable template. It is available for immediate download depending on the needs and requirements of the user.
Monthly Project Investment Expense Tracking KPI Dashboard Themes PDF
This slide showcases KPI dashboard for analysing the variance between billed and budgeted expenses. It also include metrics such as project budget, potential, billed, cost, margin billed vs. budget labour cost, hours details by resources, etc. Pitch your topic with ease and precision using this Monthly Project Investment Expense Tracking KPI Dashboard Themes PDF. This layout presents information on Project Summary, Sales Potential. It is also available for immediate download and adjustment. So, changes can be made in the color, design, graphics or any other component to create a unique layout.

Dashboard For Real Time Telemarketing Process Management Themes PDF
The following slide highlights the dashboard for real time telesales process management illustrating real time data, employee data, performance, daily data, average handled call vs average answered call, employee ranking, AHT, AvgACW, ASA and hold percentage Showcasing this set of slides titled dashboard for real time telemarketing process management themes pdf The topics addressed in these templates are dashboard for real time telemarketing process management All the content presented in this PPT design is completely editable. Download it and make adjustments in color, background, font etc. as per your unique business setting.

KPI Dashboard Showing Healthcare Employees Statistics Graphics PDF
The following slide outlines a comprehensive healthcare dashboard showing various workforce trends. It covers information about doctors and nurses organic growth, shortages of doctors nurses, local vs foreign trained healthcare employees etc. Showcasing this set of slides titled KPI Dashboard Showing Healthcare Employees Statistics Graphics PDF. The topics addressed in these templates are Shortage Doctors, Shortage Nurse, Organic Growth. All the content presented in this PPT design is completely editable. Download it and make adjustments in color, background, font etc. as per your unique business setting.

Business Opportunity Dashboard With Customer Metrics Information PDF
This Slide illustrates market opportunity dashboard with customer metrics which contains favorable net promoter score NPS, standard customers, growth rate, cumulative average of customer location, net income vs projection, customer distribution, sales by representatives, etc. Pitch your topic with ease and precision using this Business Opportunity Dashboard With Customer Metrics Information PDF. This layout presents information on Customer Distribution, Growth Rate, Top Customers Locations. It is also available for immediate download and adjustment. So, changes can be made in the color, design, graphics or any other component to create a unique layout.

Quality Assurance Model For Agile IT KPI Dashboard To Monitor Software Development Elements PDF
Following slide displays software development project status monitoring dashboard with KPIS namely overall task status, actual Vs planned budget, pending items. Deliver an awe inspiring pitch with this creative quality assurance model for agile it kpi dashboard to monitor software development elements pdf bundle. Topics like overall task status, budget in dollar mm, pending item, technical requests can be discussed with this completely editable template. It is available for immediate download depending on the needs and requirements of the user.
Improved Digital Expenditure Determine IT Project Portfolio Management Tracking Dashboard Designs PDF
This slide provides information regarding IT project portfolio management tracking dashboard including details about allocated budget across portfolios, used budget percentage, estimated vs. actual cost, etc. Deliver an awe inspiring pitch with this creative Improved Digital Expenditure Determine IT Project Portfolio Management Tracking Dashboard Designs PDF bundle. Topics like Allocated Budget, Budget Across, Allocated Budget can be discussed with this completely editable template. It is available for immediate download depending on the needs and requirements of the user.

Development And Operations Pipeline IT KPI Dashboard For Monitoring Project Progress Ideas PDF
Following slide displays KPI dashboard for monitoring project progress. KPIS covered here are planned versus actual hours, risks and issues. Deliver and pitch your topic in the best possible manner with this development and operations pipeline it kpi dashboard for monitoring project progress ideas pdf. Use them to share invaluable insights on project kpis, progress, planned vs actual hours, risks and issues and impress your audience. This template can be altered and modified as per your expectations. So, grab it now.
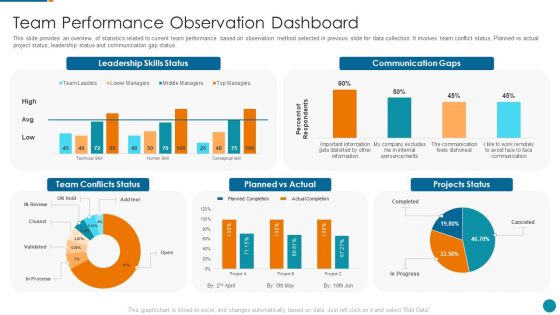
Strategic Procedure To Improve Employee Efficiency Team Performance Observation Dashboard Formats PDF
This slide provides an overview of statistics related to current team performance based on observation method selected in previous slide for data collection. It involves team conflict status, Planned vs actual project status, leadership status and communication gap status.Deliver an awe inspiring pitch with this creative strategic procedure to improve employee efficiency team performance observation dashboard formats pdf bundle. Topics like leadership skills status, communication gaps, planned vs actual can be discussed with this completely editable template. It is available for immediate download depending on the needs and requirements of the user.
Determine IT Project Portfolio Management Tracking Dashboard Ppt Slides Pictures PDF
This slide provides information regarding IT project portfolio management tracking dashboard including details about allocated budget across portfolios, used budget percentage, estimated vs. actual cost, etc. Deliver an awe inspiring pitch with this creative determine it project portfolio management tracking dashboard ppt slides pictures pdf bundle. Topics like budget across portfolios, budget percentage, financials can be discussed with this completely editable template. It is available for immediate download depending on the needs and requirements of the user.

CIO For IT Cost Optimization Techniques Determine IT Project Portfolio Management Tracking Dashboard Ideas PDF
This slide provides information regarding IT project portfolio management tracking dashboard including details about allocated budget across portfolios, used budget percentage, estimated vs. actual cost, etc. Deliver an awe inspiring pitch with this creative CIO For IT Cost Optimization Techniques Determine IT Project Portfolio Management Tracking Dashboard Ideas PDF bundle. Topics like Financials, Budget Across Portfolios, Strategic Intiatives can be discussed with this completely editable template. It is available for immediate download depending on the needs and requirements of the user.
IT Spend Management Priorities By Cios Determine IT Project Portfolio Management Tracking Dashboard Icons PDF
This slide provides information regarding IT project portfolio management tracking dashboard including details about allocated budget across portfolios, used budget percentage, estimated vs. actual cost, etc. Deliver an awe inspiring pitch with this creative IT Spend Management Priorities By Cios Determine IT Project Portfolio Management Tracking Dashboard Icons PDF bundle. Topics like Allocated Budget, Across Portfolios, Estimated Cost can be discussed with this completely editable template. It is available for immediate download depending on the needs and requirements of the user.

Cios Value Optimization Determine IT Project Portfolio Management Tracking Dashboard Structure PDF
This slide provides information regarding IT project portfolio management tracking dashboard including details about allocated budget across portfolios, used budget percentage, estimated vs. actual cost, etc. Deliver an awe inspiring pitch with this creative Cios Value Optimization Determine IT Project Portfolio Management Tracking Dashboard Structure PDF bundle. Topics like Allocated Budget, Across Portfolios, Financials Cost can be discussed with this completely editable template. It is available for immediate download depending on the needs and requirements of the user.

KPI Dashboard To Monitor Software Development Project Status Task Professional PDF
Following slide displays software development project status monitoring dashboard with KPIS namely overall task status, actual Vs planned budget, pending items. Deliver and pitch your topic in the best possible manner with this kpi dashboard to monitor software development project status task professional pdf. Use them to share invaluable insights on overall task status, budget, resource plan, system testing and impress your audience. This template can be altered and modified as per your expectations. So, grab it now.
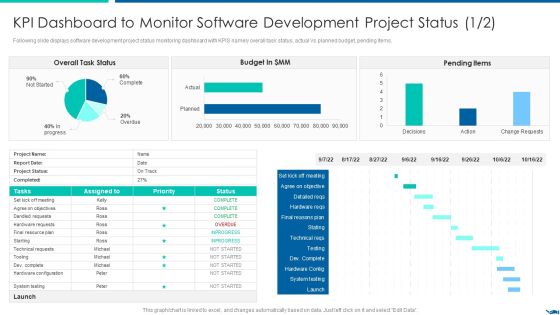
KPI Dashboard To Monitor Software Development Project QA Through Agile Methodology IT Topics PDF
Following slide displays software development project status monitoring dashboard with KPIS namely overall task status, actual Vs planned budget, pending items.Deliver and pitch your topic in the best possible manner with this KPI Dashboard To Monitor Software Development Project QA Through Agile Methodology IT Topics PDF Use them to share invaluable insights on Kpi Dashboard To Monitor Software Development Project Status and impress your audience. This template can be altered and modified as per your expectations. So, grab it now.
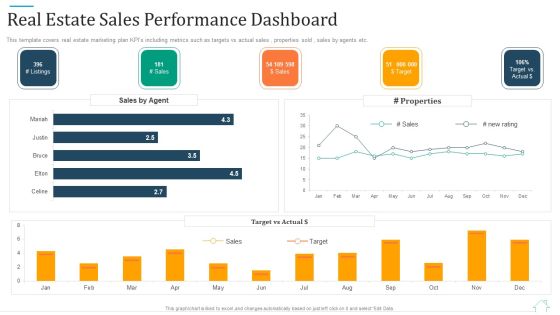
Promotional Strategy For Real Estate Project Real Estate Sales Performance Dashboard Information PDF
This template covers real estate marketing plan KPIs including metrics such as targets vs actual sales , properties sold , sales by agents etc. Deliver an awe inspiring pitch with this creative promotional strategy for real estate project real estate sales performance dashboard information pdf bundle. Topics like real estate sales performance dashboard can be discussed with this completely editable template. It is available for immediate download depending on the needs and requirements of the user.

Real Estate Marketing Strategy Vendors Real Estate Sales Performance Dashboard Graphics PDF
This template covers real estate marketing plan KPIs including metrics such as targets vs actual sales , properties sold , sales by agents etc. Deliver an awe inspiring pitch with this creative real estate marketing strategy vendors real estate sales performance dashboard graphics pdf bundle. Topics like target, sales, performance dashboard can be discussed with this completely editable template. It is available for immediate download depending on the needs and requirements of the user.

Growing Churn Rate In IT Organization Dashboard Employee Attrition Rate Employee Download PDF
Deliver and pitch your topic in the best possible manner with this growing churn rate in it organization dashboard employee attrition rate employee download pdf. Use them to share invaluable insights on turnover rate year over year, turnover rate by division, actual vs benchmark work time in months per division and impress your audience. This template can be altered and modified as per your expectations. So, grab it now.

Information Technology Company Monthly Sales Forecast Dashboard Ppt Portfolio Images PDF
This slide shows the dashboard representing the data related to monthly sales forecast of an Information Technology Company. It shows information related to the net sales by customer, variance between actual and forecasted sales, total net sales, net sales per customer and total net sales per time for actual and forecasted sales. Pitch your topic with ease and precision using this Information Technology Company Monthly Sales Forecast Dashboard Ppt Portfolio Images PDF. This layout presents information on Total Net Sales, Actual vs Forecast, Net Sales Customer. It is also available for immediate download and adjustment. So, changes can be made in the color, design, graphics or any other component to create a unique layout.

Strategy To Improve Team Proficiency Team Performance Observation Dashboard Diagrams PDF
This slide provides an overview of statistics related to current team performance based on observation method selected in previous slide for data collection. It involves team conflict status, Planned vs actual project status, leadership status and communication gap status. Deliver an awe inspiring pitch with this creative proficiency team performance observation dashboard diagrams pdf bundle. Topics like team performance observation dashboard can be discussed with this completely editable template. It is available for immediate download depending on the needs and requirements of the user.
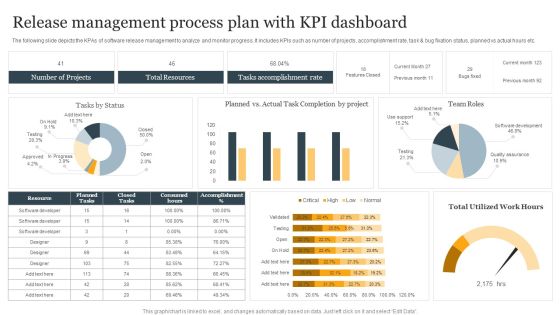
Release Management Process Plan With KPI Dashboard Ppt Infographic Template Structure PDF
The following slide depicts the KPAs of software release management to analyze and monitor progress. It includes KPIs such as number of projects, accomplishment rate, task and bug fixation status, planned vs actual hours etc. Showcasing this set of slides titled Release Management Process Plan With KPI Dashboard Ppt Infographic Template Structure PDF. The topics addressed in these templates are Number Of Projects, Total Resources, Tasks Accomplishment Rate. All the content presented in this PPT design is completely editable. Download it and make adjustments in color, background, font etc. as per your unique business setting.

Best Techniques For Agile Project Cost Assessment Dashboard To Track Cost Associated Formats PDF
This slide provides information regarding dashboard to track cost associated with project development in terms of total revenue, tasks by status, total vs actual project progress, etc. Do you have an important presentation coming up Are you looking for something that will make your presentation stand out from the rest Look no further than Best Techniques For Agile Project Cost Assessment Dashboard To Track Cost Associated Formats PDF. With our professional designs, you can trust that your presentation will pop and make delivering it a smooth process. And with Slidegeeks, you can trust that your presentation will be unique and memorable. So why wait Grab Best Techniques For Agile Project Cost Assessment Dashboard To Track Cost Associated Formats PDF today and make your presentation stand out from the rest

Deploying Revitalization Strategy Enhance Product And Service Sales Product Reposition Dashboard Highlighting Brochure PDF
This slide highlights the product reposition dashboard which showcases market share in regions, emerging markets, after repositioning planned vs actual sales and product revenue by month. Do you have an important presentation coming up Are you looking for something that will make your presentation stand out from the rest Look no further than Deploying Revitalization Strategy Enhance Product And Service Sales Product Reposition Dashboard Highlighting Brochure PDF. With our professional designs, you can trust that your presentation will pop and make delivering it a smooth process. And with Slidegeeks, you can trust that your presentation will be unique and memorable. So why wait Grab Deploying Revitalization Strategy Enhance Product And Service Sales Product Reposition Dashboard Highlighting Brochure PDF today and make your presentation stand out from the rest.
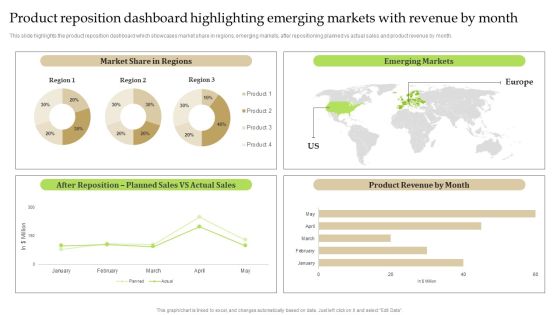
Product Reposition Dashboard Highlighting Emerging Markets With Revenue By Month Brochure PDF
This slide highlights the product reposition dashboard which showcases market share in regions, emerging markets, after repositioning planned vs actual sales and product revenue by month. Are you searching for a Product Reposition Dashboard Highlighting Emerging Markets With Revenue By Month Brochure PDF that is uncluttered, straightforward, and original Its easy to edit, and you can change the colors to suit your personal or business branding. For a presentation that expresses how much effort you have put in, this template is ideal. With all of its features, including tables, diagrams, statistics, and lists, its perfect for a business plan presentation. Make your ideas more appealing with these professional slides. Download Product Reposition Dashboard Highlighting Emerging Markets With Revenue By Month Brochure PDF from Slidegeeks today.

Boosting Yearly Business Revenue KPI Dashboard To Track Sales Plan Performance Topics PDF
This slide shows dashboard which can be used by organizations to measure the results of sales plan. It includes metrics such as sales per product, actual vs target sales, sales by region, sales by channel, etc. Boost your pitch with our creative Boosting Yearly Business Revenue KPI Dashboard To Track Sales Plan Performance Topics PDF. Deliver an awe-inspiring pitch that will mesmerize everyone. Using these presentation templates you will surely catch everyones attention. You can browse the ppts collection on our website. We have researchers who are experts at creating the right content for the templates. So you dont have to invest time in any additional work. Just grab the template now and use them.
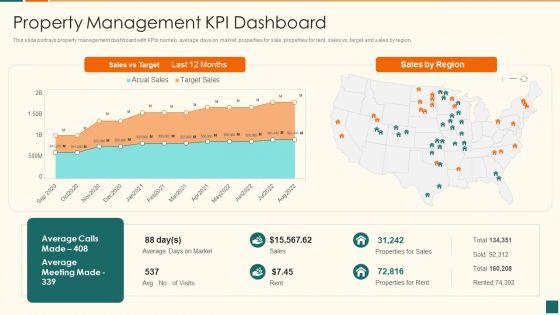
Developing Marketing Campaign For Real Estate Project Property Management Kpi Dashboard Formats PDF
This slide portrays property management dashboard with KPIs namely, average days on market, properties for sale, properties for rent, sales vs. target and sales by region. Deliver and pitch your topic in the best possible manner with this developing marketing campaign for real estate project property management kpi dashboard formats pdf. Use them to share invaluable insights on sales vs target, sales by region and impress your audience. This template can be altered and modified as per your expectations. So, grab it now.

Kpi Dashboard Highlighting Results Of Human Resource Training Administration Background PDF
Mentioned slide outlines a dashboard through which the organization can track and evaluate the results of Human Resource Training Administration. It provides information about metrics such as training budget, total cost, cost per participant, total hours of training, etc. Showcasing this set of slides titled Kpi Dashboard Highlighting Results Of Human Resource Training Administration Background PDF. The topics addressed in these templates are Actual Cost Vs, Training Budget, Approved Training Budget, Online Training. All the content presented in this PPT design is completely editable. Download it and make adjustments in color, background, font etc. as per your unique business setting.
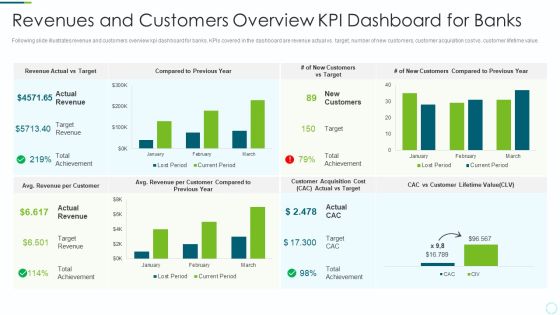
Implementing BPM Techniques Revenues And Customers Overview KPI Dashboard For Banks Microsoft PDF
Following slide illustrates revenue and customers overview kpi dashboard for banks. KPIs covered in the dashboard are revenue actual vs. target, number of new customers, customer acquisition cost vs. customer lifetime value. Deliver an awe inspiring pitch with this creative Implementing BPM Techniques Revenues And Customers Overview KPI Dashboard For Banks Microsoft PDF bundle. Topics like Target Revenue, Customers Compared, Customer Lifetime can be discussed with this completely editable template. It is available for immediate download depending on the needs and requirements of the user.

Techniques For Timely Project Dashboard To Monitor Project Status And Performance Microsoft PDF
This slide focuses on dashboard to monitor project status and performance which includes estimated budget, actual cost, time taken by project team to complete phases, completion percentage of project, etc. Deliver and pitch your topic in the best possible manner with this Techniques For Timely Project Dashboard To Monitor Project Status And Performance Microsoft PDF. Use them to share invaluable insights on Timeline vs, Resource Capacity, Project Phase, Time Involved and impress your audience. This template can be altered and modified as per your expectations. So, grab it now.

Organic Business Growth Strategies Dashboard To Analyse Organic Growth Post Global Expansion Background PDF
Purpose of the following slide is to display a dashboard to help analyze the organic growth through essential metrics such as actual vs. target sales, gross profit, sales growth etc. Deliver and pitch your topic in the best possible manner with this Organic Business Growth Strategies Dashboard To Analyse Organic Growth Post Global Expansion Background PDF. Use them to share invaluable insights on Sales, Product, Target and impress your audience. This template can be altered and modified as per your expectations. So, grab it now.

Economic Facts And Insights Dashboard For Cash Management Ppt PowerPoint Presentation Outline Guide PDF
Pitch your topic with ease and precision using this economic facts and insights dashboard for cash management ppt powerpoint presentation outline guide pdf. This layout presents information on days sales outstanding, days inventory outstanding, days payable outstanding, accounts payable by payment target, inventory, ar turnover vs ap turnover. It is also available for immediate download and adjustment. So, changes can be made in the color, design, graphics or any other component to create a unique layout.
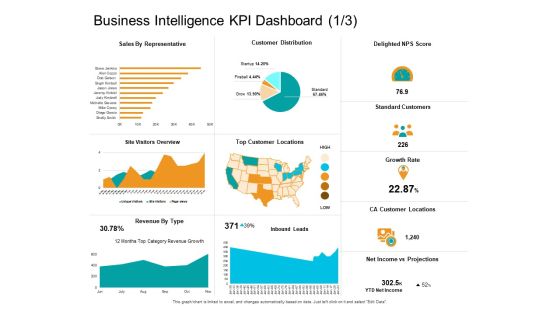
Facts Assessment Business Intelligence KPI Dashboard Expenses Ppt PowerPoint Presentation Layouts Background Images PDF
Presenting this set of slides with name facts assessment business intelligence kpi dashboard expenses ppt powerpoint presentation layouts background images pdf. The topics discussed in these slides are sales representative, delighted nps score, standard customers, growth rate, ca customer locations, net income vs projections, revenue type, top customer locations, customer distribution. This is a completely editable PowerPoint presentation and is available for immediate download. Download now and impress your audience.

Firm Productivity Administration Business Intelligence KPI Dashboard Score Ppt PowerPoint Presentation Infographic Template Display PDF
Presenting this set of slides with name firm productivity administration business intelligence kpi dashboard score ppt powerpoint presentation infographic template display pdf. The topics discussed in these slides are sales representative, delighted nps score, standard customers, growth rate, ca customer locations, net income vs projections, revenue type, top customer locations, customer distribution. This is a completely editable PowerPoint presentation and is available for immediate download. Download now and impress your audience.
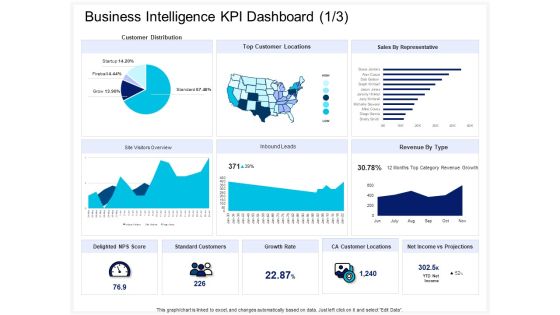
Enterprise Problem Solving And Intellect Business Intelligence KPI Dashboard Growth Ppt PowerPoint Presentation Model Images PDF
Presenting this set of slides with name enterprise problem solving and intellect business intelligence kpi dashboard growth ppt powerpoint presentation model images pdf. The topics discussed in these slides are sales representative, delighted nps score, standard customers, growth rate, ca customer locations, net income vs projections, revenue type, top customer locations, customer distribution. This is a completely editable PowerPoint presentation and is available for immediate download. Download now and impress your audience.

BPM Tools Application To Increase Revenues And Customers Overview KPI Dashboard For Banks Clipart PDF
Following slide illustrates revenue and customers overview kip dashboard for banks. KPIs covered in the dashboard are revenue actual vs. target, number of new customers, customer acquisition cost vs. customer lifetime value. Get a simple yet stunning designed BPM Tools Application To Increase Revenues And Customers Overview KPI Dashboard For Banks Clipart PDF. It is the best one to establish the tone in your meetings. It is an excellent way to make your presentations highly effective. So, download this PPT today from Slidegeeks and see the positive impacts. Our easy-to-edit BPM Tools Application To Increase Revenues And Customers Overview KPI Dashboard For Banks Clipart PDF can be your go-to option for all upcoming conferences and meetings. So, what are you waiting for Grab this template today.
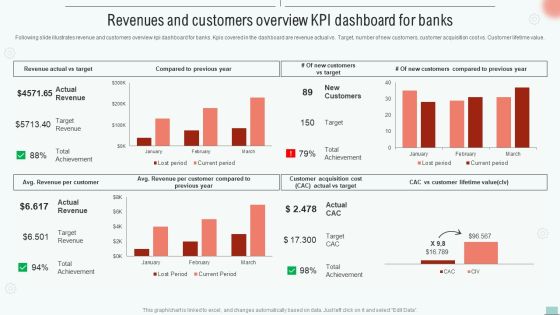
Implementing BPM Tool To Enhance Operational Efficiency Revenues And Customers Overview Kpi Dashboard Rules PDF
Following slide illustrates revenue and customers overview kpi dashboard for banks. Kpis covered in the dashboard are revenue actual vs. Target, number of new customers, customer acquisition cost vs. Customer lifetime value.This Implementing BPM Tool To Enhance Operational Efficiency Revenues And Customers Overview Kpi Dashboard Rules PDF is perfect for any presentation, be it in front of clients or colleagues. It is a versatile and stylish solution for organizing your meetings. The Implementing BPM Tool To Enhance Operational Efficiency Revenues And Customers Overview Kpi Dashboard Rules PDF features a modern design for your presentation meetings. The adjustable and customizable slides provide unlimited possibilities for acing up your presentation. Slidegeeks has done all the homework before launching the product for you. So, do not wait, grab the presentation templates today.

KPI Dashboard To Track Effectiveness Of Real Estate Business Performance Slides PDF
The following slide exhibits key performance indicator KPI dashboard which can be used to measure the financial performance of the real estate company. It covers various kpis such as sales vs target per agent, top 10 projects, top 5 agencies etc. Deliver an awe inspiring pitch with this creative KPI Dashboard To Track Effectiveness Of Real Estate Business Performance Slides PDF bundle. Topics like KPI Dashboard, Track Effectiveness, Real Estate Business Performance can be discussed with this completely editable template. It is available for immediate download depending on the needs and requirements of the user.
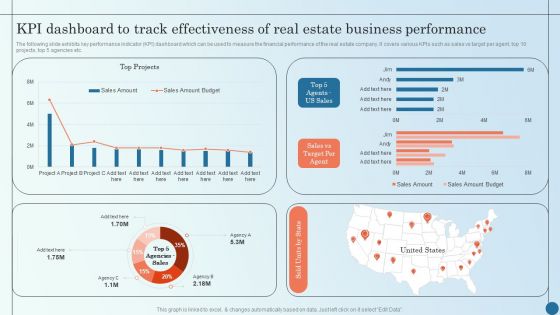
KPI Dashboard To Track Effectiveness Of Real Estate Business Managing Commercial Property Risks Demonstration PDF
The following slide exhibits key performance indicator KPI dashboard which can be used to measure the financial performance of the real estate company. It covers various KPIs such as sales vs target per agent, top 10 projects, top 5 agencies etc.Deliver an awe inspiring pitch with this creative KPI Dashboard To Track Effectiveness Of Real Estate Business Managing Commercial Property Risks Demonstration PDF bundle. Topics like Kpi Dashboard, Track Effectiveness, Estate Business can be discussed with this completely editable template. It is available for immediate download depending on the needs and requirements of the user.

Monthly Real Estate Sales Dashboard For Real Estate Business Ppt PowerPoint Presentation File Skills PDF
This slide showcases property sales dashboard to track progress and communicate key development to management. It further includes details such as US sales, target per employee, top selling segments, etc. Showcasing this set of slides titled Monthly Real Estate Sales Dashboard For Real Estate Business Ppt PowerPoint Presentation File Skills PDF. The topics addressed in these templates are Top 5 Sales Segments, Sold Units By State, Top 10 Projects, Sales Vs Target Per Agent. All the content presented in this PPT design is completely editable. Download it and make adjustments in color, background, font etc. as per your unique business setting.

KPI Dashboard To Track Effectiveness Of Real Estate Business Performance Guidelines PDF
The following slide exhibits key performance indicator KPI dashboard which can be used to measure the financial performance of the real estate company. It covers various kpis such as sales vs target per agent, top 10 projects, top 5 agencies etc.Deliver an awe inspiring pitch with this creative KPI Dashboard To Track Effectiveness Of Real Estate Business Performance Guidelines PDF bundle. Topics like Top Projects, Sales Amount, Sales Amount can be discussed with this completely editable template. It is available for immediate download depending on the needs and requirements of the user.

Successful Risk Administration KPI Dashboard To Track Effectiveness Of Real Estate Business Template PDF
The following slide exhibits key performance indicator KPI dashboard which can be used to measure the financial performance of the real estate company. It covers various kpis such as sales vs target per agent, top 10 projects, top 5 agencies etc. If your project calls for a presentation, then Slidegeeks is your go-to partner because we have professionally designed, easy-to-edit templates that are perfect for any presentation. After downloading, you can easily edit Successful Risk Administration KPI Dashboard To Track Effectiveness Of Real Estate Business Template PDF and make the changes accordingly. You can rearrange slides or fill them with different images. Check out all the handy templates.

CRM Performance Metrics Dashboard Showing Sales In Real Estate Customer Information PDF
This slide represents the dashboard showing the sales performance of a real estate company. It includes details related top 5 agents US sales, sales vs target per agent, top 5 banks-sold units, sales by top 5 agencies. Pitch your topic with ease and precision using this CRM Performance Metrics Dashboard Showing Sales In Real Estate Customer Information PDF. This layout presents information on Us Sales, Sold Units, Target Per Agent. It is also available for immediate download and adjustment. So, changes can be made in the color, design, graphics or any other component to create a unique layout.
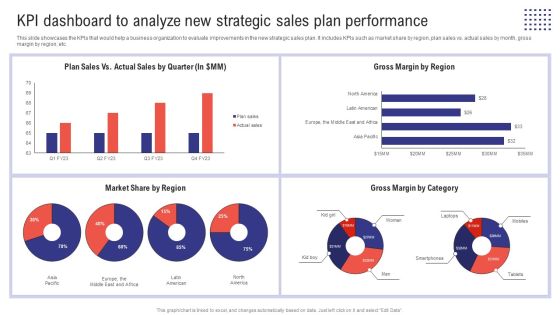
Planning Sales Campaign To Improve KPI Dashboard To Analyze New Strategic Sales Plan Information PDF
This slide showcases the KPIs that would help a business organization to evaluate improvements in the new strategic sales plan. It includes KPIs such as market share by region, plan sales vs. actual sales by month, gross margin by region, etc. Welcome to our selection of the Planning Sales Campaign To Improve KPI Dashboard To Analyze New Strategic Sales Plan Information PDF. These are designed to help you showcase your creativity and bring your sphere to life. Planning and Innovation are essential for any business that is just starting out. This collection contains the designs that you need for your everyday presentations. All of our PowerPoints are 100 percent editable, so you can customize them to suit your needs. This multi-purpose template can be used in various situations. Grab these presentation templates today.

Executing Risk Mitigation KPI Dashboard To Track Effectiveness Of Real Estate Rules PDF
The following slide exhibits key performance indicator KPI dashboard which can be used to measure the financial performance of the real estate company. It covers various KPIs such as sales vs target per agent, top 10 projects, top 5 agencies etc. Find highly impressive Executing Risk Mitigation KPI Dashboard To Track Effectiveness Of Real Estate Rules PDF on Slidegeeks to deliver a meaningful presentation. You can save an ample amount of time using these presentation templates. No need to worry to prepare everything from scratch because Slidegeeks experts have already done a huge research and work for you. You need to download Executing Risk Mitigation Kpi Dashboard To Track Effectiveness Of Real Estate Rules PDF for your upcoming presentation. All the presentation templates are 100 percent editable and you can change the color and personalize the content accordingly. Download now.
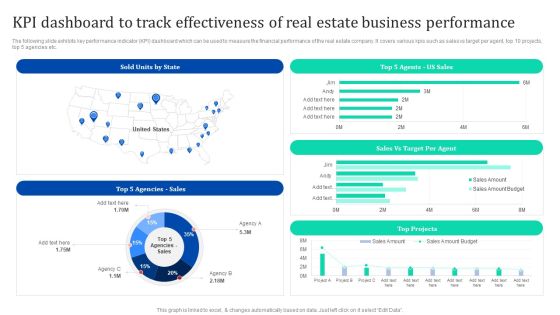
KPI Dashboard To Track Effectiveness Of Real Estate Business Enhancing Process Improvement By Regularly Themes PDF
The following slide exhibits key performance indicator KPI dashboard which can be used to measure the financial performance of the real estate company. It covers various kpis such as sales vs target per agent, top 10 projects, top 5 agencies etc. Welcome to our selection of the KPI Dashboard To Track Effectiveness Of Real Estate Business Enhancing Process Improvement By Regularly Themes PDF. These are designed to help you showcase your creativity and bring your sphere to life. Planning and Innovation are essential for any business that is just starting out. This collection contains the designs that you need for your everyday presentations. All of our PowerPoints are 100 parcent editable, so you can customize them to suit your needs. This multi-purpose template can be used in various situations. Grab these presentation templates today.

Real Estate Marketing Plan To Sell Property Management KPI Dashboard Professional PDF
This slide portrays property management dashboard with KPIs namely, average days on market, properties for sale, properties for rent, sales vs. target and sales by region.Deliver and pitch your topic in the best possible manner with this Real Estate Marketing Plan To Sell Property Management KPI Dashboard Professional PDF Use them to share invaluable insights on Property Management KPI Dashboard and impress your audience. This template can be altered and modified as per your expectations. So, grab it now.

Marketing Strategy To Enhance Real Estate Sales Property Management Kpi Dashboard Slides PDF
This slide portrays property management dashboard with KPIs namely, average days on market, properties for sale, properties for rent, sales vs. target and sales by region. Deliver and pitch your topic in the best possible manner with this Marketing Strategy To Enhance Real Estate Sales Property Management Kpi Dashboard Slides PDF. Use them to share invaluable insights on Average, Market, Sales and impress your audience. This template can be altered and modified as per your expectations. So, grab it now.

Building Promotional Campaign Real Estate Sales Real Estate Dashboard To Monitor Sales Team Performance Guidelines PDF
This slide portrays property management dashboard with KPIs namely, average days on market, properties for sale, properties for rent, sales vs. target and sales by region. Deliver and pitch your topic in the best possible manner with this building promotional campaign real estate sales real estate dashboard to monitor sales team performance guidelines pdf. Use them to share invaluable insights on property management kpi dashboard and impress your audience. This template can be altered and modified as per your expectations. So, grab it now.
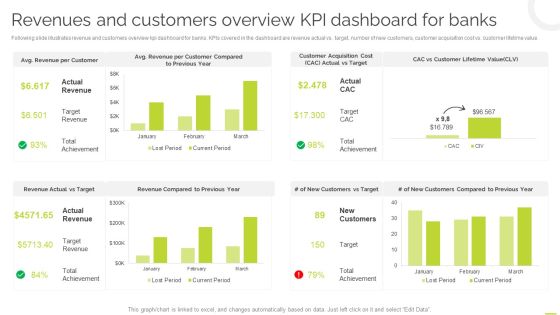
Effective BPM Tool For Business Process Management Revenues And Customers Overview KPI Dashboard For Banks Elements PDF
Following slide illustrates revenue and customers overview kpi dashboard for banks. KPIs covered in the dashboard are revenue actual vs target, number of new customers, customer acquisition cost vs. customer lifetime value. This Effective BPM Tool For Business Process Management Revenues And Customers Overview KPI Dashboard For Banks Elements PDF is perfect for any presentation, be it in front of clients or colleagues. It is a versatile and stylish solution for organizing your meetings. The Effective BPM Tool For Business Process Management Revenues And Customers Overview KPI Dashboard For Banks Elements PDF features a modern design for your presentation meetings. The adjustable and customizable slides provide unlimited possibilities for acing up your presentation. Slidegeeks has done all the homework before launching the product for you. So, do not wait, grab the presentation templates today.

Enterprise Governance Business Management Dashboards Mar Download PDF
Deliver and pitch your topic in the best possible manner with this enterprise governance business management dashboards mar download pdf. Use them to share invaluable insights on actual expenses vs budget, actual income vs budget and impress your audience. This template can be altered and modified as per your expectations. So, grab it now.

Business Strategy Development Process Business Management Dashboards Balance Download PDF
Deliver an awe inspiring pitch with this creative business strategy development process business management dashboards balance download pdf bundle. Topics like actual income vs budget, actual expenses vs budget can be discussed with this completely editable template. It is available for immediate download depending on the needs and requirements of the user.

Corporate Governance Business Management Dashboards Gride Formats PDF
Deliver an awe inspiring pitch with this creative corporate governance business management dashboards gride formats pdf bundle. Topics like actual income vs budget, actual expenses vs budget can be discussed with this completely editable template. It is available for immediate download depending on the needs and requirements of the user.

Enterprise Management Business Management Dashboards Jan Slides PDF
Deliver and pitch your topic in the best possible manner with this enterprise management business management dashboards jan slides pdf. Use them to share invaluable insights on actual income vs budget, actual expenses vs budget, balance and impress your audience. This template can be altered and modified as per your expectations. So, grab it now.
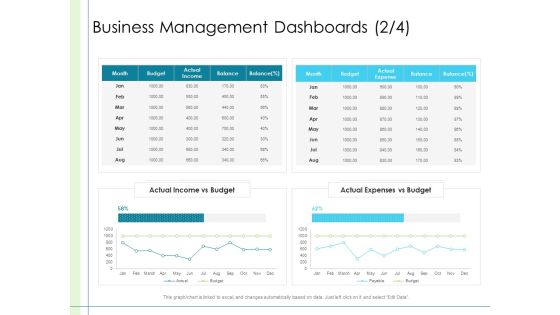
In Depth Business Assessment Business Management Dashboards Income Ppt PowerPoint Presentation Gallery Outline PDF
Deliver and pitch your topic in the best possible manner with this in depth business assessment business management dashboards income ppt powerpoint presentation gallery outline pdf. Use them to share invaluable insights on actual income vs budget, actual expenses vs budget, payable, budget and impress your audience. This template can be altered and modified as per your expectations. So, grab it now.

Administrative Regulation Business Management Dashboards Ppt PowerPoint Presentation Model Inspiration PDF
Deliver and pitch your topic in the best possible manner with this administrative regulation business management dashboards ppt powerpoint presentation model inspiration pdf. Use them to share invaluable insights on actual income vs budget, actual expenses vs budget, payable, budget and impress your audience. This template can be altered and modified as per your expectations. So, grab it now.

Corporate Regulation Business Management Dashboards Expenses Ppt Outline Designs Download PDF
Deliver an awe inspiring pitch with this creative corporate regulation business management dashboards expenses ppt outline designs download pdf bundle. Topics like actual income vs budget, actual expenses vs budget can be discussed with this completely editable template. It is available for immediate download depending on the needs and requirements of the user.

Business Management Dashboards Expenses Business Analysis Method Ppt Professional Template PDF
Deliver an awe inspiring pitch with this creative business management dashboards expenses business analysis method ppt professional template pdf bundle. Topics like actual income vs budget, actual expenses vs budget can be discussed with this completely editable template. It is available for immediate download depending on the needs and requirements of the user.
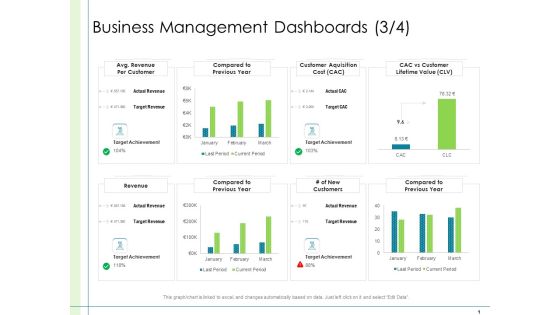
In Depth Business Assessment Business Management Dashboards Target Ppt PowerPoint Presentation Infographic Template Inspiration PDF
Deliver and pitch your topic in the best possible manner with this in depth business assessment business management dashboards target ppt powerpoint presentation infographic template inspiration pdf. Use them to share invaluable insights on avg revenue per customer, compared to previous year, customer aquisition cost, cac vs customer lifetime value, target achievement, compared to previous year, revenue, actual revenue, target revenue and impress your audience. This template can be altered and modified as per your expectations. So, grab it now.

Steps To Achieve ISO 9001 Certification ISO 9001 And Qms Dashboards Portrait PDF
Deliver an awe inspiring pitch with this creative Steps To Achieve ISO 9001 Certification ISO 9001 And Qms Dashboards Portrait PDF bundle. Topics like Qms Dashboards, Planned Vs Actual, Risks Matrix can be discussed with this completely editable template. It is available for immediate download depending on the needs and requirements of the user.
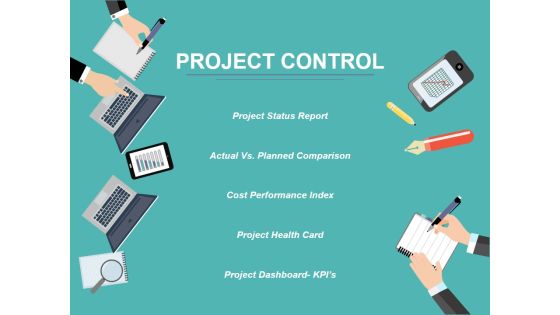
Project Control Ppt PowerPoint Presentation Ideas Graphics Template
This is a project control ppt powerpoint presentation ideas graphics template. This is a five stage process. The stages in this process are project status report, actual vs planned comparison, cost performance index, project health card, project dashboard kpis.

Organizations Business Projects Status Report Template Diagrams PDF
The slide showcases a project status dashboard for an organizations multiple operational projects. It highlights teams, project health report, risk status, planned vs actual budget and schedule. Pitch your topic with ease and precision using this Organizations Business Projects Status Report Template Diagrams PDF. This layout presents information on Organizations Business, Projects Status, Report. It is also available for immediate download and adjustment. So, changes can be made in the color, design, graphics or any other component to create a unique layout.

Business Projects Progress Status Report Template Elements PDF
The slide depicts a dashboard for providing insights on marketing progress status report of a B2C enterprise. It highlights program health, portfolio trend, actual vs planned budget, risk, schedule and task owners. Pitch your topic with ease and precision using this Business Projects Progress Status Report Template Elements PDF. This layout presents information on Program Health, Portfolio Trend, Actual Spend, Risk Projects. It is also available for immediate download and adjustment. So, changes can be made in the color, design, graphics or any other component to create a unique layout.

Cios Methodologies To Improve IT Spending Determine It Project Portfolio Management Microsoft PDF
This slide provides information regarding IT project portfolio management tracking dashboard including details about allocated budget across portfolios, used budget percentage, estimated vs. actual cost, etc. Deliver an awe inspiring pitch with this creative Cios Methodologies To Improve IT Spending Determine It Project Portfolio Management Microsoft PDF bundle. Topics like Return On Investment, Revenue, Break Down can be discussed with this completely editable template. It is available for immediate download depending on the needs and requirements of the user.
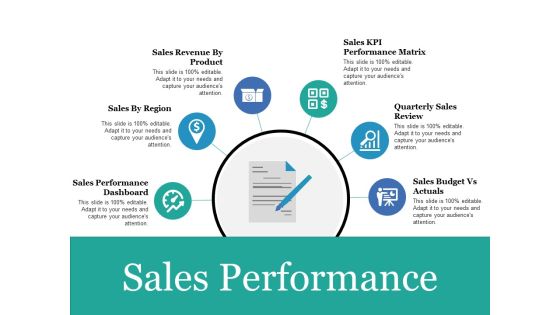
Sales Performance Ppt PowerPoint Presentation Portfolio Show
This is a sales performance ppt powerpoint presentation portfolio show. This is a six stage process. The stages in this process are sales performance dashboard, sales by region, sales revenue by product, quarterly sales review, sales budget vs actuals.
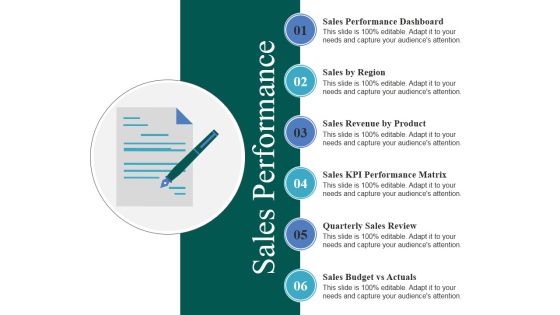
Sales Performance Ppt PowerPoint Presentation Infographics Visuals
This is a sales performance ppt powerpoint presentation infographics visuals. This is a six stage process. The stages in this process are sales by region, sales revenue by product, sales kpi performance matrix, quarterly sales review, sales budget vs actuals.

Business Object Crystal Report Ppt Powerpoint Show
This is a business object crystal report ppt powerpoint show. This is a three stage process. The stages in this process are actual vs budget, monthly sales, monthly sales forecasting, country, total sales, percent of total, usa, germany, england, switzerland, italy, others.

Organization Key Metrics Summary By Human Resource Team Information PDF
This slide represents the dashboard showing the organizations financial health report prepared by the human resource department of the organization. It includes information related to sales, gross, operating and net profit, income statement, actual vs target sales, net operating cash etc. of the organization.Showcasing this set of slides titled Organization Key Metrics Summary By Human Resource Team Information PDF. The topics addressed in these templates are Organization Key Metrics Summary, Human Resource Team. All the content presented in this PPT design is completely editable. Download it and make adjustments in color, background, font etc. as per your unique business setting.
IT Cost Reduction Strategies Determine IT Project Portfolio Management Tracking Designs PDF
This slide provides information regarding IT project portfolio management tracking dashboard including details about allocated budget across portfolios, used budget percentage, estimated vs. actual cost, etc. From laying roadmaps to briefing everything in detail, our templates are perfect for you. You can set the stage with your presentation slides. All you have to do is download these easy-to-edit and customizable templates. IT Cost Reduction Strategies Determine IT Project Portfolio Management Tracking Designs PDF will help you deliver an outstanding performance that everyone would remember and praise you for. Do download this presentation today.

Cios Guide To Optimize Determine IT Project Portfolio Management Tracking Formats PDF
This slide provides information regarding IT project portfolio management tracking dashboard including details about allocated budget across portfolios, used budget percentage, estimated vs. actual cost, etc. If your project calls for a presentation, then Slidegeeks is your go-to partner because we have professionally designed, easy-to-edit templates that are perfect for any presentation. After downloading, you can easily edit Cios Guide To Optimize Determine IT Project Portfolio Management Tracking Formats PDF and make the changes accordingly. You can rearrange slides or fill them with different images. Check out all the handy templates.
