Budget Templates

Sprint Planner For Event Management And Planning Ppt Infographic Template Design Templates PDF
This slide shows sprint calendar for two weeks to assure proper and efficient event management planning. It includes activities such as team selection, create time box, set daily tasks, event refinement meeting, resource allocation and retrospective sessions. Presenting Sprint Planner For Event Management And Planning Ppt Infographic Template Design Templates PDF to dispense important information. This template comprises two stages. It also presents valuable insights into the topics including Daily Scrum, Resource Allocation, Develop Time Box. This is a completely customizable PowerPoint theme that can be put to use immediately. So, download it and address the topic impactfully.

Profile Overview Of Financial Services Offering Business Ppt PowerPoint Presentation Infographic Template Templates PDF
This slide can be used by a financial consultancy company to show their profile overview. It includes details such as history, head office, employees headcount, customers and services offered.Presenting Profile Overview Of Financial Services Offering Business Ppt PowerPoint Presentation Infographic Template Templates PDF to dispense important information. This template comprises one stage. It also presents valuable insights into the topics including Tax Consultancy, Portfolio Management, Credit Financing. This is a completely customizable PowerPoint theme that can be put to use immediately. So, download it and address the topic impactfully.
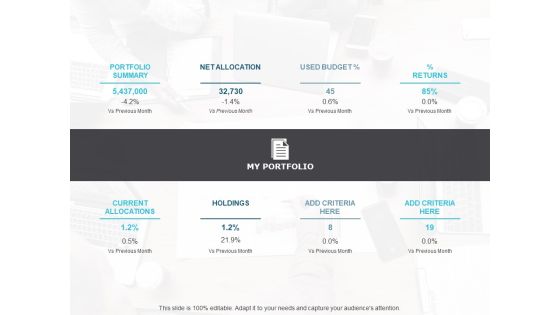
Portfolio Management Investment Allocation Kpis Ppt PowerPoint Presentation Infographic Template Templates
This is a portfolio management investment allocation kpis ppt powerpoint presentation infographic template templates. The topics discussed in this diagram are business, marketing, management. This is a completely editable PowerPoint presentation, and is available for immediate download.

Business And Financial Analysis Required Investment Ppt PowerPoint Presentation Infographic Template Templates
This is a business and financial analysis required investment ppt powerpoint presentation infographic template templates. This is a three stage process. The stages in this process are consulting, marketing, other.

Commodity Breakdown Structure For Construction Organization Ppt Infographic Template Design Templates PDF
This slide showcases product breakdown structure that can help organization to identify the list of resources crucial for smooth functioning of construction project. Its key components are land, machinery, material and design. Persuade your audience using this Commodity Breakdown Structure For Construction Organization Ppt Infographic Template Design Templates PDF. This PPT design covers five stages, thus making it a great tool to use. It also caters to a variety of topics including Construction, Trucks, Machinery, Material. Download this PPT design now to present a convincing pitch that not only emphasizes the topic but also showcases your presentation skills.

Strategic Planning Analysis Recruitment And Selection Ppt Powerpoint Presentation Infographic Template Templates
This is a strategic planning analysis recruitment and selection ppt powerpoint presentation infographic template templates. This is a four stage process. The stages in this process are human resources management, hr swot, human resources swot analysis.

Immovable Property CRM CRM Real Estate Return On Investment Ppt PowerPoint Presentation Infographic Template Design Templates
Presenting this set of slides with name immovable property crm crm real estate return on investment ppt powerpoint presentation infographic template design templates. This is a three stage process. The stages in this process are boost sales, minimize expenses, enhance marketing campaigns. This is a completely editable PowerPoint presentation and is available for immediate download. Download now and impress your audience.
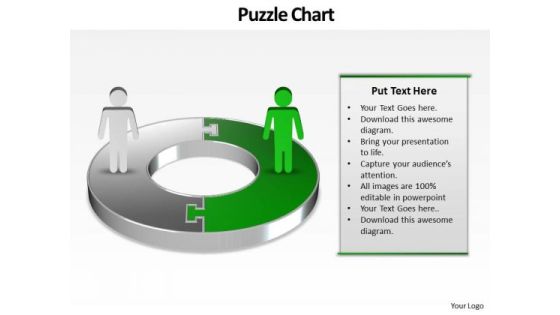
Ppt Green PowerPoint Slide Man On Circular Gantt Chart Template Templates
PPT green powerpoint slide man on circular gantt chart template Templates-This PowerPoint Diagram shows you the Circular way to represent Business components or losses in Business related Activities. This PowerPoint Diagram can be use in Investor presentations for Initial Public Offerings, Annual general meetings and financial seminars.-PPT green powerpoint slide man on circular gantt chart template Templates-abstract, accounting, background, business, businessman, chart, company, connection, corporate, diagram, earnings, finance, forecast, graph, growth, investment, management, network, people, profit, progress, puzzle, shapes, team, technology, vector, wealth

Joint Venture Business Model Structure Ppt Infographic Template Design Templates PDF
This slide represents joint venture standardized business structure model used by entrepreneurs . It includes partners, investors, buyers, global projects etc. Are you in need of a template that can accommodate all of your creative concepts This one is crafted professionally and can be altered to fit any style. Use it with Google Slides or PowerPoint. Include striking photographs, symbols, depictions, and other visuals. Fill, move around, or remove text boxes as desired. Test out color palettes and font mixtures. Edit and save your work, or work with colleagues. Download Joint Venture Business Model Structure Ppt Infographic Template Design Templates PDF and observe how to make your presentation outstanding. Give an impeccable presentation to your group and make your presentation unforgettable.

Project Manager Project Team Template 1 Ppt PowerPoint Presentation Infographics Templates
This is a project manager project team template 1 ppt powerpoint presentation infographics templates. This is a three stage process. The stages in this process are functional manager, project manager, business, marketing.
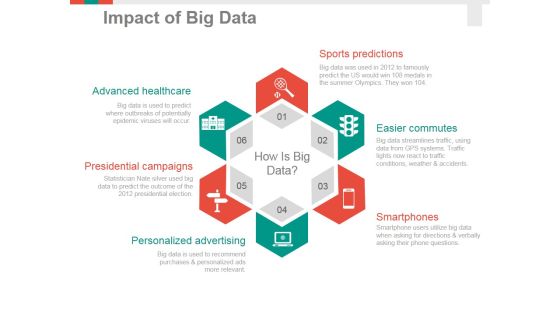
Impact Of Big Data Template 1 Ppt PowerPoint Presentation Outline Templates
This is a impact of big data template 1 ppt powerpoint presentation outline templates. This is a six stage process. The stages in this process are sports predictions, easier commutes, smartphones, personalized advertising, presidential campaigns, advanced healthcare.

Cost Management In Capacity Planning Ppt PowerPoint Presentation Infographic Template Templates
Presenting this set of slides with name cost management in capacity planning ppt powerpoint presentation infographic template templates. The topics discussed in these slides are type of cost, planning costs, actual costs, deviations causes. This is a completely editable PowerPoint presentation and is available for immediate download. Download now and impress your audience.
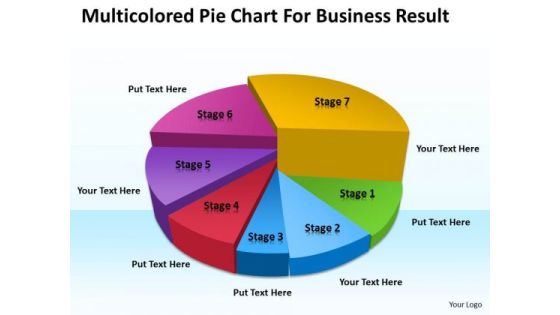
Strategy PowerPoint Template Multicolored Pie Chart For Business Result Ppt Templates
Highlight your drive with our strategy powerpoint template multicolored pie chart for business result ppt templates. Prove the fact that you have control. Go the distance with our Marketing PowerPoint Templates. Maintain the pace till the end. Draw on the energy of our Finance PowerPoint Templates. Your thoughts will perk up.

Business PowerPoint Template 3 Cs For Zigzag Path Diagram Ppt Templates
Analyse ailments on our Business powerpoint template 3 cs for zigzag path diagram ppt templates. Bring out the thinking doctor in you. Dock your thoughts with our Finance PowerPoint Templates. They will launch them into orbit. Get out of the dock with our Success PowerPoint Templates. Your mind will be set free.
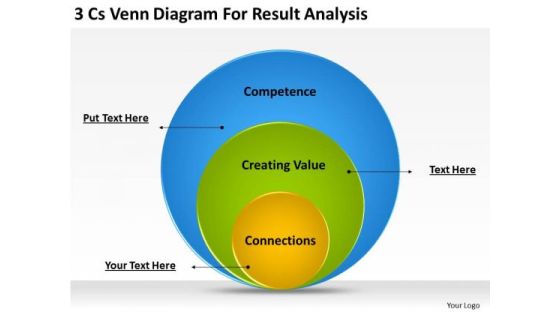
Business PowerPoint Template 3 Cs Venn Diagram For Result Analysis Ppt Templates
Document the process on our Business powerpoint template 3 cs venn diagram for result analysis ppt templates. Make a record of every detail. Satiate desires with our Finance PowerPoint Templates. Give them all they want and more. Be the doer with our Venn Diagrams PowerPoint Templates. Put your thoughts into practice.
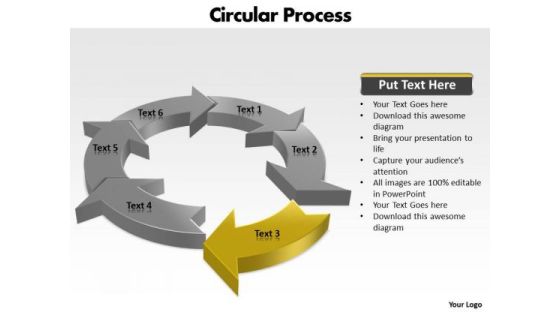
Ppt Components Of Circular Process Cause And Effect Diagram PowerPoint Template Templates
PPT components of circular process cause and effect diagram powerpoint template Templates-This circular flow diagram illustrates the economic exchange that takes place in the building of wealth. Adjust the above image in your PPT presentations to visually support your content in your Business PPT slideshows-PPT components of circular process cause and effect diagram powerpoint template Templates-Arrow, Chart, Circular, Color, Colorful, Connect, Connection, Design, Diagram, Finance, Graphic, Group, Growth, Icon, Illustration, Marketing, Pieces, Process, Recycle, Recycling, Round, Set, Strategy, Symbol, Wheel

Insurance Approval Procedure Document Verification Ppt Powerpoint Presentation Infographic Template Templates
This is a insurance approval procedure document verification ppt powerpoint presentation infographic template templates. This is a three stage process. The stages in this process are insurance claim process, insurance claim steps, insurance claim procedure.

Understanding The Market Landscape Ppt PowerPoint Presentation Infographic Template Design Templates
This is a understanding the market landscape ppt powerpoint presentation infographic template design templates. This is a five stage process. The stages in this process are partners activities resources, value proposition, customer, relationship.
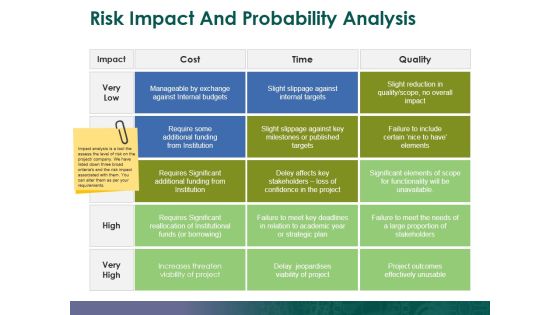
Risk Impact And Probability Analysis Template 1 Ppt PowerPoint Presentation Infographics Templates
This is a risk impact and probability analysis template 1 ppt powerpoint presentation infographics templates. This is a three stage process. The stages in this process are low, medium, high, cost, time, quality.

Ppt Red Quadrant On Circular Free Pie PowerPoint Template Chart Ks2 Templates
PPT red quadrant on circular free pie powerpoint template chart ks2 Templates-Use this layout to define the outcome and the multiple possibilities in a way that is used in calculation of probabilities, genetics and strategic reasoning. This chart visualize the of process steps, reoccurrences and components or of your company structure or product features.-PPT red quadrant on circular free pie powerpoint template chart ks2 Templates-3 arrow, art, background, business, chart, circle, clip, colorful, design, diagram, flow, fourth, graph, graphic, half, icon, illustration, management, point, process, progress, project, round, segment, set, slide, stage, successful business, third, transparent

Organic Vs Paid Search Traffic Template 2 Ppt PowerPoint Presentation Outline Templates
This is a organic vs paid search traffic template 2 ppt powerpoint presentation outline templates. This is a three stage process. The stages in this process are avg session duration, pages session, bounce rate.

Root Cause Analysis Template 2 Ppt PowerPoint Presentation Outline Design Templates
This is a root cause analysis template 2 ppt powerpoint presentation outline design templates. This is a five stage process. The stages in this process are what, how, who, when, status.
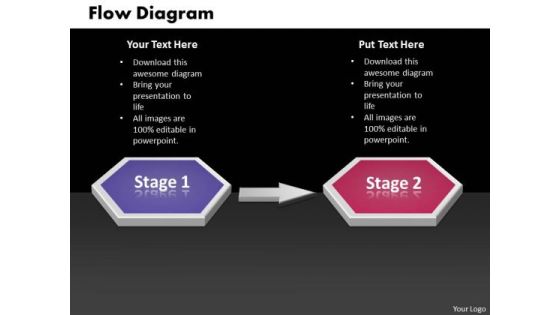
Ppt 3d Linear Work Flow Swim Lane Diagram PowerPoint Template Templates
PPT 3d linear work flow swim lane diagram powerpoint template Templates-This 3D Business PowerPoint Diagram Displays the circular arrows connected to each other signifying the continuous flow of steps to be executed. This Diagram can be used to represent Process charts, Business chart, Sales process chart and Finance process etc.-PPT 3d linear work flow swim lane diagram powerpoint template Templates-Abstract, Action, Attention, Business, Chart, Clipart, Commerce, Concept, Conceptual, Corporate, Customer, Design, Desire, Diagram, Flow, Goals, Guide, Icon, Idea, Illustration, Interest, Manage, Management, Map, Marketing, Mind, Mission, Model, Organization, Performance, Planning, Plans, Process
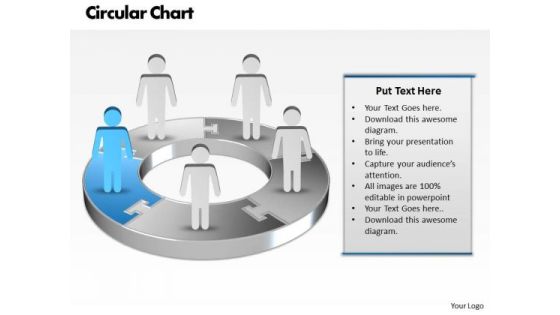
Ppt Blue Men Standing On Business Pie Organization Chart PowerPoint Template Templates
PPT blue men standing on business pie organization chart powerpoint template Templates-Use this Business based PowerPoint Diagram to represent the Business issues Graphically. It indicates arrange, block out, blueprint, cast, delineate, design, devise, draft, graph , lay out, outline, plot, project, shape, sketch etc.-PPT blue men standing on business pie organization chart powerpoint template Templates-arrow, art, basic, blank, business, capital, chart, chevron, clip, clipart, colorful, conglomerates, consumer, copy, cyclical, energy, financial, flow, goods, graph, graphic, healthcare, illustration, infographic, information, investment, isolated, market, materials, non, round, sectors, services, slide, space, stock, technology, text,
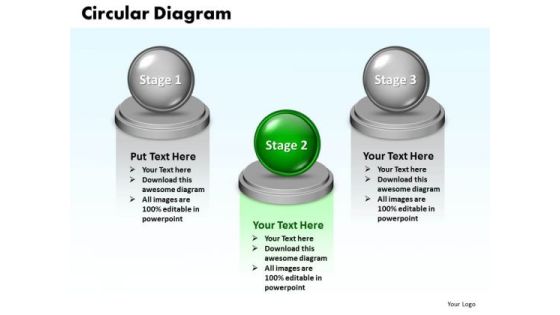
Ppt Analogous Swim Lane Diagram PowerPoint Template Representing 3 Stages Templates
PPT analogous swim lane diagram powerpoint template representing 3 stages Templates-This PowerPoint diagram provides better understanding of three state functions. Emphasizes on improve the standards for more effective results.-PPT analogous swim lane diagram powerpoint template representing 3 stages Templates-3d, Abstract, Backgrounds, Ball, Business, Choice, Comparison, Concept, Descriptive, Equilibrium, Grow, Illustrations, Instrument, Measurement, Metallic, Part, Partnership, Pattern, Progress, Reflections, Scales, Several, Sphere, Strategy, Success

Ppt Concepts Of Circular PowerPoint Menu Template Procedure 7 State Diagram Templates
PPT concepts of circular powerpoint menu template procedure 7 state diagram Templates-Create stunning Microsoft office PPT Presentations with our professional template. Use this graphics to develop detailed sequence diagrams as the core process in systems design-PPT concepts of circular powerpoint menu template procedure 7 state diagram Templates-Arrow, Chart, Circular Procedure, Color, Colorful, Connect, Connection, Design, Diagram, Finance, Graphic, Group, Growth, Icon, Illustration, Marketing, Pieces, Process, Recycle, Recycling, Round, Set, Strategy, Symbol, Wheel
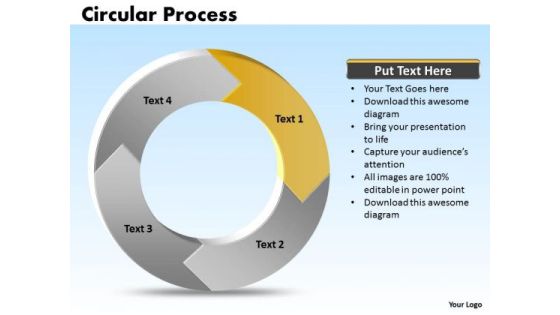
Ppt Cycle Process Cause And Effect Diagram PowerPoint Template 4 Stages Templates
PPT cycle process cause and effect diagram powerpoint template 4 stages Templates-Visually support your Microsoft office PPT Presentation with our above template. This diagram shows the flow of control between activities. You can model the sequential steps in a process with this diagram-PPT cycle process cause and effect diagram powerpoint template 4 stages Templates-Arrow, Chart, Circular Procedure, Color, Colorful, Connect, Connection, Design, Diagram, Finance, Graphic, Group, Growth, Icon, Illustration, Marketing, Pieces, Process, Recycle, Recycling, Round, Set, Strategy, Symbol, Wheel
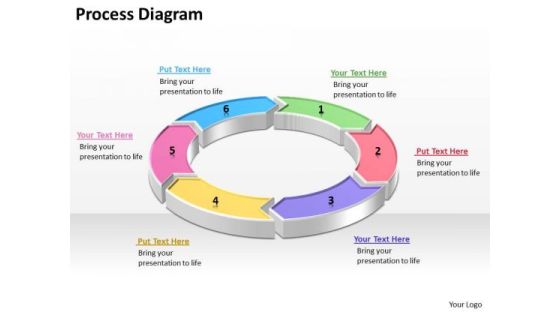
Ppt Business Process Cyclic Diagram PowerPoint Template With 6 Steps Editable Templates
PPT Business Process Cyclic Diagram PowerPoint template with 6 steps editable Templates- Visually support your Microsoft office PPT Presentation with our above template illustrating a six steps Cyclic diagram. This image clearly defines the concept Project Life cycle. This attractive image makes your presentations simpler showing that you care about even the smallest details. Create captivating presentations to deliver your message across.-PPT Business Process Cyclic Diagram PowerPoint template with 6 steps editable Templates-6, Around, Arrows, Border, Center, Circle, Circular, Concept, Connect, Connections, Curve, Cycle, Distribution, Five, Flow, Group, Illustration, Management, Middle, Objects, Plan, Process, Recycle, Rounded, Sections, Sectors, Shape, Symbol, Vector, Workflow

Ppt Blue Step To Success Using Circular PowerPoint Menu Template Arrow Templates
PPT blue step to success using circular powerpoint menu template arrow Templates-This PowerPoint Diagram shows you Inter-connected Circular Arrows in Horizontal Line which signifies step by step Execution, inter-related approaches etc. You can change color, size and orientation of any icon to your liking.-PPT blue step to success using circular powerpoint menu template arrow Templates-achievement, active, advice, attempt, background, business, businessman, climb, competition, concept, develop, development, education, goal, graph, growth, improve, increase, industry, investment, ladder, level, man, management, manager, people, perform, progress, start, step, success, target, upward
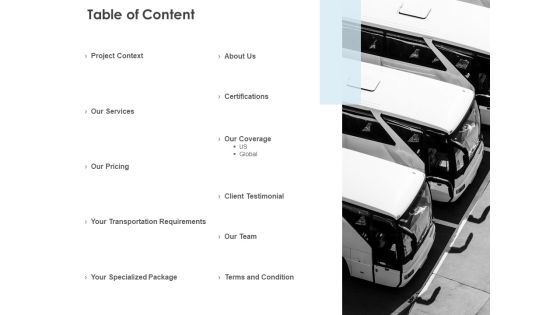
Table Of Content Transportation Requirements Ppt PowerPoint Presentation Infographic Template Templates
Presenting this set of slides with name table of content transportation requirements ppt powerpoint presentation infographic template templates. The topics discussed in these slides are our services, our pricing, about us, our team, project context. This is a completely editable PowerPoint presentation and is available for immediate download. Download now and impress your audience.

Ppt Pink Factor Hexagon Cause And Effect Diagram PowerPoint Template Editable Templates
PPT pink factor hexagon cause and effect diagram PowerPoint template editable Templates-The Diagram offers an excellent background to build up the various stages of your business process. This PowerPoint Process Chart shows the seven Different Layers which are to be followed in any business. This Business Diagram can be used in Marketing, Banking, and Management etc. -PPT pink factor hexagon cause and effect diagram PowerPoint template editable Templates-attached, backgrounds, blue, cell, color, component, connect, connection, diagram, elements, geometric, graphic, group, hexagon, honeycomb, icon, illustration, intricacy, lines, link, map, mesh, model, network, science, shape, shiny, strategy, structure, symbol, teamwork, technology
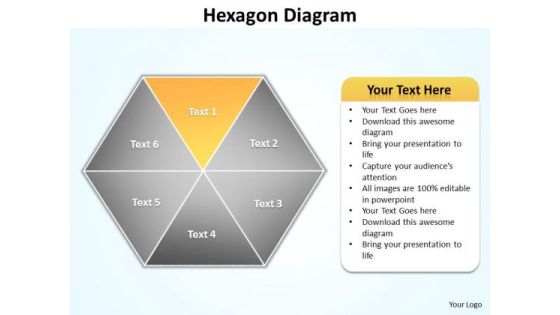
Ppt Yellow Factor Hexagon Cause And Effect Diagram PowerPoint Template Editable Templates
PPT yellow factor hexagon cause and effect diagram PowerPoint template editable Templates-Create visually stimulating Microsoft office PPT Presentations with our above Diagram. This image has been professionally designed to emphasize the concept of interrelated issues, Approaches or Methods. This Business Diagram can be used in Marketing, Banking, and Management etc. This Diagram explains the Yellow Component.-PPT yellow factor hexagon cause and effect diagram PowerPoint template editable Templates-attached, backgrounds, blue, cell, color, component, connect, connection, diagram, elements, geometric, graphic, group, hexagon, honeycomb, icon, illustration, intricacy, lines, link, map, mesh, model, network, science, shape, shiny, strategy, structure, symbol, teamwork, technology
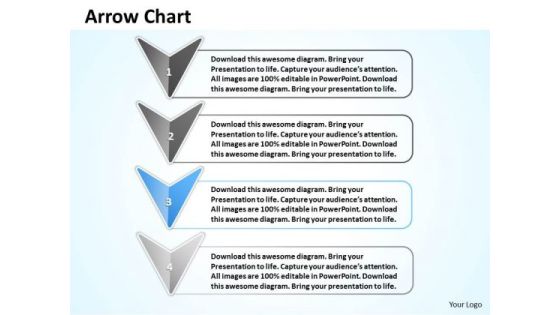
Ppt Stage 3 Continuous Flow Arrow Network Diagram PowerPoint Template Templates
PPT stage 3 continuous flow arrow network diagram powerpoint template Templates-Use This Sequentially Demonstrated PowerPoint Diagram having four steps displaying using arrow pointing towards south direction. It signifies the completion of the procedure and attaining success.-PPT stage 3 continuous flow arrow network diagram powerpoint template Templates-3d, analyze, arrow, assess, background, bullet, business, chart, checkmark, chevron, diagram, drop, eps10, financial, glass, graphic, gray, icon, illustration, improvement, management, point, process, project, reflection, set, shadow, silver, stage, text, transparency, vector

Ppt Stage 4 Continuous Flow Arrow Swim Lane Diagram PowerPoint Template Templates
PPT stage 4 continuous flow arrow swim lane diagram powerpoint template Templates-Use This Continuously Demonstrated PowerPoint Diagram having four steps displaying using arrow pointing towards south direction. It signifies the completion of the procedure and attaining success.-PPT stage 4 continuous flow arrow swim lane diagram powerpoint template Templates-3d, analyze, arrow, assess, background, bullet, business, chart, checkmark, chevron, diagram, drop, eps10, financial, glass, graphic, gray, icon, illustration, improvement, management, point, process, project, reflection, set, shadow, silver, stage, text, transparency, vector

Ppt Circular PowerPoint Menu Template Flow Process Model 4 State Diagram Templates
PPT circular powerpoint menu template flow process model 4 state diagram Templates-The above template displays a diagram of Circular steps. This image has been professionally designed to emphasize the concept of Cash flow cycle. It is a useful powerful tool conceived to enable you to define your message in your Finance PPT presentations. Deliver amazing presentations to mesmerize your audience.-PPT circular powerpoint menu template flow process model 4 state diagram Templates-Arrow, Chart, Circle, Circular, Circulation, Collection, Concept, Connection, Continuity, Cursor, Cycle, Cyclic, Diagram, Direction, Flow, Flowchart, Graph, Graphic, Group, Icon, Motion, Movement, Process, Progress, Recycle, Recycling, Refresh, Reload, Renew, Repetition, Return, Reuse, Ring, Rotation, Round, Sign, Six, Symbol
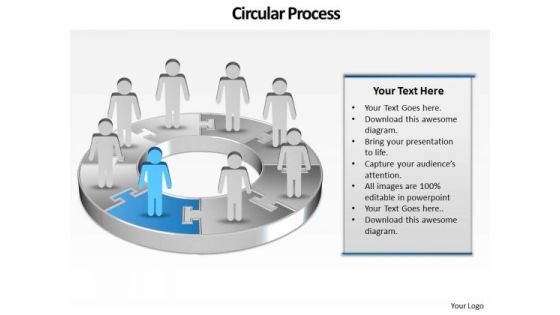
Ppt Team Work Person Standing Red Blue PowerPoint Template Piece Templates
PPT team work person standing red blue PowerPoint template piece Templates-This PowerPoint Diagram shows you the Successive Representation of Eight approaches through people standing on puzzle pieces which are combined to form circle. It shows the successive concepts used in a procedure. You can change color, size and orientation of any icon to your liking.-PPT team work person standing red blue PowerPoint template piece Templates-arrow, bar, business, businessman, candidate, cartoon, character, chart, circle, circular, client, communication, company, concept, diagram, finance, financial, flow, growth, human, illustration, increase, information, iteration, man, market, marketing, process, processing, profit, sales, statistics, stats, success, target

Ppt Pie Gantt Chart PowerPoint Template Person Standing Red Piece Templates
PPT pie Gantt chart PowerPoint template person standing red piece Templates-Develop competitive advantage with our above Diagram which contains a diagram of eight stages organized in Circular Manner. This Highlighted Pink text box shows the sixth step occurring in the process. It is a useful captivating tool enables you to define your message in your Marketing PPT presentations. You can edit text, color, shade and style as per you need.-PPT pie Gantt chart PowerPoint template person standing red piece Templates-arrow, bar, business, businessman, candidate, cartoon, character, chart, circle, circular, client, communication, company, concept, diagram, finance, financial, flow, growth, human, illustration, increase, information, iteration, man, market, marketing, process, processing, profit, sales, statistics, stats, success, target

Designing Great Client Experience Action Plan Our Goal Ppt PowerPoint Presentation Infographic Template Templates PDF
This is a three template with various stages. Focus and dispense information on three stages using this creative set, that comes with editable features. It contains large content boxes to add your information on topics like our goal. You can also showcase facts, figures, and other relevant content using this PPT layout. Grab it now.

Developing And Creating Corner Market Place Product Pricing Strategy Ppt PowerPoint Presentation Pictures Templates PDF
Presenting this set of slides with name developing and creating corner market place product pricing strategy ppt powerpoint presentation pictures templates pdf. This is a four stage process. The stages in this process are budget pricing strategy, value pricing strategy, luxury pricing strategy. This is a completely editable PowerPoint presentation and is available for immediate download. Download now and impress your audience.

Selling Home Property Real Estate Performance Parameters Ppt Infographics Templates PDF
This is a selling home property real estate performance parameters ppt infographics templates pdf template with various stages. Focus and dispense information on five stages using this creative set, that comes with editable features. It contains large content boxes to add your information on topics like cash flow, operating costs, cash available, budget variances, economic vacancy. You can also showcase facts, figures, and other relevant content using this PPT layout. Grab it now.
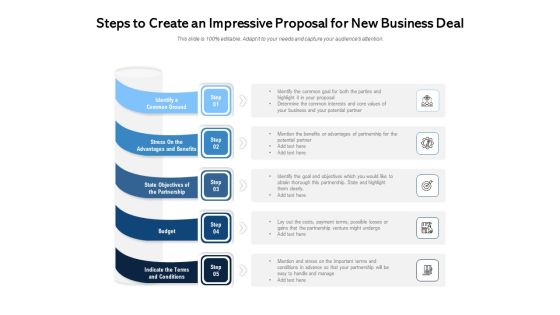
Steps To Create An Impressive Proposal For New Business Deal Ppt PowerPoint Presentation Summary Templates PDF
Presenting steps to create an impressive proposal for new business deal ppt powerpoint presentation summary templates pdf to dispense important information. This template comprises five stages. It also presents valuable insights into the topics including identify a common ground, stress on the advantages and benefits, state objectives of the partnership, budget indicate the terms and conditions. This is a completely customizable PowerPoint theme that can be put to use immediately. So, download it and address the topic impactfully.

Advertising Cost Management Process Of Business Ppt PowerPoint Presentation File Templates PDF
Presenting this set of slides with name advertising cost management process of business ppt powerpoint presentation file templates pdf. This is a four stage process. The stages in this process are determine advertisement campaign activities, keep tab on advertising expenses, set up advertising goals with respect to company goals, approve budget from management. This is a completely editable PowerPoint presentation and is available for immediate download. Download now and impress your audience.

Circular Layout For Creating Project Charter With Icons Ppt PowerPoint Presentation Outline Templates PDF
Persuade your audience using this circular layout for creating project charter with icons ppt powerpoint presentation outline templates pdf. This PPT design covers five stages, thus making it a great tool to use. It also caters to a variety of topics including budget summary, project propose or justification, assumptions and constraints, project, success, boundaries. Download this PPT design now to present a convincing pitch that not only emphasizes the topic but also showcases your presentation skills

Quantitative Data Analysis Driven Economic Status Line Chart PowerPoint Slides Templates
Be The Dramatist With Our quantitative data analysis driven economic status line chart powerpoint slides Templates . Script Out The Play Of Words.

Quantitative Data Analysis Driven Economic With Column Chart PowerPoint Slides Templates
Add Some Dramatization To Your Thoughts. Our quantitative data analysis driven economic with column chart powerpoint slides Templates Make Useful Props.
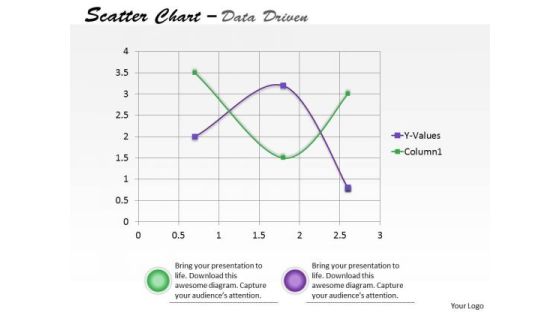
Data Analysis On Excel Driven Scatter Chart To Predict Future Movements PowerPoint Slides Templates
Our data analysis on excel driven scatter chart to predict future movements powerpoint slides Templates Enjoy Drama. They Provide Entertaining Backdrops.
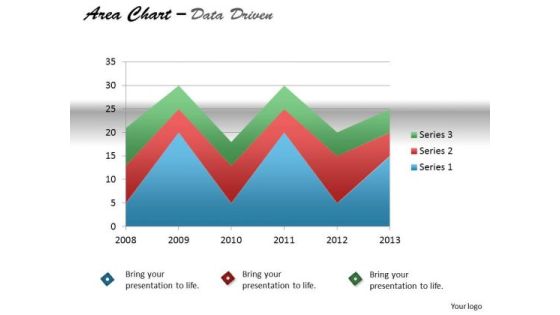
Quantitative Data Analysis Driven Display Series With Area Chart PowerPoint Slides Templates
Our quantitative data analysis driven display series with area chart powerpoint slides Templates Enjoy Drama. They Provide Entertaining Backdrops.

Data Analysis In Excel Area Chart For Business Process PowerPoint Templates
Your Grasp Of Economics Is Well Known. Help Your Audience Comprehend Issues With Our data analysis in excel area chart for business process Powerpoint Templates .

Data Analysis In Excel Column Chart For Business Project PowerPoint Templates
Edit Your Work With Our data analysis in excel column chart for business project Powerpoint Templates . They Will Help You Give The Final Form.
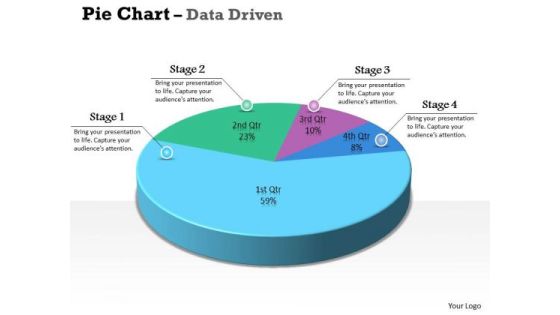
Data Analysis Excel 3d Pie Chart For Marketing Process PowerPoint Templates
Our data analysis excel 3d pie chart for marketing process Powerpoint Templates Team Are A Dogged Lot. They Keep At It Till They Get It Right.

Data Analysis Excel Driven Pie Chart For Business Stratregy PowerPoint Slides Templates
Open Up Doors That Lead To Success. Our data analysis excel driven pie chart for business stratregy powerpoint slides Templates Provide The Handles.
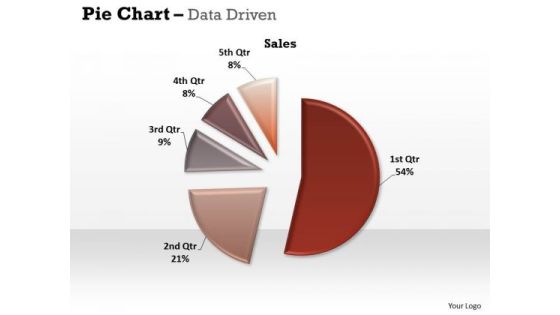
Data Analysis Excel Driven Pie Chart For Easy Comparison PowerPoint Slides Templates
Our data analysis excel driven pie chart for easy comparison powerpoint slides Templates Abhor Doodling. They Never Let The Interest Flag.
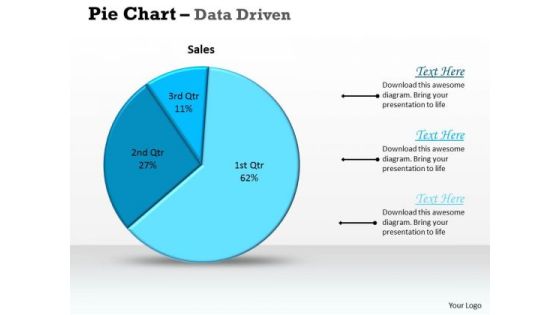
Data Analysis Excel Driven Pie Chart For Sales Process PowerPoint Slides Templates
Deliver The Right Dose With Our data analysis excel driven pie chart for sales process powerpoint slides Templates . Your Ideas Will Get The Correct Illumination.
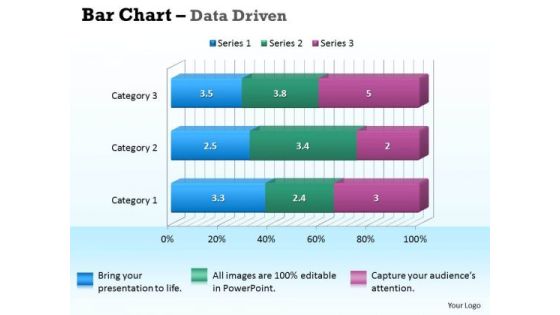
Data Analysis In Excel 3d Bar Chart For Business Information PowerPoint Templates
Our data analysis in excel 3d bar chart for business information Powerpoint Templates Deliver At Your Doorstep. Let Them In For A Wonderful Experience.
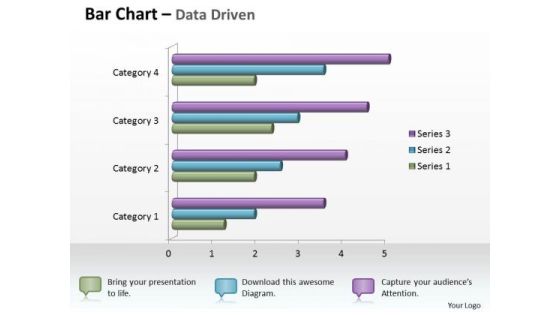
Data Analysis In Excel 3d Bar Chart For Business Statistics PowerPoint Templates
Knock On The Door To Success With Our data analysis in excel 3d bar chart for business statistics Powerpoint Templates . Be Assured Of Gaining Entry.

Data Analysis In Excel 3d Bar Chart For Business Trends PowerPoint Templates
Connect The Dots With Our data analysis in excel 3d bar chart for business trends Powerpoint Templates . Watch The Whole Picture Clearly Emerge.

Data Analysis In Excel 3d Bar Chart For Comparison Of Time Series PowerPoint Templates
Double Your Chances With Our data analysis in excel 3d bar chart for comparison of time series Powerpoint Templates . The Value Of Your Thoughts Will Increase Two-Fold.
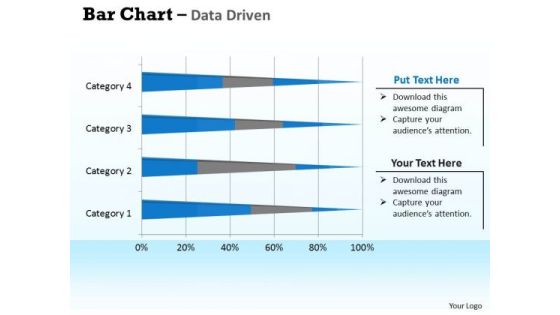
Data Analysis In Excel 3d Bar Chart For Interpretation PowerPoint Templates
Double Up Our data analysis in excel 3d bar chart for interpretation Powerpoint Templates With Your Thoughts. They Will Make An Awesome Pair.
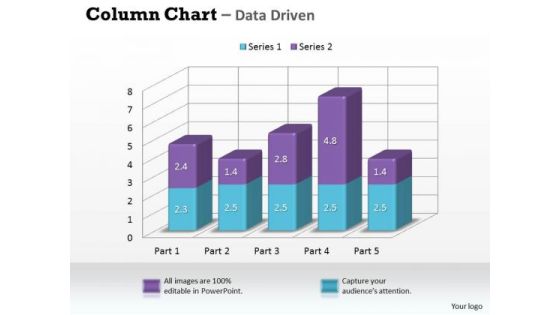
Data Analysis In Excel 3d Column Chart For Market Surveys PowerPoint Templates
Our data analysis in excel 3d column chart for market surveys Powerpoint Templates Leave No One In Doubt. Provide A Certainty To Your Views.

Data Analysis In Excel 3d Column Chart For Sets Of Information PowerPoint Templates
Double The Impact With Our data analysis in excel 3d column chart for sets of information Powerpoint Templates . Your Thoughts Will Have An Imposing Effect.
 Home
Home