AI PPT Maker
Templates
PPT Bundles
Design Services
Business PPTs
Business Plan
Management
Strategy
Introduction PPT
Roadmap
Self Introduction
Timelines
Process
Marketing
Agenda
Technology
Medical
Startup Business Plan
Cyber Security
Dashboards
SWOT
Proposals
Education
Pitch Deck
Digital Marketing
KPIs
Project Management
Product Management
Artificial Intelligence
Target Market
Communication
Supply Chain
Google Slides
Research Services
 One Pagers
All Categories
-
Home
- Customer Favorites
- Budget Summary
Budget Summary
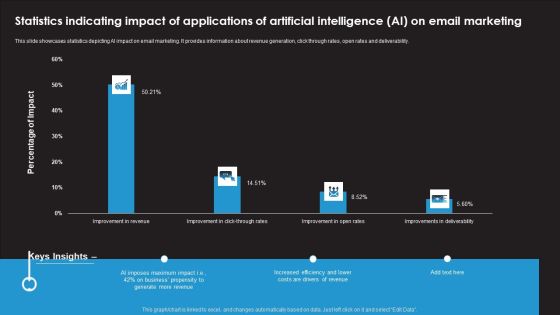
Statistics Indicating Impact Of Applications Of Artificial Intelligence AI On Email Marketing Inspiration PDF
This slide showcases statistics depicting AI impact on email marketing. It provides information about revenue generation, click through rates, open rates and deliverability. Showcasing this set of slides titled Statistics Indicating Impact Of Applications Of Artificial Intelligence AI On Email Marketing Inspiration PDF. The topics addressed in these templates are AI Imposes Maximum Impact, Business Propensity, Increased Efficiency. All the content presented in this PPT design is completely editable. Download it and make adjustments in color, background, font etc. as per your unique business setting.
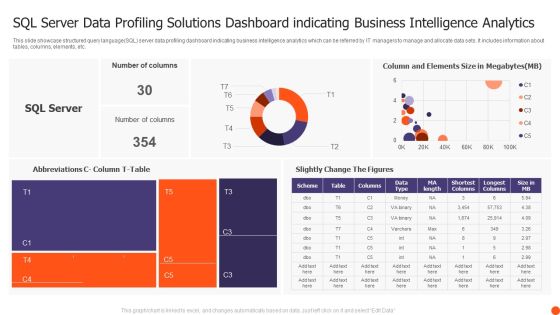
SQL Server Data Profiling Solutions Dashboard Indicating Business Intelligence Analytics Structure PDF
This slide showcase structured query language SQL server data profiling dashboard indicating business intelligence analytics which can be referred by IT managers to manage and allocate data sets. It includes information about tables, columns, elements, etc. Showcasing this set of slides titled SQL Server Data Profiling Solutions Dashboard Indicating Business Intelligence Analytics Structure PDF. The topics addressed in these templates are Number Columns, Slightly Change Figures, SQL Server. All the content presented in this PPT design is completely editable. Download it and make adjustments in color, background, font etc. as per your unique business setting.

Automated Testing Framework Dashboard Indicating Reported Issues And Results Ideas PDF
This slide showcase test automation framework dashboard indicating reported issues and results which can benefit IT firms in quick resolution of these problems. It contains information about weekly total, test results and details. It also includes information about passed, known issue, avoided, ended, queued, etc. Showcasing this set of slides titled Automated Testing Framework Dashboard Indicating Reported Issues And Results Ideas PDF. The topics addressed in these templates are Weekly Total, Test Results, Last 7 Days. All the content presented in this PPT design is completely editable. Download it and make adjustments in color, background, font etc. as per your unique business setting.

Content Format Statistics For Influencer Marketing Strategy Paln Mockup PDF
This slide plans key statistics of that can help organization to select the format of content for influencer marketing strategy. Its key components are content format and percentage of marketers.Showcasing this set of slides titled Content Format Statistics For Influencer Marketing Strategy Paln Mockup PDF. The topics addressed in these templates are Marketers Prefer, Instagram Post, Easy Produce. All the content presented in this PPT design is completely editable. Download it and make adjustments in color, background, font etc. as per your unique business setting.
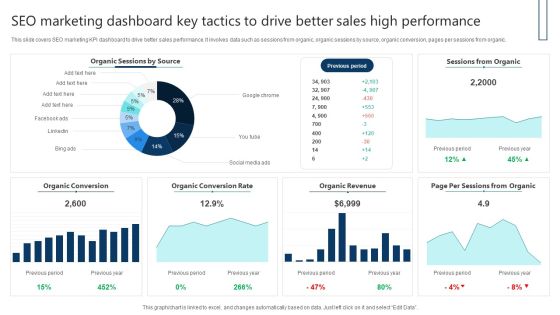
SEO Marketing Dashboard Key Tactics To Drive Better Sales High Performance Themes PDF
This slide covers SEO marketing KPI dashboard to drive better sales performance. It involves data such as sessions from organic, organic sessions by source, organic conversion, pages per sessions from organic. Showcasing this set of slides titled SEO Marketing Dashboard Key Tactics To Drive Better Sales High Performance Themes PDF. The topics addressed in these templates are Sessions From Organic, Organic Revenue, Organic Conversion Rate. All the content presented in this PPT design is completely editable. Download it and make adjustments in color, background, font etc. as per your unique business setting.
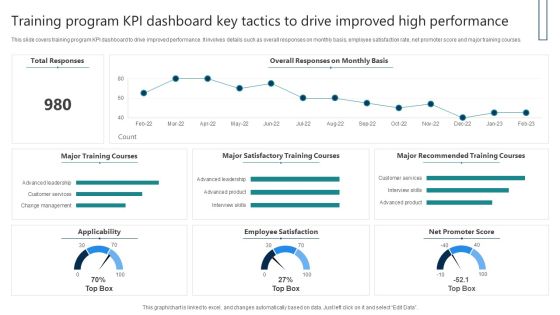
Training Program KPI Dashboard Key Tactics To Drive Improved High Performance Download PDF
This slide covers training program KPI dashboard to drive improved performance. It involves details such as overall responses on monthly basis, employee satisfaction rate, net promoter score and major training courses. Showcasing this set of slides titled Training Program KPI Dashboard Key Tactics To Drive Improved High Performance Download PDF. The topics addressed in these templates are Total Responses, Major Training Courses, Employee Satisfaction. All the content presented in this PPT design is completely editable. Download it and make adjustments in color, background, font etc. as per your unique business setting.

Clustered Column Dual Branding Campaign For Product Promotion And Recognition Inspiration PDF
Get a simple yet stunning designed Clustered Column Dual Branding Campaign For Product Promotion And Recognition Inspiration PDF. It is the best one to establish the tone in your meetings. It is an excellent way to make your presentations highly effective. So, download this PPT today from Slidegeeks and see the positive impacts. Our easy-to-edit Clustered Column Dual Branding Campaign For Product Promotion And Recognition Inspiration PDF can be your go-to option for all upcoming conferences and meetings. So, what are you waiting for Grab this template today.

Effectiveness Of Online Media Channels Digital Marketing Strategy Deployment Graphics PDF
This slide focuses on the effectiveness of online media channels which covers email marketing, social PPC, content marketing, direct mail, etc.Get a simple yet stunning designed Effectiveness Of Online Media Channels Digital Marketing Strategy Deployment Graphics PDF. It is the best one to establish the tone in your meetings. It is an excellent way to make your presentations highly effective. So, download this PPT today from Slidegeeks and see the positive impacts. Our easy-to-edit Effectiveness Of Online Media Channels Digital Marketing Strategy Deployment Graphics PDF can be your go-to option for all upcoming conferences and meetings. So, what are you waiting for Grab this template today.
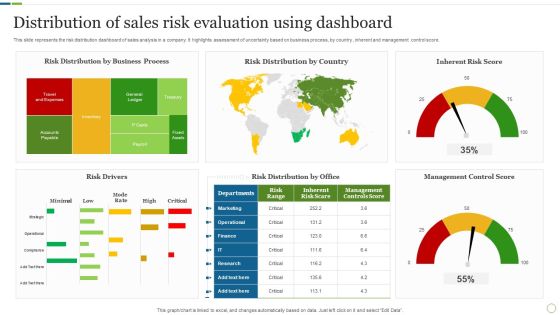
Distribution Of Sales Risk Evaluation Using Dashboard Brochure PDF
This slide represents the risk distribution dashboard of sales analysis in a company. It highlights assessment of uncertainty based on business process, by country , inherent and management control score. Showcasing this set of slides titled Distribution Of Sales Risk Evaluation Using Dashboard Brochure PDF. The topics addressed in these templates are Risk Drivers, Management Control Score, Inherent Risk Score. All the content presented in this PPT design is completely editable. Download it and make adjustments in color, background, font etc. as per your unique business setting.
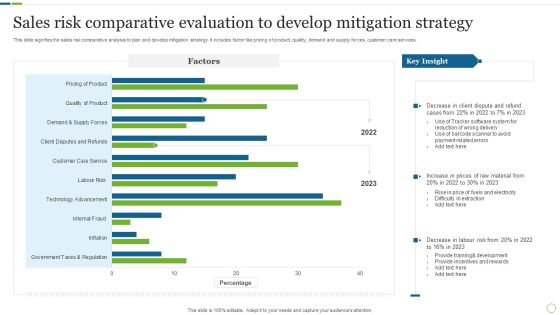
Sales Risk Comparative Evaluation To Develop Mitigation Strategy Rules PDF
This slide signifies the sales risk comparative analysis to plan and develop mitigation strategy. It includes factor like pricing of product, quality, demand and supply forces, customer care services. Showcasing this set of slides titled Sales Risk Comparative Evaluation To Develop Mitigation Strategy Rules PDF. The topics addressed in these templates are Raw Material, Labour Risk, Development. All the content presented in this PPT design is completely editable. Download it and make adjustments in color, background, font etc. as per your unique business setting.

Customer Needs Survey Analysis Dashboard Of Company Inspiration PDF
This slide shows the insights of the survey conducted by an organization to identify the needs of their customers through the help of a dashboard. It shows no. of respondents, types of browser, location, operating system etc. Showcasing this set of slides titled Customer Needs Survey Analysis Dashboard Of Company Inspiration PDF. The topics addressed in these templates are Operating System, Location, Device. All the content presented in this PPT design is completely editable. Download it and make adjustments in color, background, font etc. as per your unique business setting.
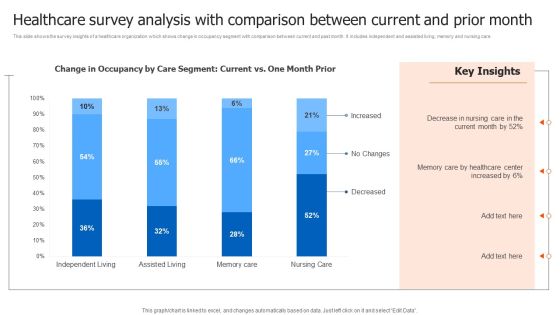
Healthcare Survey Analysis With Comparison Between Current And Prior Month Infographics PDF
This slide shows the survey insights of a healthcare organization which shows change in occupancy segment with comparison between current and past month. It includes independent and assisted living, memory and nursing care. Showcasing this set of slides titled Healthcare Survey Analysis With Comparison Between Current And Prior Month Infographics PDF. The topics addressed in these templates are Healthcare Survey Analysis, Comparison Between Current. All the content presented in this PPT design is completely editable. Download it and make adjustments in color, background, font etc. as per your unique business setting.

Candidate Job Search Web Based Platform Dashboard With Vacancy Status Infographics PDF
This slide candidate job search portal dashboard with vacancy status. It provides information about interviews schedule, application sent, profile viewed, unread message, vacancy stats, etc. Showcasing this set of slides titled Candidate Job Search Web Based Platform Dashboard With Vacancy Status Infographics PDF. The topics addressed in these templates are Candidate Job Search Web Based, Platform Dashboard. All the content presented in this PPT design is completely editable. Download it and make adjustments in color, background, font etc. as per your unique business setting.
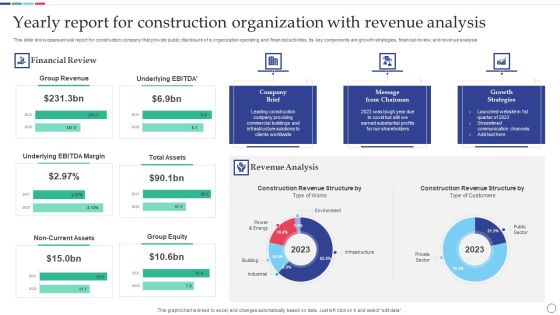
Yearly Report For Construction Organization With Revenue Analysis Topics PDF
This slide showcases annual report for construction company that provide public disclosure of a organization operating and financial activities. Its key components are growth strategies, financial review, and revenue analysis. Showcasing this set of slides titled Yearly Report For Construction Organization With Revenue Analysis Topics PDF. The topics addressed in these templates are Revenue Analysis, Growth Strategies, Customers. All the content presented in this PPT design is completely editable. Download it and make adjustments in color, background, font etc. as per your unique business setting.
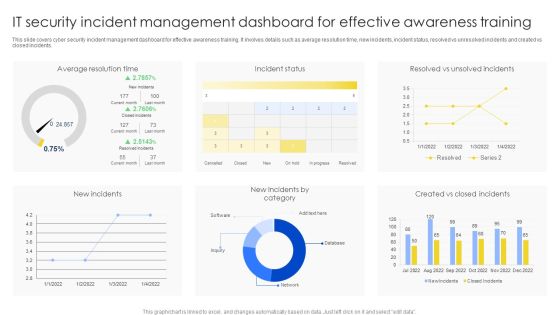
IT Security Incident Management Dashboard For Effective Awareness Training Pictures PDF
This slide covers cyber security incident management dashboard for effective awareness training. It involves details such as average resolution time, new incidents, incident status, resolved vs unresolved incidents and created vs closed incidents. Showcasing this set of slides titled IT Security Incident Management Dashboard For Effective Awareness Training Pictures PDF. The topics addressed in these templates are Average Resolution Time, Incident Status, New Incidents. All the content presented in this PPT design is completely editable. Download it and make adjustments in color, background, font etc. as per your unique business setting.

Challenges For Blockchain Technology In Supply Chain Management Demonstration PDF
This slide represents a graph showing the challenges faced by blockchain in areas of supply chain that are visibility, risk allocation, sourcing, fluctuating consumer demand, keeping pace with technology manufacturing, inventory and data management. Showcasing this set of slides titled Challenges For Blockchain Technology In Supply Chain Management Demonstration PDF. The topics addressed in these templates are Inventory Management Challenges, Supply Chain Complexity. All the content presented in this PPT design is completely editable. Download it and make adjustments in color, background, font etc. as per your unique business setting.

Soft Drinks Brand Preference Column Chart With Key Insights Clipart PDF
This slide shows survey results of soft drinks consumption by different age groups of consumers. Major brands covered are coke, Pepsi, coke zero, and Pepsi max to visualize soda consumption.Showcasing this set of slides titled Soft Drinks Brand Preference Column Chart With Key Insights Clipart PDF. The topics addressed in these templates are Survey Consumers, Personalized Advertisements, Emotional Connect. All the content presented in this PPT design is completely editable. Download it and make adjustments in color, background, font etc. as per your unique business setting.
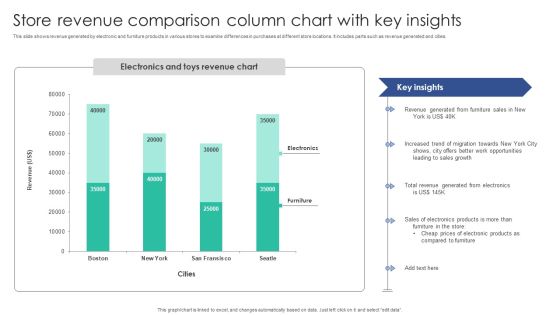
Store Revenue Comparison Column Chart With Key Insights Themes PDF
This slide shows revenue generated by electronic and furniture products in various stores to examine differences in purchases at different store locations. It includes parts such as revenue generated and cities. Showcasing this set of slides titled Store Revenue Comparison Column Chart With Key Insights Themes PDF. The topics addressed in these templates are Revenue Generated, Furniture Sales, Increased Trend. All the content presented in this PPT design is completely editable. Download it and make adjustments in color, background, font etc. as per your unique business setting.
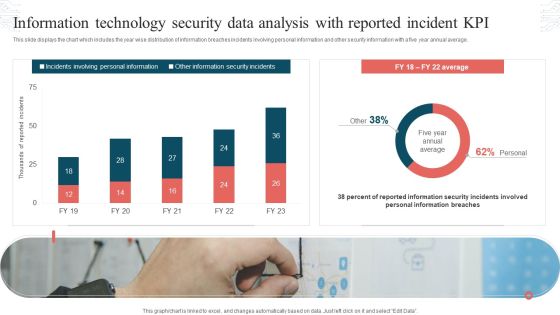
Information Technology Security Data Analysis With Reported Incident KPI Download PDF
This slide displays the chart which includes the year wise distribution of information breaches incidents involving personal information and other security information with a five year annual average. Showcasing this set of slides titled Information Technology Security Data Analysis With Reported Incident KPI Download PDF. The topics addressed in these templates are Incidents Involving, Personal Information, Other Information, Security Incidents. All the content presented in this PPT design is completely editable. Download it and make adjustments in color, background, font etc. as per your unique business setting.
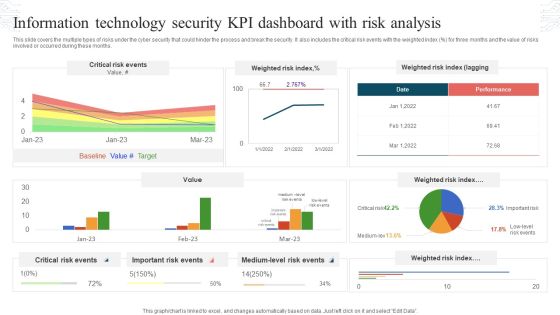
Information Technology Security KPI Dashboard With Risk Analysis Topics PDF
This slide covers the multiple types of risks under the cyber security that could hinder the process and break the security. It also includes the critical risk events with the weighted index percent for three months and the value of risks involved or occurred during these months. Showcasing this set of slides titled Information Technology Security KPI Dashboard With Risk Analysis Topics PDF. The topics addressed in these templates are Critical Risk Events, Weighted Risk Index, Important Risk Events. All the content presented in this PPT design is completely editable. Download it and make adjustments in color, background, font etc. as per your unique business setting.

Information Technology Security Team Analytics Dashboard With KPI Themes PDF
This slide elaborates about the number of incidents that have taken place in cyber security and the malware types with per incident. It also includes the number of open and resolved ticked. Showcasing this set of slides titled Information Technology Security Team Analytics Dashboard With KPI Themes PDF. The topics addressed in these templates are Open Incidents, Resolved Incidents, Open Tickets, Resolved Tickets. All the content presented in this PPT design is completely editable. Download it and make adjustments in color, background, font etc. as per your unique business setting.
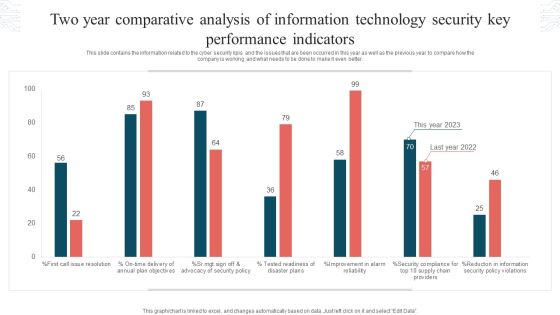
Two Year Comparative Analysis Of Information Technology Security Key Performance Indicators Graphics PDF
This slide contains the information related to the cyber security kpis and the issues that are been occurred in this year as well as the previous year to compare how the company is working and what needs to be done to make it even better. Showcasing this set of slides titled Two Year Comparative Analysis Of Information Technology Security Key Performance Indicators Graphics PDF. The topics addressed in these templates are Tested Readiness, Disaster Plans, Security Policy Violations. All the content presented in this PPT design is completely editable. Download it and make adjustments in color, background, font etc. as per your unique business setting.

Bar Graph Representing Risk Assessment Variant On Basis Of Impact Level Topics PDF
This slide shows the graphical representation of risk scenario on the basis of impact category score and degree of severity which includes impacted categories such as people, economy, environment, territorial security, business reputation, etc. Showcasing this set of slides titled Bar Graph Representing Risk Assessment Variant On Basis Of Impact Level Topics PDF. The topics addressed in these templates are Measuring Metrics, Organization, Greater Impact. All the content presented in this PPT design is completely editable. Download it and make adjustments in color, background, font etc. as per your unique business setting.

Information Technology Operations Operations Dashboard For Issues Management Infographics PDF
The slide illustrates various KPIs to manage and track IT operations in business. Various elements included in the dashboard are month-wise issue status, types of issues, average resolution time, overall status and resolved issues. Showcasing this set of slides titled Information Technology Operations Operations Dashboard For Issues Management Infographics PDF. The topics addressed in these templates are Information Technology Operations, Operations Dashboard, Issues Management. All the content presented in this PPT design is completely editable. Download it and make adjustments in color, background, font etc. as per your unique business setting.

SEO Marketing Dashboard To Measure Integrated Marketing Communication Campaign Efficiency Brochure PDF
This slide covers SEO marketing KPI dashboard to measure IMC campaign efficiency. It involves data such as sessions from organic, organic sessions by source, organic conversion, pages per sessions from organic. Showcasing this set of slides titled SEO Marketing Dashboard To Measure Integrated Marketing Communication Campaign Efficiency Brochure PDF. The topics addressed in these templates are Sessions Organic, Organic Session Source, Previous Period, Organic Revenue. All the content presented in this PPT design is completely editable. Download it and make adjustments in color, background, font etc. as per your unique business setting.

Bar Graph Depicting Liquidity Ratio Analysis For 5 Years Graphics PDF
This showcases bar graph that can help organization to compare the liquidity ratios and take mitigation actions in case of decline. It showcases comparison of cash, quick and current ratio for a period of 5 financial years. Showcasing this set of slides titled Bar Graph Depicting Liquidity Ratio Analysis For 5 Years Graphics PDF. The topics addressed in these templates are Organization To Compare, The Liquidity Ratios, Mitigation Action Decline. All the content presented in this PPT design is completely editable. Download it and make adjustments in color, background, font etc. as per your unique business setting.

Current And Quick Ratio Comparison Graph For Liquidity Assessment Structure PDF
This slide showcases current and quick ratio graph that can help to evaluate companys liquidity and and assess the company abilities to pay off debt. It also showcases comparison of ratio with previous financial year. Showcasing this set of slides titled Current And Quick Ratio Comparison Graph For Liquidity Assessment Structure PDF. The topics addressed in these templates are Short Term Debt, Delayed Payments, Cash Shortage. All the content presented in this PPT design is completely editable. Download it and make adjustments in color, background, font etc. as per your unique business setting.

Key Statistics For Effective Event Marketing Communication Plan Information PDF
This slide signifies the key statistics for effective event communication plan through use of marketing campaign. It covers information regarding to the social media, email marketing, website, video, printed media. Showcasing this set of slides titled Key Statistics For Effective Event Marketing Communication Plan Information PDF. The topics addressed in these templates are Marketing Tool, Communication Plan, Developing Event. All the content presented in this PPT design is completely editable. Download it and make adjustments in color, background, font etc. as per your unique business setting.

Revenue Weekly Performance Report Dashboard Topics PDF
This slide displays the overall revenue that has been earned by an organization during a weekly performance report with the gross margin percent , total revenue , no. Of customers , etc. Showcasing this set of slides titled Revenue Weekly Performance Report Dashboard Topics PDF. The topics addressed in these templates are Gross Margin, Total Revenue, Customers. All the content presented in this PPT design is completely editable. Download it and make adjustments in color, background, font etc. as per your unique business setting.
Individuals Marketing Engagement Mapping Through Psychological Responses Icons PDF
This slide shows the response of individuals on articles shared on web and mapped. The various emotions that had great influence are awe, anger, laughter ,amusement ,joy ,empathy ,sadness, surprised. Showcasing this set of slides titled Individuals Marketing Engagement Mapping Through Psychological Responses Icons PDF. The topics addressed in these templates are Individuals Marketing, Engagement Mapping, Through Psychological Responses. All the content presented in this PPT design is completely editable. Download it and make adjustments in color, background, font etc. as per your unique business setting.

Senseable City Development Initiatives Survey Report Inspiration PDF
This slide illustrate survey report of 50 smart cities that implement initiatives to develop quality of living. It includes elements such as public transport connectivity, smart traffic management system, e waste management bins, CCTV surveillance etc. Showcasing this set of slides titledSenseable City Development Initiatives Survey Report Inspiration PDF. The topics addressed in these templates are Public Transport Connectivity, CCTV Surveillance, Smart Traffic Management . All the content presented in this PPT design is completely editable. Download it and make adjustments in color, background, font etc. as per your unique business setting.

Average Employee Compensation And Salary Dashboard Download PDF
The following slide showcases workforce compensation management dashboard to keep a track of benefits provided to employees. The dashboard includes employee count by salary range, workforce details and count by rating. Showcasing this set of slides titled Average Employee Compensation And Salary Dashboard Download PDF. The topics addressed in these templates are Average Employee Compensation, Salary Dashboard. All the content presented in this PPT design is completely editable. Download it and make adjustments in color, background, font etc. as per your unique business setting.
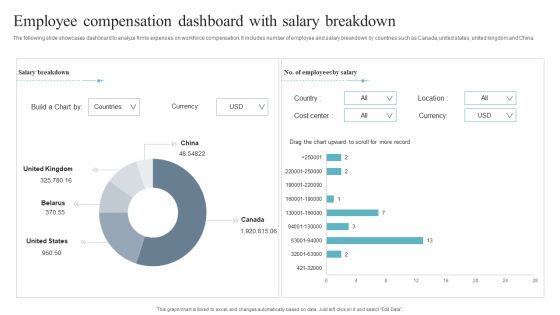
Employee Compensation Dashboard With Salary Breakdown Inspiration PDF
The following slide showcases dashboard to analyze firms expenses on workforce compensation. It includes number of employee and salary breakdown by countries such as Canada, united states, united kingdom and China. Showcasing this set of slides titled Employee Compensation Dashboard With Salary Breakdown Inspiration PDF. The topics addressed in these templates are Dashboard With Salary Breakdown, Employee Compensation. All the content presented in this PPT design is completely editable. Download it and make adjustments in color, background, font etc. as per your unique business setting.

Employee Payroll Compensation And Salary Dashboard With Expenses Professional PDF
The following slide showcases payroll and compensation dashboard to assist HR team analyze and track important KPIs. The dashboard depicts expenses , items processed and compensation comparison. Showcasing this set of slides titled Employee Payroll Compensation And Salary Dashboard With Expenses Professional PDF. The topics addressed in these templates are Employee Payroll Compensation, Salary Dashboard With Expenses. All the content presented in this PPT design is completely editable. Download it and make adjustments in color, background, font etc. as per your unique business setting.
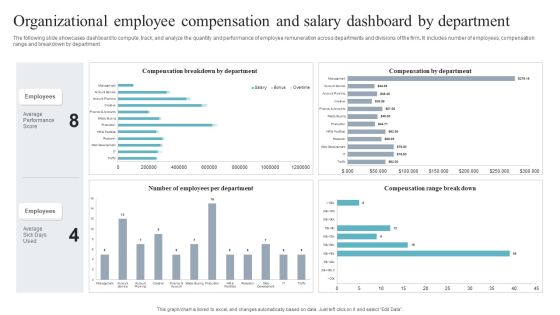
Organizational Employee Compensation And Salary Dashboard By Department Sample PDF
The following slide showcases dashboard to compute, track, and analyze the quantity and performance of employee remuneration across departments and divisions of the firm. It includes number of employees, compensation range and breakdown by department. Showcasing this set of slides titled Organizational Employee Compensation And Salary Dashboard By Department Sample PDF. The topics addressed in these templates are Organizational Employee Compensation, Salary Dashboard By Department. All the content presented in this PPT design is completely editable. Download it and make adjustments in color, background, font etc. as per your unique business setting.

Company Sales Employee Performance Measurement Dashboard Information PDF
This slide exhibits sales performance dashboard to analyze revenue and track business progress. It includes various indicators such as leads created, opportunities won, sales ratio and top revenue generating products. Showcasing this set of slides titled Company Sales Employee Performance Measurement Dashboard Information PDF. The topics addressed in these templates are Quick Ratio Target, Opportunities Won, Revenue Generating Products. All the content presented in this PPT design is completely editable. Download it and make adjustments in color, background, font etc. as per your unique business setting.

Personnel Salary Disbursement Dashboard With Trend Designs PDF
The following slide highlights the employee payroll disbursement dashboard with trend illustrating key headings which includes monthly payroll trend , total login hours, total working hours, payroll disbursement, method, trend, change in number, change in percentage, amount, change requested by and comment. Showcasing this set of slides titled Personnel Salary Disbursement Dashboard With Trend Designs PDF. The topics addressed in these templates are Personnel Salary Disbursement, Dashboard With Trend. All the content presented in this PPT design is completely editable. Download it and make adjustments in color, background, font etc. as per your unique business setting.

Food Service Delivery And Management Dashboard With Annual Sales Brochure PDF
This slide shows a food delivery company dashboard keeping track of all the orders or services delivered. Moreover, it covers KPIs such as total restaurants, registered users, weekly sales, total orders etc. Showcasing this set of slides titled Food Service Delivery And Management Dashboard With Annual Sales Brochure PDF. The topics addressed in these templates are Food Service Delivery, Management Dashboard, Annual Sales. All the content presented in this PPT design is completely editable. Download it and make adjustments in color, background, font etc. as per your unique business setting.
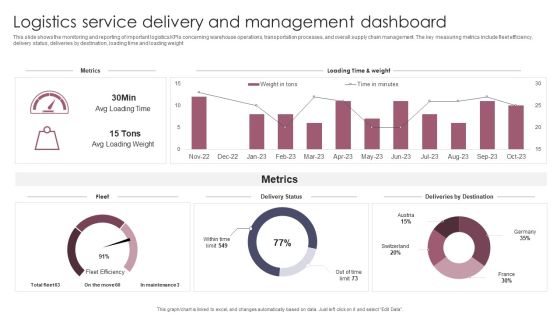
Logistics Service Delivery And Management Dashboard Introduction PDF
This slide shows the monitoring and reporting of important logistics KPIs concerning warehouse operations, transportation processes, and overall supply chain management. The key measuring metrics include fleet efficiency, delivery status, deliveries by destination, loading time and loading weight. Showcasing this set of slides titled Logistics Service Delivery And Management Dashboard Introduction PDF. The topics addressed in these templates are Logistics Service Delivery, Management Dashboard. All the content presented in this PPT design is completely editable. Download it and make adjustments in color, background, font etc. as per your unique business setting.

Supermarket Online Service Delivery And Management Dashboard Formats PDF
This slide shows the online grocery delivery dashboard of various products based on certain metrics and KPIs to achieve grocery retail revenue goals. It includes total orders, total customers total categories, and revenue. Showcasing this set of slides titled Supermarket Online Service Delivery And Management Dashboard Formats PDF. The topics addressed in these templates are Total Revenue, Total Customers, Dashboard. All the content presented in this PPT design is completely editable. Download it and make adjustments in color, background, font etc. as per your unique business setting.

Effect Of Conflict Resolution On The Organization Functioning Pictures PDF
The following slide showcases graph representing the effects of conflict management on the organization. Key effects included are reduction in turnover, absenteeism, defects and increase in productivity, sales, profitability and customer satisfaction. Showcasing this set of slides titled Effect Of Conflict Resolution On The Organization Functioning Topics PDF. The topics addressed in these templates areEffect Of Conflict Resolution On The Organization Functioning Pictures PDF. All the content presented in this PPT design is completely editable. Download it and make adjustments in color, background, font etc. as per your unique business setting.

Kpi Dashboard To Track Performance Of Management Analyst Inspiration PDF
Following slide demonstrates KPI dashboard for monitoring monthly and annual performance of business process analyst to identify best talents. It includes elements such as individual performance, monthly department performance, performance by year and team wise performance rates. Showcasing this set of slides titled Kpi Dashboard To Track Performance Of Management Analyst Inspiration PDF. The topics addressed in these templates are Annual Business Process, Analyst Team Performance, Average Team. All the content presented in this PPT design is completely editable. Download it and make adjustments in color, background, font etc. as per your unique business setting.
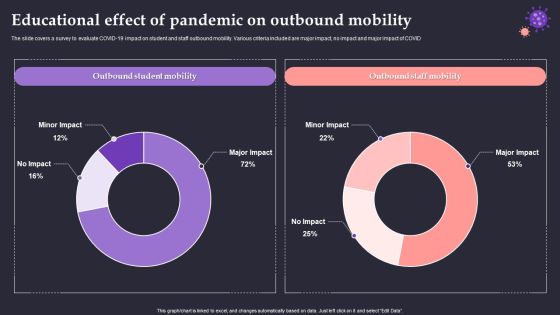
Educational Effect Of Pandemic On Outbound Mobility Elements PDF
The slide covers a survey to evaluate COVID-19 impact on student and staff outbound mobility. Various criteria included are major impact, no impact and major impact of COVID. Showcasing this set of slides titled Educational Effect Of Pandemic On Outbound Mobility Elements PDF. The topics addressed in these templates are Outbound Student Mobility, Outbound Staff Mobility, Minor Impact. All the content presented in this PPT design is completely editable. Download it and make adjustments in color, background, font etc. as per your unique business setting.
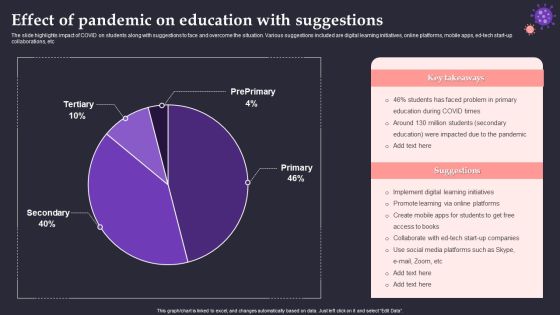
Effect Of Pandemic On Education With Suggestions Formats PDF
The slide highlights impact of COVID on students along with suggestions to face and overcome the situation. Various suggestions included are digital learning initiatives, online platforms, mobile apps, ed-tech start-up collaborations, etc. Showcasing this set of slides titled Effect Of Pandemic On Education With Suggestions Formats PDF. The topics addressed in these templates are Problem Primary, COVID Times, Digital Learning Initiatives. All the content presented in this PPT design is completely editable. Download it and make adjustments in color, background, font etc. as per your unique business setting.
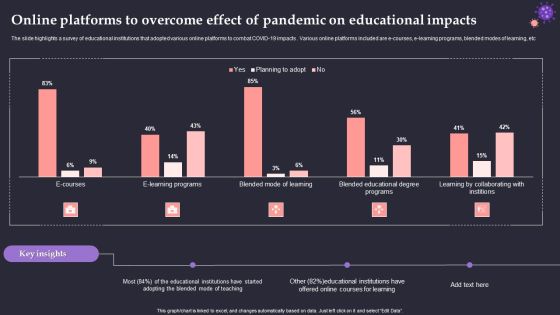
Online Platforms To Overcome Effect Of Pandemic On Educational Impacts Portrait PDF
The slide highlights a survey of educational institutions that adopted various online platforms to combat COVID-19 impacts . Various online platforms included are e-courses, e-learning programs, blended modes of learning, etc. Showcasing this set of slides titled Online Platforms To Overcome Effect Of Pandemic On Educational Impacts Portrait PDF. The topics addressed in these templates are Educational Institutions, Offered Online Courses, Mode Of Teaching. All the content presented in this PPT design is completely editable. Download it and make adjustments in color, background, font etc. as per your unique business setting.

Dashboard For Skill Assessment During Leadership Recruitment Infographics PDF
The slide shows industry wise top skills that are assessed during leadership hiring. It includes skill assessment in hiring by different industries, average time taken in hiring, skill assessment tools in leadership hiring. Showcasing this set of slides titled Dashboard For Skill Assessment During Leadership Recruitment Infographics PDF. The topics addressed in these templates are Skill Assessment Tools, Skill Analysis. All the content presented in this PPT design is completely editable. Download it and make adjustments in color, background, font etc. as per your unique business setting.
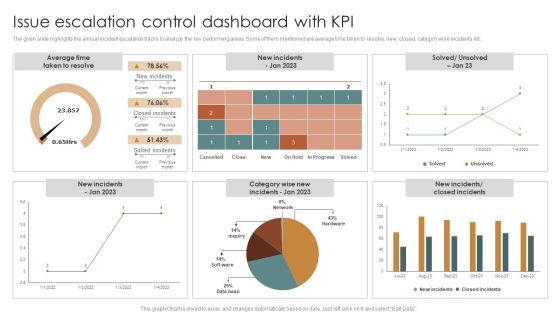
Issue Escalation Control Dashboard With KPI Clipart PDF
The given slide highlights the annual incident escalation tracks to analyze the key performing areas. Some of them mentioned are average time taken to resolve, new, closed, category wise incidents etc. Showcasing this set of slides titled Issue Escalation Control Dashboard With KPI Clipart PDF. The topics addressed in these templates are Average Time, Taken To Resolve. All the content presented in this PPT design is completely editable. Download it and make adjustments in color, background, font etc. as per your unique business setting.

Business Referral Marketing Program Performance Metrics Dashboard Introduction PDF
This slide shows KPI dashboard to effectively track performance of business referral program in order to attract more leads and potential customers to the busines. It includes details related to key metrics such as referral participation rate, referred customers, referral conversion rate and total revenue generated. Showcasing this set of slides titled Business Referral Marketing Program Performance Metrics Dashboard Introduction PDF. The topics addressed in these templates are Referral Participation Rate, Referred Customers, Referral Conversion Rate, Total Revenue Generated. All the content presented in this PPT design is completely editable. Download it and make adjustments in color, background, font etc. as per your unique business setting.

Breakdown Of Malicious Data Breach Threats Root Cause By Threat Themes PDF
This slide depicts division of data breach with root cause. It includes risk categories such as compromised credentials, cloud misconfiguration, third party software vulnerability, phishing, security compromise, social engineering, business email compromise, etc. Showcasing this set of slides titled Breakdown Of Malicious Data Breach Threats Root Cause By Threat Themes PDF. The topics addressed in these templates are Compromise On Business, Cloud Configurations, Weak Passwords. All the content presented in this PPT design is completely editable. Download it and make adjustments in color, background, font etc. as per your unique business setting.

Vendor Contracts And Compliance Management Dashboard Effective Vendor Management For Enhancing Download PDF
The following slide represents vendor contracts and compliance management dashboard. It provides information about open risks, contracts, contract renewals, categories, contract concentration, etc. Get a simple yet stunning designed Vendor Contracts And Compliance Management Dashboard Effective Vendor Management For Enhancing Download PDF. It is the best one to establish the tone in your meetings. It is an excellent way to make your presentations highly effective. So, download this PPT today from Slidegeeks and see the positive impacts. Our easy-to-edit Vendor Contracts And Compliance Management Dashboard Effective Vendor Management For Enhancing Download PDF can be your go-to option for all upcoming conferences and meetings. So, what are you waiting for Grab this template today.

Business Customer Incident Management Dashboard Background PDF
The following slide showcases customer management dashboard to retain and attract customers. It includes problems resolved and logged. It also includes CSAT, net promoter score, FCR, CRR and churn rate. Showcasing this set of slides titled Business Customer Incident Management Dashboard Background PDF. The topics addressed in these templates are Customer Satisfaction Rate, Net Promoter Score, First Contact Resolution. All the content presented in this PPT design is completely editable. Download it and make adjustments in color, background, font etc. as per your unique business setting.

Customer Support Incident Management Monitoring Dashboard Topics PDF
The following slide showcases dashboard that provides an insight of number of customer problem and issues resolved. It includes open problems , closed, count and satisfaction rate, incident by channel and priority. Showcasing this set of slides titled Customer Support Incident Management Monitoring Dashboard Topics PDF. The topics addressed in these templates are Problem By Priority, Problem Count, Problem By Channel. All the content presented in this PPT design is completely editable. Download it and make adjustments in color, background, font etc. as per your unique business setting.
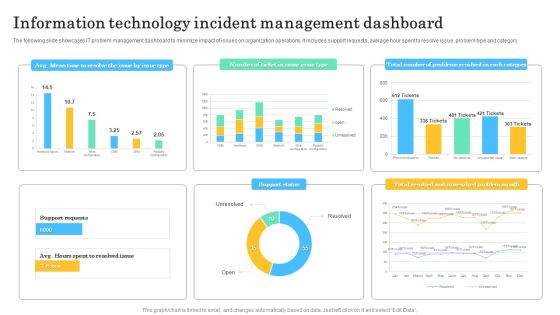
Information Technology Incident Management Dashboard Infographics PDF
The following slide showcases IT problem management dashboard to minimize impact of issues on organization operations. It includes support requests, average hour spent to resolve issue, problem type and category. Showcasing this set of slides titled Information Technology Incident Management Dashboard Infographics PDF. The topics addressed in these templates are Avg Mean Time, Resolve The Issue, Issue Type. All the content presented in this PPT design is completely editable. Download it and make adjustments in color, background, font etc. as per your unique business setting.

Customer Ratings Dashboard With Most Liked Positive And Negative Review Formats PDF
This slide showcases overall consumer reviews for companys product which includes sections such as rating distribution, top adjectives, most liked positive and negative comments to keep track of customer response and make necessary improvements. Showcasing this set of slides titled Customer Ratings Dashboard With Most Liked Positive And Negative Review Formats PDF. The topics addressed in these templates are Smells Great, Sun Protection, Soothing. All the content presented in this PPT design is completely editable. Download it and make adjustments in color, background, font etc. as per your unique business setting.
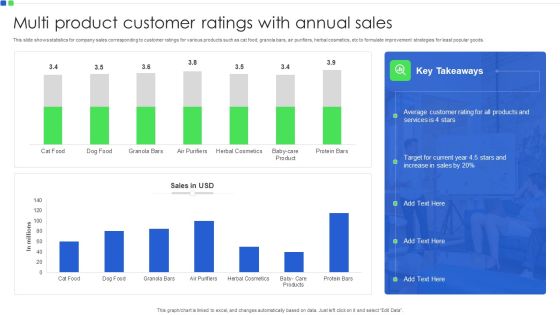
Multi Product Customer Ratings With Annual Sales Infographics PDF
This slide shows statistics for company sales corresponding to customer ratings for various products such as cat food, granola bars, air purifiers, herbal cosmetics, etc to formulate improvement strategies for least popular goods. Showcasing this set of slides titled Multi Product Customer Ratings With Annual Sales Infographics PDF. The topics addressed in these templates are Target For Current Year, Average Customer Rating. All the content presented in this PPT design is completely editable. Download it and make adjustments in color, background, font etc. as per your unique business setting.

Emerging Trends In Gym And Fitness Business Industry Diagrams PDF
This slide shows the statistics related to the emerging trends in the fitness industry. It includes trends related to fitness tech, wellness programs, studios within the club, changing generations etc. Showcasing this set of slides titled Emerging Trends In Gym And Fitness Business Industry Diagrams PDF. The topics addressed in these templates are Emerging Trends In Gym, Fitness Business Industry. All the content presented in this PPT design is completely editable. Download it and make adjustments in color, background, font etc. as per your unique business setting.
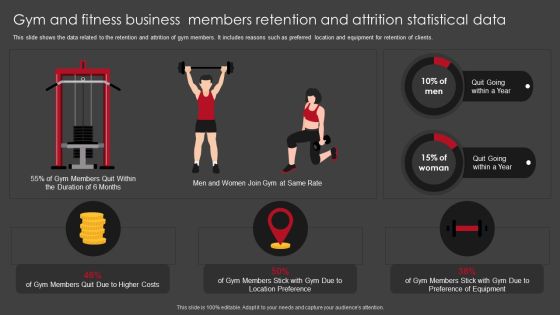
Gym And Fitness Business Members Retention And Attrition Statistical Data Professional PDF
This slide shows the data related to the retention and attrition of gym members. It includes reasons such as preferred location and equipment for retention of clients. Showcasing this set of slides titled Gym And Fitness Business Members Retention And Attrition Statistical Data Professional PDF. The topics addressed in these templates are Gym And Fitness Business, Members Retention And Attrition, Statistical Data. All the content presented in this PPT design is completely editable. Download it and make adjustments in color, background, font etc. as per your unique business setting.
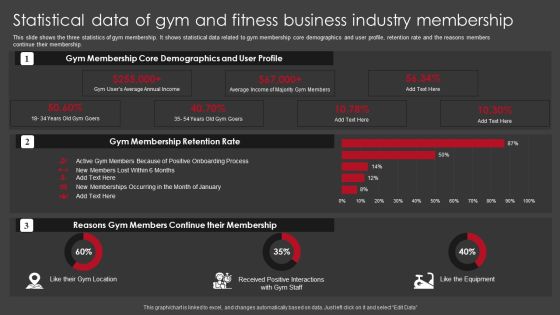
Statistical Data Of Gym And Fitness Business Industry Membership Brochure PDF
This slide shows the three statistics of gym membership. It shows statistical data related to gym membership core demographics and user profile, retention rate and the reasons members continue their membership. Showcasing this set of slides titled Statistical Data Of Gym And Fitness Business Industry Membership Brochure PDF. The topics addressed in these templates are Gym Membership Retention Rate, Reasons Gym Members, Continue Their Membership. All the content presented in this PPT design is completely editable. Download it and make adjustments in color, background, font etc. as per your unique business setting.
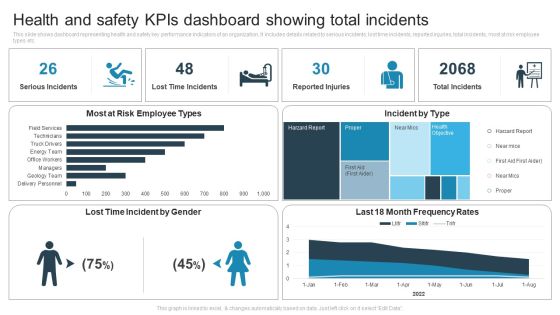
Health And Safety Kpis Dashboard Showing Total Incidents Pictures PDF
This slide shows dashboard representing health and safety key performance indicators of an organization. It includes details related to serious incidents, lost time incidents, reported injuries, total incidents, most at risk employee types etc. Showcasing this set of slides titled Health And Safety Kpis Dashboard Showing Total Incidents Pictures PDF. The topics addressed in these templates are Lost Time Incident, Most At Risk Employee, Incident By Type. All the content presented in this PPT design is completely editable. Download it and make adjustments in color, background, font etc. as per your unique business setting.

Organizational Health And Safety Measurement Dashboard With Key Kpis Microsoft PDF
This slide shows the dashboard representing information related to measurement of safety and health performance of an organization. It includes details related to incidents and injuries etc. Showcasing this set of slides titled Organizational Health And Safety Measurement Dashboard With Key Kpis Microsoft PDF. The topics addressed in these templates are Hazard This Year, Injuries By Activity, Task This Year. All the content presented in this PPT design is completely editable. Download it and make adjustments in color, background, font etc. as per your unique business setting.
