AI PPT Maker
Templates
PPT Bundles
Design Services
Business PPTs
Business Plan
Management
Strategy
Introduction PPT
Roadmap
Self Introduction
Timelines
Process
Marketing
Agenda
Technology
Medical
Startup Business Plan
Cyber Security
Dashboards
SWOT
Proposals
Education
Pitch Deck
Digital Marketing
KPIs
Project Management
Product Management
Artificial Intelligence
Target Market
Communication
Supply Chain
Google Slides
Research Services
 One Pagers
All Categories
-
Home
- Customer Favorites
- Budget Planning
Budget Planning

Cash Flow Statement Kpis Tabular Form Ppt PowerPoint Presentation Inspiration Master Slide
This is a cash flow statement kpis tabular form ppt powerpoint presentation inspiration master slide. This is a four stage process. The stages in this process are operations, financing activities, investing activities, net increase in cash.

Capex Summary Template 1 Ppt PowerPoint Presentation Layouts Examples
This is a capex summary template 1 ppt powerpoint presentation layouts examples. This is a four stage process. The stages in this process are business, finance, marketing, analysis, investment.

Capex Summary Template 2 Ppt PowerPoint Presentation Slides Template
This is a capex summary template 2 ppt powerpoint presentation slides template. This is a four stage process. The stages in this process are business, finance, marketing, analysis, investment.

Competitor Revenue And Profit Ppt PowerPoint Presentation Inspiration Slide Portrait
This is a competitor revenue and profit ppt powerpoint presentation inspiration slide portrait. This is a five stage process. The stages in this process are business, finance, analysis, growth, investment.

Competitors Average Price Product Ppt PowerPoint Presentation Inspiration Templates
This is a competitors average price product ppt powerpoint presentation inspiration templates. This is a five stage process. The stages in this process are business, finance, analysis, growth, investment, bar graph.

Cash Flow Statement Kpis Ppt PowerPoint Presentation Ideas Graphics
This is a cash flow statement kpis ppt powerpoint presentation ideas graphics. This is a four stage process. The stages in this process are operation, financing activities, net increase in cash, investing activities, business.

Stacked Bar Template 2 Ppt PowerPoint Presentation Show Clipart
This is a stacked bar template 2 ppt powerpoint presentation show clipart. This is a two stage process. The stages in this process are stacked bar, growth, finance, marketing, business, investment.

Cash Flow Statement Kpis Template Ppt PowerPoint Presentation Ideas Visual Aids
This is a cash flow statement kpis template ppt powerpoint presentation ideas visual aids. This is a four stage process. The stages in this process are operations, financing activities, investing activities, net increase in cash.

Cash Flow Statement - Kpis Ppt PowerPoint Presentation Layouts Graphics Template
This is a cash flow statement - kpis ppt powerpoint presentation layouts graphics template. This is a four stage process. The stages in this process are operations, financing activities, investing activities, net increase in cash.

Cash Flow Statement Graphical Representation Ppt PowerPoint Presentation Professional Graphics Tutorials
This is a cash flow statement graphical representation ppt powerpoint presentation professional graphics tutorials. This is a four stage process. The stages in this process are business, operations, financing activities, net increase in cash, investing activities.

Cash Flow Statement Graphical Representation Ppt PowerPoint Presentation Professional Show
This is a cash flow statement graphical representation ppt powerpoint presentation professional show. This is a four stage process. The stages in this process are business, operations, investing activities, net increase in cash, financing activities.

Clustered Column Ppt PowerPoint Presentation Inspiration Layout
This is a clustered column ppt powerpoint presentation inspiration layout. This is a two stage process. The stages in this process are clustered column, finance, marketing, management, investment, analysis.
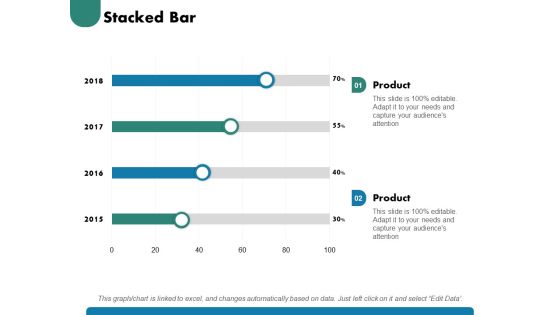
Stacked Bar Ppt PowerPoint Presentation Slides Demonstration
This is a stacked bar ppt powerpoint presentation slides demonstration. This is a two stage process. The stages in this process are stacked bar, finance, marketing, management, investment, analysis.

Clustered Column Ppt PowerPoint Presentation Gallery Master Slide
This is a clustered column ppt powerpoint presentation gallery master slide. This is a two stage process. The stages in this process are clustered column, finance, marketing, management, investment.

Clustered Bar Ppt PowerPoint Presentation Professional Vector
This is a clustered bar ppt powerpoint presentation professional vector. This is a two stage process. The stages in this process are clustered bar, finance, marketing, management, investment, analysis.

Stacked Bar Ppt PowerPoint Presentation Inspiration Slide Download
This is a stacked bar ppt powerpoint presentation inspiration slide download. This is a two stage process. The stages in this process are stacked bar, finance, marketing, management, investment, analysis.
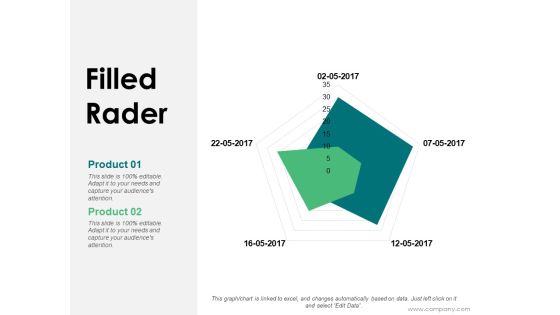
Filled Rader Ppt PowerPoint Presentation Visual Aids Example 2015
This is a filled rader ppt powerpoint presentation visual aids example 2015. This is a two stage process. The stages in this process are filled rader, finance, marketing, management, investment.
Stacked Area Clustered Column Ppt PowerPoint Presentation Icon Model
This is a stacked area clustered column ppt powerpoint presentation icon model. This is a three stage process. The stages in this process are finance, marketing, management, investment, analysis.
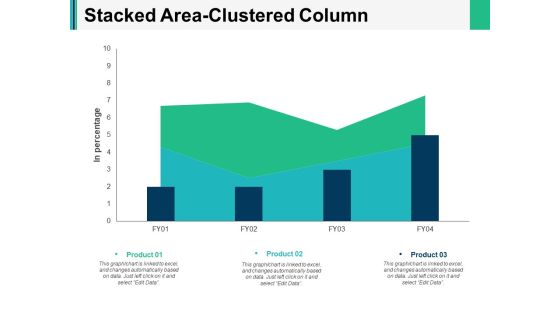
Stacked Area Clustered Column Ppt PowerPoint Presentation Infographics Backgrounds
This is a stacked area clustered column ppt powerpoint presentation infographics backgrounds. This is a three stage process. The stages in this process are finance, marketing, management, investment, analysis.

Bar Graph 7 QC Tools Ppt PowerPoint Presentation Styles Structure
This is a bar graph 7 qc tools ppt powerpoint presentation styles structure. This is a three stage process. The stages in this process are bar graph, finance, marketing, analysis, investment.

Change Management Performance Dashboard Ppt PowerPoint Presentation Professional Slides
This is a change management performance dashboard ppt powerpoint presentation professional slides. This is a three stage process. The stages in this process are finance, marketing, management, investment, analysis.
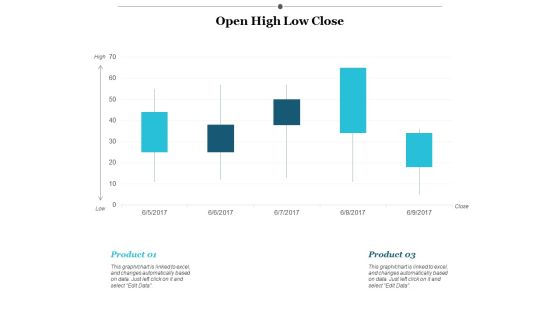
Open High Low Close Ppt PowerPoint Presentation Gallery Graphics Template
This is a open high low close ppt powerpoint presentation gallery graphics template. This is a two stage process. The stages in this process are finance, marketing, management, investment, analysis.

100 Percent Stacked Bar Ppt PowerPoint Presentation Layouts Graphics Template
This is a 100 percent stacked bar ppt powerpoint presentation layouts graphics template. This is a three stage process. The stages in this process are finance, marketing, management, investment, analysis.

Open High Low Close Ppt PowerPoint Presentation Show Graphics Template
This is a open high low close ppt powerpoint presentation show graphics template. This is a two stage process. The stages in this process are finance, marketing, management, investment, analysis.

Capability Maturity Matrix Marketing Ppt PowerPoint Presentation Layouts Pictures
This is a capability maturity matrix marketing ppt powerpoint presentation layouts pictures. This is a five stage process. The stages in this process are Finance, Analysis, Business, Investment, Marketing.

January 2000 July 2013 Marketing Ppt PowerPoint Presentation File Slide Download
This is a january 2000 july 2013 marketing ppt powerpoint presentation file slide download. This is a four stage process. The stages in this process are finance, analysis, business, investment, marketing.

Open High Low Close Ppt PowerPoint Presentation Slides Guidelines
This is a open high low close ppt powerpoint presentation slides guidelines. This is a two stage process. The stages in this process are finance, analysis, business, investment, marketing.

Retail Global Trends Comparing Online Ppt PowerPoint Presentation Infographics Guide
This is a retail global trends comparing online ppt powerpoint presentation infographics guide. This is a two stage process. The stages in this process are finance, analysis, business, investment, marketing.

Retail KPI Dashboard Showing Revenue Vs Units Sold Ppt PowerPoint Presentation Professional Smartart
This is a retail kpi dashboard showing revenue vs units sold ppt powerpoint presentation professional smartart. This is a four stage process. The stages in this process are finance, analysis, business, investment, marketing.

Retail KPI Dashboard Showing Sales Revenue Customers Ppt PowerPoint Presentation Show Background Designs
This is a retail kpi dashboard showing sales revenue customers ppt powerpoint presentation show background designs. This is a six stage process. The stages in this process are finance, analysis, business, investment, marketing.
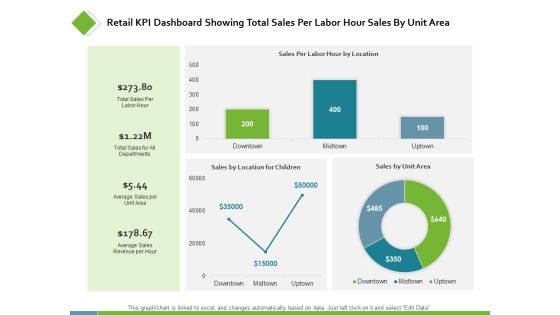
Retail KPI Dashboard Showing Total Sales Per Labor Ppt PowerPoint Presentation Styles Examples
This is a retail kpi dashboard showing total sales per labor ppt powerpoint presentation styles examples. This is a three stage process. The stages in this process are finance, analysis, business, investment, marketing.
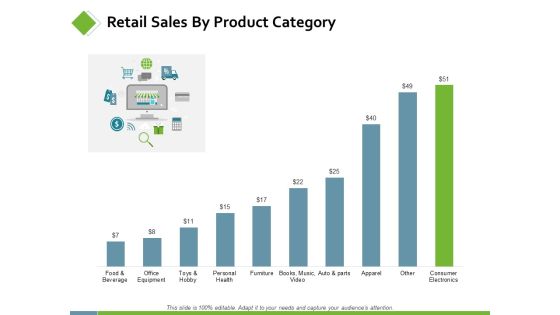
Retail Sales By Product Category Ppt PowerPoint Presentation Infographic Template Images
This is a retail sales by product category ppt powerpoint presentation infographic template images. This is a two stage process. The stages in this process are finance, analysis, business, investment, marketing.
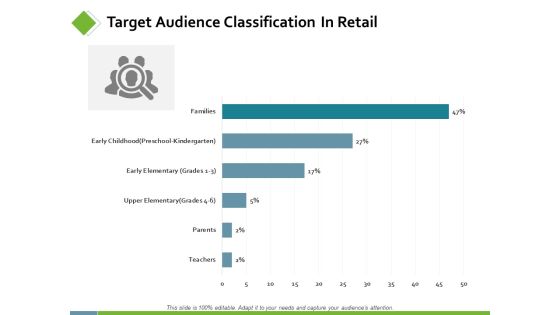
Target Audience Classification In Retail Ppt PowerPoint Presentation Summary Infographics
This is a target audience classification in retail ppt powerpoint presentation summary infographics. This is a two stage process. The stages in this process are finance, analysis, business, investment, marketing.
Employee Weekly Efficiency Dashboard Ppt PowerPoint Presentation Icon Backgrounds
This is a employee weekly efficiency dashboard ppt powerpoint presentation icon backgrounds. This is a four stage process. The stages in this process are finance, analysis, business, investment, marketing.
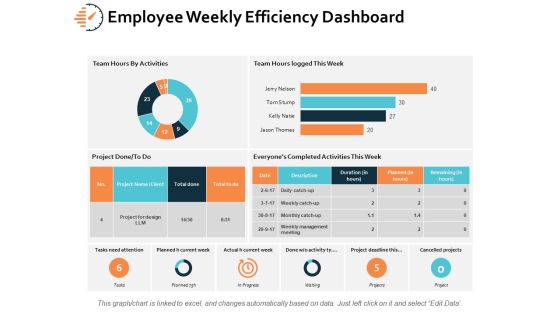
Employee Weekly Efficiency Dashboard Ppt PowerPoint Presentation Infographics Microsoft
This is a employee weekly efficiency dashboard ppt powerpoint presentation infographics microsoft. This is a six stage process. The stages in this process are finance, analysis, business, investment, marketing.
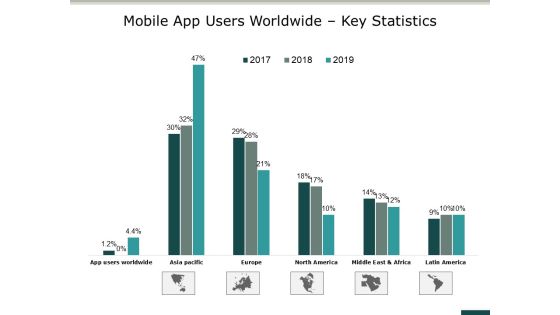
Mobile App Users Worldwide Key Statistics Ppt PowerPoint Presentation File Design Templates
This is a mobile app users worldwide key statistics ppt powerpoint presentation file design templates. This is a three stage process. The stages in this process are finance, marketing, management, investment, analysis.
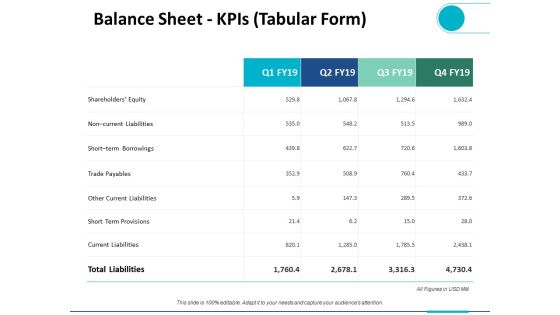
Balance Sheet Kpis Tabular Form Ppt PowerPoint Presentation Ideas Design Templates
This is a balance sheet kpis tabular form ppt powerpoint presentation ideas design templates. This is a four stage process. The stages in this process are finance, analysis, business, investment, marketing.

Cash Flow Statement Kpis Tabular Form Ppt PowerPoint Presentation Summary Infographic Template
This is a cash flow statement kpis tabular form ppt powerpoint presentation summary infographic template. This is a four stage process. The stages in this process are finance, analysis, business, investment, marketing.

Sales By Category Ppt PowerPoint Presentation Ideas Graphics Design
This is a sales by category ppt powerpoint presentation ideas graphics design. This is a three stage process. The stages in this process are finance, analysis, business, investment, marketing.

Portfolio Management Securities Allocation Dashboard Ppt PowerPoint Presentation Pictures Objects
This is a portfolio management securities allocation dashboard ppt powerpoint presentation pictures objects. This is a five stage process. The stages in this process are finance, marketing, management, investment.

Inventory And Logistics Dashboard Ppt PowerPoint Presentation Professional Styles
This is a inventory and logistics dashboard ppt powerpoint presentation professional styles. This is a four stage process. The stages in this process are finance, marketing, management, investment, analysis.
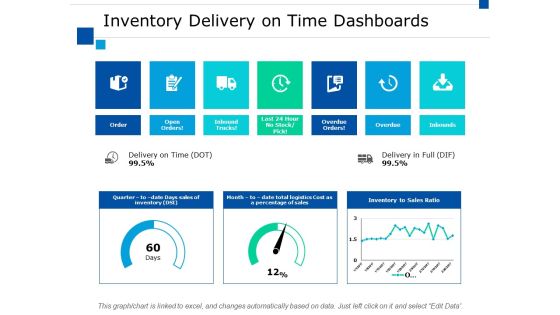
Inventory Delivery On Time Dashboards Ppt PowerPoint Presentation Slides Download
This is a inventory delivery on time dashboards ppt powerpoint presentation slides download. This is a seven stage process. The stages in this process are finance, marketing, management, investment, analysis.

Logistics Kpi Metrics Business Ppt PowerPoint Presentation Ideas Infographics
This is a logistics kpi metrics business ppt powerpoint presentation ideas infographics. This is a four stage process. The stages in this process are finance, marketing, management, investment, analysis.

Quality Control Kpi Dashboard Ppt PowerPoint Presentation Slides Topics
This is a quality control kpi dashboard ppt powerpoint presentation slides topics. This is a four stage process. The stages in this process are finance, marketing, management, investment, analysis.

Quality Control Kpi Metrics Ppt PowerPoint Presentation Slides Guidelines
This is a quality control kpi metrics ppt powerpoint presentation slides guidelines. This is a three stage process. The stages in this process are finance, marketing, management, investment, analysis.
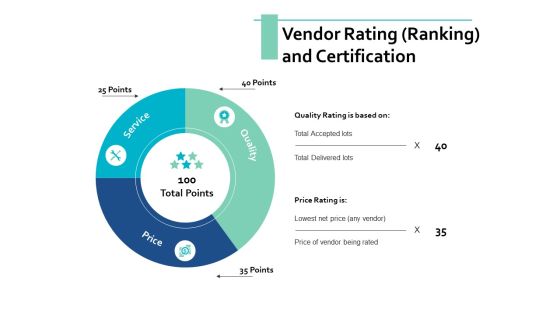
Vendor Rating Ranking And Certification Ppt PowerPoint Presentation Model Clipart
This is a vendor rating ranking and certification ppt powerpoint presentation model clipart. This is a three stage process. The stages in this process are finance, marketing, management, investment, analysis.
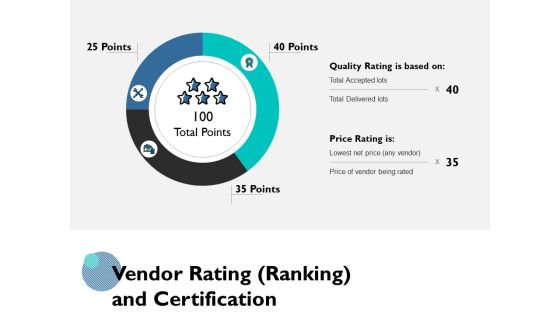
Vendor Rating Ranking And Certification Ppt PowerPoint Presentation Gallery Ideas
This is a vendor rating ranking and certification ppt powerpoint presentation gallery ideas. This is a three stage process. The stages in this process are finance, marketing, management, investment, analysis.

Area Chart Ppt PowerPoint Presentation Styles Graphics
This is a area chart ppt powerpoint presentation styles graphics. This is a two stage process. The stages in this process are business, charts, graphs, marketing, finance.
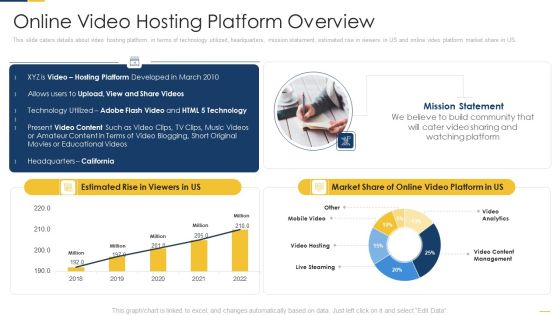
Online Video Hosting Platform Overview Download PDF
This slide caters details about video hosting platform, in terms of technology utilized, headquarters, mission statement, estimated rise in viewers in US and online video platform market share in US. Deliver and pitch your topic in the best possible manner with this online video hosting platform overview download pdf. Use them to share invaluable insights on estimated rise in viewers, online video platform, mission statement and impress your audience. This template can be altered and modified as per your expectations. So, grab it now.

Market Potential Report For Business Feasibility Pictures PDF
This slide showcases dashboard that help organization to identify the market viability and potential before launch of final product. Its key components are market growth estimation, market by geography, market with product segment and opportunities available Pitch your topic with ease and precision using this market potential report for business feasibility pictures pdf This layout presents information on geographical location, opportunities in market, growth estimation It is also available for immediate download and adjustment. So, changes can be made in the color, design, graphics or any other component to create a unique layout.
Effect Of Pandemic On Education By Global School Closures Icons PDF
The slide illustrates the impact of COVID-19 on schools worldwide to estimate the educational loss to learners. The data included is the number of learners impacted by COVID from march 25 to april 30, 2020. Pitch your topic with ease and precision using this Effect Of Pandemic On Education By Global School Closures Icons PDF. This layout presents information on Total Estimated, Localized Level Educational, Institutions Closure. It is also available for immediate download and adjustment. So, changes can be made in the color, design, graphics or any other component to create a unique layout.
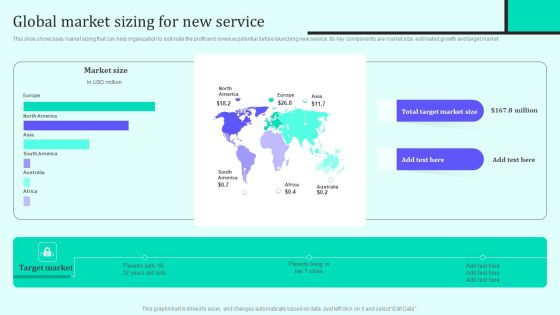
Implementing New Sales And Marketing Process For Services Global Market Sizing For New Service Information PDF
This slide showcases market sizing that can help organization to estimate the profit and revenue potential before launching new service. Its key components are market size, estimated growth and target market. Want to ace your presentation in front of a live audience Our Implementing New Sales And Marketing Process For Services Global Market Sizing For New Service Information PDF can help you do that by engaging all the users towards you. Slidegeeks experts have put their efforts and expertise into creating these impeccable powerpoint presentations so that you can communicate your ideas clearly. Moreover, all the templates are customizable, and easy to edit and downloadable. Use these for both personal and commercial use.
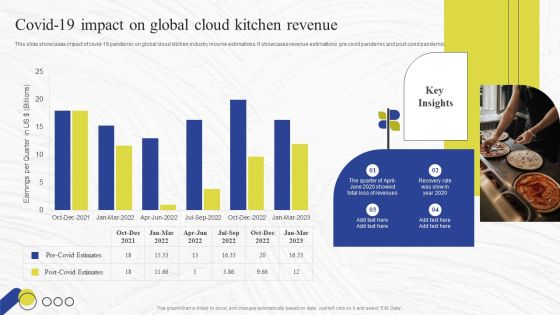
Virtual Kitchen Market Assessment Covid 19 Impact On Global Cloud Kitchen Revenue Mockup PDF
This slide showcases impact of covid-19 pandemic on global cloud kitchen industry income estimations. It showcases revenue estimations pre covid pandemic and post covid pandemic. Find a pre-designed and impeccable Virtual Kitchen Market Assessment Covid 19 Impact On Global Cloud Kitchen Revenue Mockup PDF. The templates can ace your presentation without additional effort. You can download these easy-to-edit presentation templates to make your presentation stand out from others. So, what are you waiting for Download the template from Slidegeeks today and give a unique touch to your presentation.

Business Receipt Management System Dashboard Portrait PDF
The slide displays a dashboard for invoice management system for preventing delays and errors in receiving and paying. It shows multiple elements such as activity, glance, estimates of past 6 months, invoice summary, income and expenses, account receivables and account payables. Showcasing this set of slides titled Business Receipt Management System Dashboard Portrait PDF. The topics addressed in these templates are Income expenses, Invoice summary, Estimate. All the content presented in this PPT design is completely editable. Download it and make adjustments in color, background, font etc. as per your unique business setting.

Monitor Effectiveness Metrics Powerpoint Guide
This is a monitor effectiveness metrics powerpoint guide. This is a six stage process. The stages in this process are design policies and enforcement mechanisms, deploy governance infrastructure, identify owners and funding model, monitor effectiveness metrics, deploy governance mechanisms, design governance infrastructure.
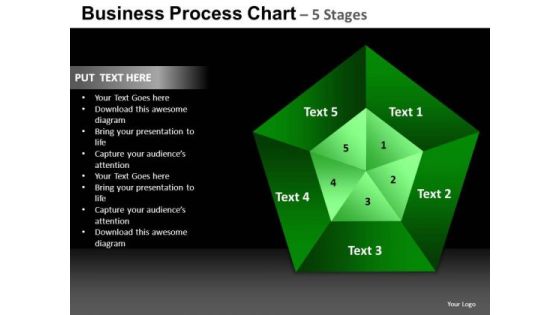
PowerPoint Design Slides Editable Quadrant Chart Ppt Themes
PowerPoint Design Slides Editable Quadrant Chart PPT Themes-These high quality powerpoint pre-designed slides and powerpoint templates have been carefully created by our professional team to help you impress your audience. All slides have been created and are 100% editable in powerpoint. Each and every property of any graphic - color, size, orientation, shading, outline etc. can be modified to help you build an effective powerpoint presentation. Any text can be entered at any point in the powerpoint template or slide. Simply DOWNLOAD, TYPE and PRESENT!

PowerPoint Design Slides Education Quadrant Chart Ppt Presentation
PowerPoint Design Slides Education Quadrant Chart PPT Presentation-These high quality powerpoint pre-designed slides and powerpoint templates have been carefully created by our professional team to help you impress your audience. All slides have been created and are 100% editable in powerpoint. Each and every property of any graphic - color, size, orientation, shading, outline etc. can be modified to help you build an effective powerpoint presentation. Any text can be entered at any point in the powerpoint template or slide. Simply DOWNLOAD, TYPE and PRESENT!
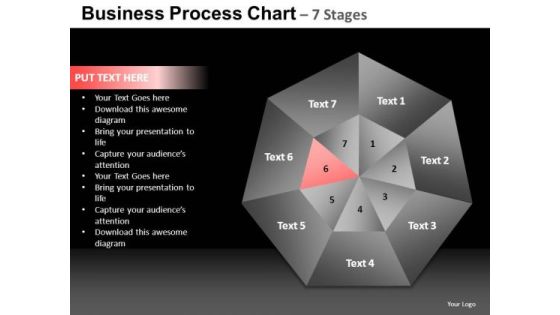
PowerPoint Design Slides Growth Quadrant Chart Ppt Layouts
PowerPoint Design Slides Growth Quadrant Chart PPT Layouts-These high quality powerpoint pre-designed slides and powerpoint templates have been carefully created by our professional team to help you impress your audience. All slides have been created and are 100% editable in powerpoint. Each and every property of any graphic - color, size, orientation, shading, outline etc. can be modified to help you build an effective powerpoint presentation. Any text can be entered at any point in the powerpoint template or slide. Simply DOWNLOAD, TYPE and PRESENT!

PowerPoint Design Slides Leadership Quadrant Chart Ppt Designs
PowerPoint Design Slides Leadership Quadrant Chart PPT Designs-These high quality powerpoint pre-designed slides and powerpoint templates have been carefully created by our professional team to help you impress your audience. All slides have been created and are 100% editable in powerpoint. Each and every property of any graphic - color, size, orientation, shading, outline etc. can be modified to help you build an effective powerpoint presentation. Any text can be entered at any point in the powerpoint template or slide. Simply DOWNLOAD, TYPE and PRESENT!

PowerPoint Design Slides Teamwork Quadrant Chart Ppt Layouts
PowerPoint Design Slides Teamwork Quadrant Chart PPT Layouts-These high quality powerpoint pre-designed slides and powerpoint templates have been carefully created by our professional team to help you impress your audience. All slides have been created and are 100% editable in powerpoint. Each and every property of any graphic - color, size, orientation, shading, outline etc. can be modified to help you build an effective powerpoint presentation. Any text can be entered at any point in the powerpoint template or slide. Simply DOWNLOAD, TYPE and PRESENT!
