Budget Planning
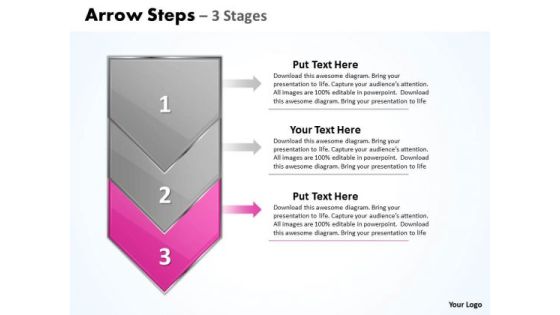
Flow Ppt Template Arrow 3 Stages 1 Project Management PowerPoint 4 Graphic
We present our flow PPT template arrow 3 stages 1 project management Powerpoint 4 Graphic. Use our Metaphor PowerPoint Templates because, your brain is always churning out ideas like cogs in a wheel. Use our Symbol PowerPoint Templates because, designed to attract the attention of your audience. Use our Business PowerPoint Templates because, Marketing Strategy Business Template: - Maximizing sales of your product is the intended destination. Use our Arrows PowerPoint Templates because, Timelines Display: - You have developed a vision of where you want to be a few years from now. Use our Process and Flows PowerPoint Templates because; demonstrate how you think out of the box. Use these PowerPoint slides for presentations relating to Arrow, Background, Business, Chart, Diagram, Financial, Graphic, Gray, Icon, Illustration, Management, Orange, Perspective, Process, Reflection, Steps, Text, Transparency. The prominent colors used in the PowerPoint template are Pink, Gray, and Black
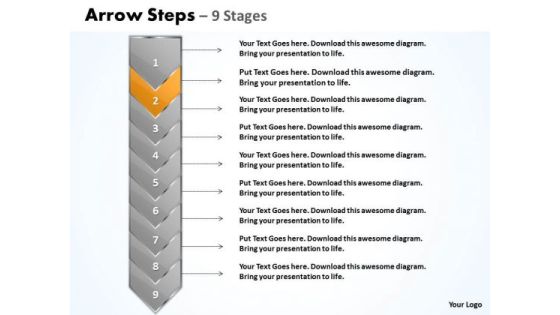
Flow Ppt Template Arrow 9 Power Point Stages Project Management PowerPoint 3 Design
We present our flow PPT template arrow 9 power point stages project management Powerpoint 3 design. Use our Metaphor PowerPoint Templates because, develop your marketing strategy and communicate your enthusiasm and motivation to raise the bar. Use our Symbol PowerPoint Templates because; Help them develop their thoughts along the way. Use our Business PowerPoint Templates because; Shower them with the wisdom of your words. Use our Arrows PowerPoint Templates because; Highlight the various ways in which we can maintain its efficiency. Use our Process and Flows PowerPoint Templates because, prove how they mesh to motivate the company team and provide the steam to activate the composite machine. Use these PowerPoint slides for presentations relating to Arrow, Background, Business, Chart, Diagram, Financial, Graphic, Gray, Icon, Illustration, Management, Orange, Perspective, Process, Reflection, Steps, Text, Transparency. The prominent colors used in the PowerPoint template are Orange, Gray, and Black
Digital Edibles Distribution Capital Funding Pitch Deck Market Segmentation Of On Demand Online Food Delivery Platforms Icons PDF
Following slide provides information about the market segmentation of On Demand Online Food Delivery Service Markets and Platforms across globe. The segments can be categorized by platform type, by business model, by payment method and by region. Presenting digital edibles distribution capital funding pitch deck market segmentation of on demand online food delivery platforms icons pdf to provide visual cues and insights. Share and navigate important information on four stages that need your due attention. This template can be used to pitch topics like applications, payment, business model, system. In addtion, this PPT design contains high resolution images, graphics, etc, that are easily editable and available for immediate download.
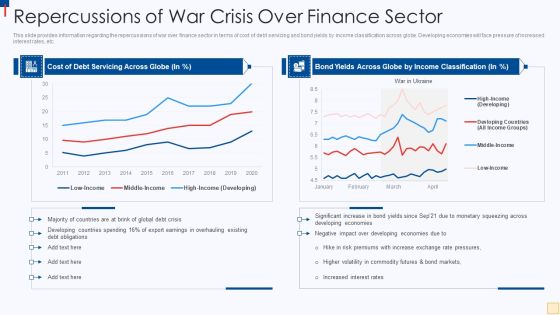
Ukraine Vs Russia Examining Repercussions Of War Crisis Over Finance Sector Guidelines PDF
This slide provides information regarding the repercussions of war over finance sector in terms of cost of debt servicing and bond yields by income classification across globe. Developing economies will face pressure of increased interest rates, etc. Deliver and pitch your topic in the best possible manner with this Ukraine Vs Russia Examining Repercussions Of War Crisis Over Finance Sector Guidelines PDF. Use them to share invaluable insights on Cost Debt Servicing, Across Globe, Bond Yields Across, Globe By Income Classification and impress your audience. This template can be altered and modified as per your expectations. So, grab it now.
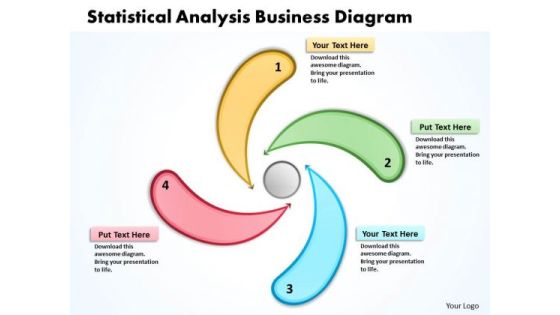
Statistical Analysis Business PowerPoint Presentations Diagram Radial Process Templates
We present our statistical analysis business powerpoint presentations diagram Radial Process templates.Download our Business PowerPoint Templates because you are ready to flap your wings and launch off. All poised are you to touch the sky with glory. Download and present our Marketing PowerPoint Templates because The marketplace is the merger of your dreams and your ability. Use our Shapes PowerPoint Templates because it is a step by step process with levels rising at every stage. Present our Finance PowerPoint Templates because readymade PowerPoint templates can prove best of your knowledge for your slides to show. Download our Symbol PowerPoint Templates because it helps you to inform your team of your innovative ideas.Use these PowerPoint slides for presentations relating to Arrows, Abstract, Assemblage, Assembly, Blue, Build, Coherence, Construction, Cooperate, Corporate, Crew, Finalize, Floor, Form, Four, Game, Graphic, Green, Group, Illustration, Improve, Infrastructure, Ingenious, Interface, Link, Piece. The prominent colors used in the PowerPoint template are Yellow, Red, Blue. We assure you our statistical analysis business powerpoint presentations diagram Radial Process templates are Nifty. Customers tell us our Assembly PowerPoint templates and PPT Slides are Attractive. The feedback we get is that our statistical analysis business powerpoint presentations diagram Radial Process templates are Nostalgic. We assure you our Cooperate PowerPoint templates and PPT Slides are Chic. People tell us our statistical analysis business powerpoint presentations diagram Radial Process templates are Amazing. We assure you our Coherence PowerPoint templates and PPT Slides have awesome images to get your point across.

Business Process Optimization Platform Investors Funding Presentation Company Introduction Infographics PDF
Mentioned slide provides workflow management company overview. It includes company description, mission statement, vision, core values, founded year, founders, headquarters, ticker symbol, company type, and legal name. Make sure to capture your audiences attention in your business displays with our gratis customizable Business Process Optimization Platform Investors Funding Presentation Company Introduction Infographics PDF. These are great for business strategies, office conferences, capital raising or task suggestions. If you desire to acquire more customers for your tech business and ensure they stay satisfied, create your own sales presentation with these plain slides.
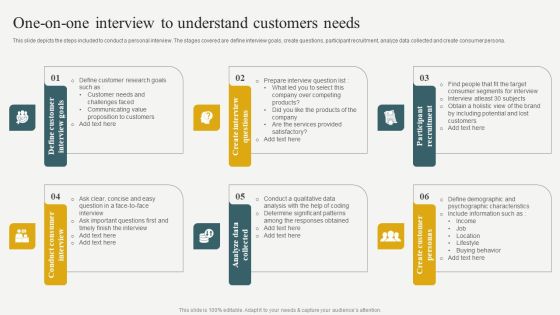
Evaluating Financial Position Of E Commerce Company One On One Interview To Understand Customers Needs Portrait PDF
This slide depicts the steps included to conduct a personal interview. The stages covered are define interview goals, create questions, participant recruitment, analyze data collected and create consumer persona. Make sure to capture your audiences attention in your business displays with our gratis customizable Evaluating Financial Position Of E Commerce Company One On One Interview To Understand Customers Needs Portrait PDF. These are great for business strategies, office conferences, capital raising or task suggestions. If you desire to acquire more customers for your tech business and ensure they stay satisfied, create your own sales presentation with these plain slides.
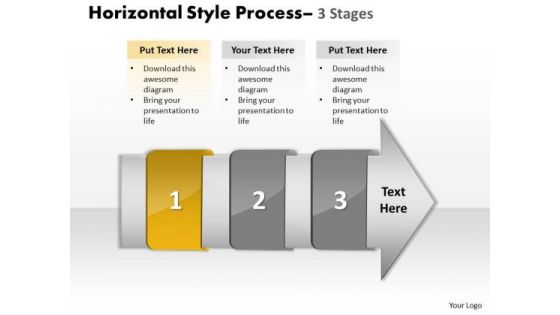
PowerPoint Template Horizontal Steps Working With Slide Numbers Demonstration Image
We present our PowerPoint template horizontal steps working with slide numbers demonstration Image. Use our Arrows PowerPoint Templates because; Impress upon the audience how your strategy will carry all to the top of the corporate heap. Use our Leadership PowerPoint Templates because, to take your team soaring to the pinnacle they crave. Use our Process and flows PowerPoint Templates because, There are a bucketful of brilliant ideas swirling around within your group. Use our Symbol PowerPoint Templates because, you have the process in your head, our template design showing will illuminate your thoughts. Use our Business PowerPoint Templates because, Gears Interconnected:- The Gear Train is a basic element of living and daily business. Use these PowerPoint slides for presentations relating to Abstract, Arrow, Blank, Business, Chart, Circular, Circulation, Concept, Conceptual, Design, Diagram, Executive, Icon, Idea, Illustration, Linear, Management, Model, Numbers, Organization, Procedure, Process, Progression, Resource, Sequence, Sequential, Stages, Steps, Strategy. The prominent colors used in the PowerPoint template are Yellow, Gray, and White

Major Acquisitions Initiated By Amazon To Attract Target Audience Infographics PDF
This slide provides information regarding potential businesses acquired by amazon in past years. Firm considered acquisitions in order to strengthen its core e commerce operations and technology in order to attract target audience. From laying roadmaps to briefing everything in detail, our templates are perfect for you. You can set the stage with your presentation slides. All you have to do is download these easy to edit and customizable templates. Major Acquisitions Initiated By Amazon To Attract Target Audience Infographics PDF will help you deliver an outstanding performance that everyone would remember and praise you for. Do download this presentation today.
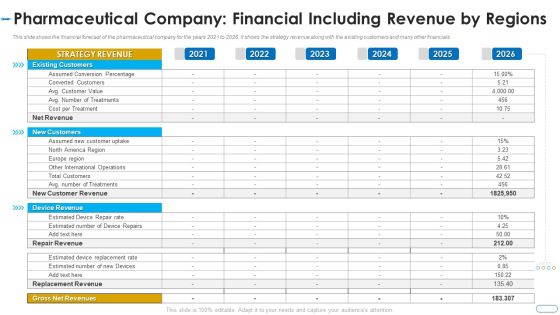
Initiatives Atmosphere Operation Problems Pharmaceutical Firm Pharmaceutical Revenue By Regions Rules PDF
This slide shows the financial forecast of the pharmaceutical company for the years 2021 to 2026. It shows the strategy revenue along with the existing customers and many other financials Deliver an awe inspiring pitch with this creative initiatives atmosphere operation problems pharmaceutical firm pharmaceutical revenue by regions rules pdf bundle. Topics like converted, strategy, operations, assumed, treatments, revenue can be discussed with this completely editable template. It is available for immediate download depending on the needs and requirements of the user.
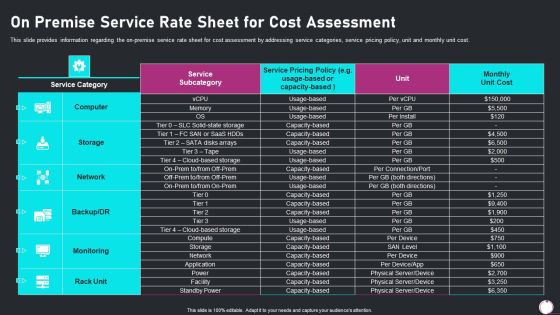
Information Technology Transformation Playbook On Premise Service Rate Sheet For Cost Assessment Graphics PDF
This slide provides information regarding the on premise service rate sheet for cost assessment by addressing service categories, service pricing policy, unit and monthly unit cost. Deliver and pitch your topic in the best possible manner with this information technology transformation playbook on premise service rate sheet for cost assessment graphics pdf. Use them to share invaluable insights on on premise service rate sheet for cost assessment and impress your audience. This template can be altered and modified as per your expectations. So, grab it now.
Playbook For Managing Information On Premise Service Rate Sheet For Cost Assessment Slides PDF
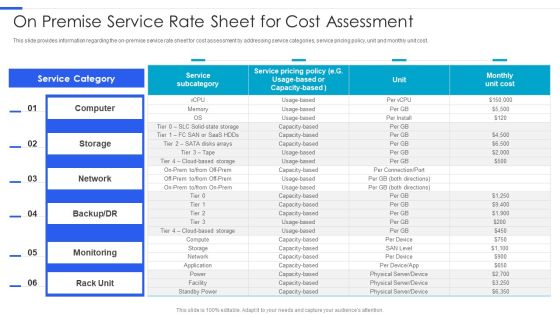
This slide provides information regarding the on-premise service rate sheet for cost assessment by addressing service categories, service pricing policy, unit and monthly unit cost. Deliver and pitch your topic in the best possible manner with this Playbook For Managing Information On Premise Service Rate Sheet For Cost Assessment Slides PDF. Use them to share invaluable insights on Service Category, Service Subcategory, Monthly Unit Cost and impress your audience. This template can be altered and modified as per your expectations. So, grab it now.

Achieving Proactive From Reactive AI And Machine Learning Training Program Infographics PDF
This slide depicts the artificial intelligence and machine learning training program including trainer name, training, schedule, cost and participant departments such as HR, accounts, operations. Deliver an awe inspiring pitch with this creative Achieving Proactive From Reactive AI And Machine Learning Training Program Infographics PDF bundle. Topics like Trainer, Departments, Module, Schedule can be discussed with this completely editable template. It is available for immediate download depending on the needs and requirements of the user.

Business Framework Business Process Improvement Model PowerPoint Presentation
This Business framework diagram Pot has been designed with graphic of circular decision flow chart. This diagram PPT slide is suitable for business process improvement. Make a model for process improvement and display the sequence of decisions.
Business Framework Business Process Mapping PowerPoint Presentation 2
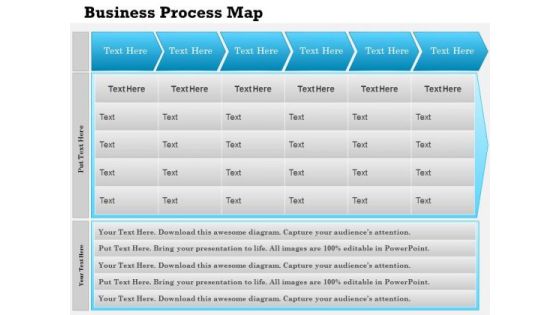
This business framework diagram PPT has been designed with graphic of text boxes chart. This image displays the concept of business process mapping. Use this image for your business and marketing related presentations.
Business Framework Fault Tree Analysis With Symbols PowerPoint Presentation
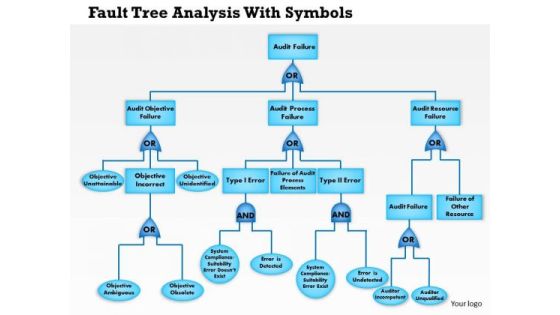
Explain the concept of fault tree analysis with symbols. This business framework has been crafted with graphic of organizational chart. Use this PPT diagram for your audit objective and failure related topics.

Business Framework How Map Reduce Works PowerPoint Presentation
This business diagram displays framework for how map reduce works. This contains the graphic of map build with flow chart. Use editable diagram for your business presentations to get good comments from your viewers.
Stairscase Diagram Chart PowerPoint Slides Editable Ppt Templates
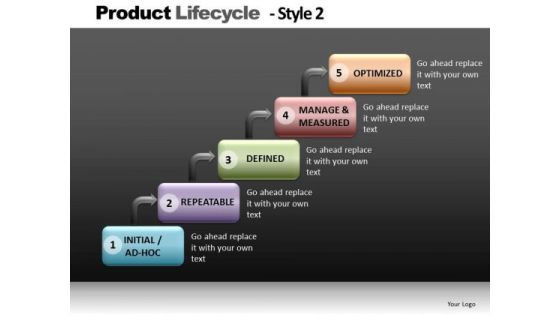
StairsCase Diagram Chart PowerPoint Slides Editable PPT templates-These high quality powerpoint pre-designed slides and powerpoint templates have been carefully created by our professional team to help you impress your audience. All slides have been created and are 100% editable in powerpoint. Each and every property of any graphic - color, size, orientation, shading, outline etc. can be modified to help you build an effective powerpoint presentation. Any text can be entered at any point in the powerpoint template or slide. Simply DOWNLOAD, TYPE and PRESENT!These PowerPoint designs and slide layouts can be used to in presentations relating to --Activities, business, clipart, commerce, concept, conceptual, customer, design, diagram, direction, distribution, guidelines, icon, illustration, integration, lifecycle, manage, management, manufacturing, marketing, mba, model, optimize, organization, performance, process, product, resentation, resource, sales, selling, steps, system, theoretical, theory, tool-StairsCase Diagram Chart PowerPoint Slides Editable PPT templates
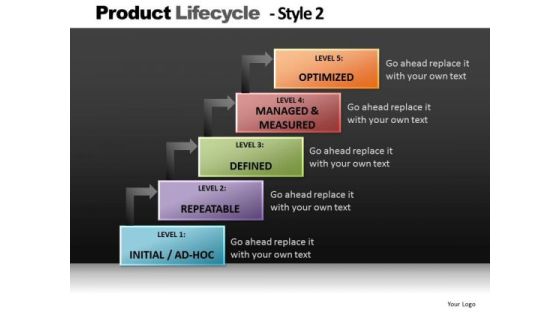
Step Diagram Chart Process PowerPoint Slides And Editable Ppt Templates
Step Diagram Chart Process PowerPoint Slides and Editable PPT templates-These high quality powerpoint pre-designed slides and powerpoint templates have been carefully created by our professional team to help you impress your audience. All slides have been created and are 100% editable in powerpoint. Each and every property of any graphic - color, size, orientation, shading, outline etc. can be modified to help you build an effective powerpoint presentation. Any text can be entered at any point in the powerpoint template or slide. Simply DOWNLOAD, TYPE and PRESENT!These PowerPoint designs and slide layouts can be used to in presentations relating to --Activities, business, clipart, commerce, concept, conceptual, customer, design, diagram, direction, distribution, guidelines, icon, illustration, integration, lifecycle, manage, management, manufacturing, marketing, mba, model, optimize, organization, performance, process, product, resentation, resource, sales, selling, steps, system, theoretical, theory, tool-Step Diagram Chart Process PowerPoint Slides and Editable PPT templates

Steps Process Chart Diagram PowerPoint Slides And Editable PowerPoint Templates
Steps Process Chart Diagram PowerPoint Slides and Editable PowerPoint templates-These high quality powerpoint pre-designed slides and powerpoint templates have been carefully created by our professional team to help you impress your audience. All slides have been created and are 100% editable in powerpoint. Each and every property of any graphic - color, size, orientation, shading, outline etc. can be modified to help you build an effective powerpoint presentation. Any text can be entered at any point in the powerpoint template or slide. Simply DOWNLOAD, TYPE and PRESENT!These PowerPoint designs and slide layouts can be used to in presentations relating to --Activities, business, clipart, commerce, concept, conceptual, customer, design, diagram, direction, distribution, guidelines, icon, illustration, integration, lifecycle, manage, management, manufacturing, marketing, mba, model, optimize, organization, performance, process, product, resentation, resource, sales, selling, steps, system, theoretical, theory, tool-Steps Process Chart Diagram PowerPoint Slides and Editable PowerPoint templates

Organization Charts Templates Ppt Examples Professional
This is a organization charts templates ppt examples professional. This is a five stage process. The stages in this process are board of directors, secretary, finance department, manager, marketing department, assistant manager, human resources department.
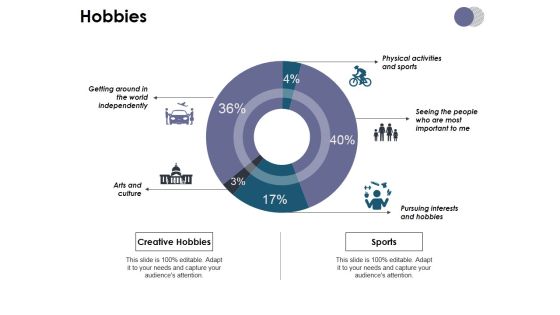
Hobbies Ppt PowerPoint Presentation Slides Master Slide
This is a hobbies ppt powerpoint presentation slides master slide. This is a five stage process. The stages in this process are business, finance, analysis, marketing, investment.

Bar Graph Ppt PowerPoint Presentation Styles Show
This is a bar graph ppt powerpoint presentation styles show. This is a one stage process. The stages in this process are bar graph, finance, marketing, investment, business.
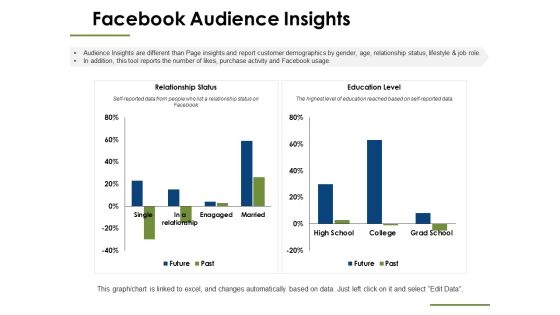
Facebook Audience Insights Ppt PowerPoint Presentation Professional Slide
This is a facebook audience insights ppt powerpoint presentation professional slide. This is a two stage process. The stages in this process are finance, business, marketing, management, investment.

Clustered Bar Ppt PowerPoint Presentation Icon Example
This is a clustered bar ppt powerpoint presentation icon example. This is a two stage process. The stages in this process are finance, investment, analysis, business, marketing.

Clustered Column Ppt PowerPoint Presentation Infographics Picture
This is a clustered column ppt powerpoint presentation infographics picture. This is a two stage process. The stages in this process are finance, marketing, management, investment, analysis.

Area Stacked Ppt PowerPoint Presentation Ideas Inspiration
This is a area stacked ppt powerpoint presentation ideas inspiration. This is a two stage process. The stages in this process are finance, marketing, management, investment, analysis.

Clustered Bar Ppt PowerPoint Presentation Summary Infographic Template
This is a clustered bar ppt powerpoint presentation summary infographic template. This is a three stage process. The stages in this process are finance, marketing, management, investment, analysis.

Stacked Column Ppt PowerPoint Presentation Visual Aids Backgrounds
This is a stacked column ppt powerpoint presentation visual aids backgrounds. This is a two stage process. The stages in this process are finance, marketing, management, investment, analysis.
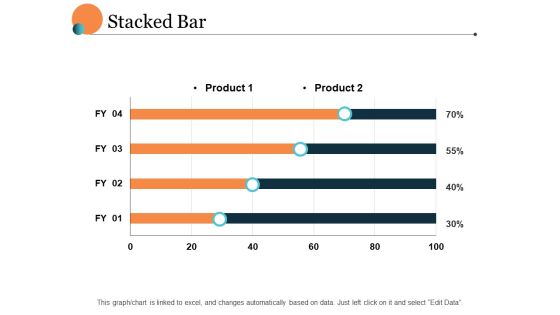
Stacked Bar Ppt PowerPoint Presentation Layouts
This is a stacked bar ppt powerpoint presentation layouts. This is a two stage process. The stages in this process are finance, marketing, management, investment, analysis.
Stacked Area-Clustered Column Ppt PowerPoint Presentation Icon Professional
This is a stacked area-clustered column ppt powerpoint presentation icon professional. This is a three stage process. The stages in this process are finance, marketing, management, investment, analysis.

Results Ppt PowerPoint Presentation Styles Background Images
This is a results ppt powerpoint presentation styles background images. This is a four stage process. The stages in this process are finance, marketing, management, investment, analysis.

Stacked Area Clustered Column Ppt PowerPoint Presentation Inspiration
This is a stacked area clustered column ppt powerpoint presentation inspiration. This is a three stage process. The stages in this process are finance, marketing, analysis, business, investment.

Transformation Obstacles Ppt PowerPoint Presentation Summary Microsoft
This is a transformation obstacles ppt powerpoint presentation summary microsoft. This is a five stage process. The stages in this process are finance, analysis, business, investment, marketing.
Performance Dashboard Management Ppt PowerPoint Presentation Icon Themes
This is a performance dashboard management ppt powerpoint presentation icon themes. This is a four stage process. The stages in this process are finance, marketing, analysis, business, investment.
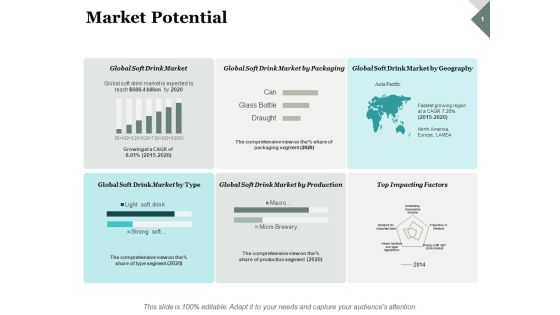
Market Potential Ppt PowerPoint Presentation File Shapes
This is a market potential ppt powerpoint presentation file shapes. This is a six stage process. The stages in this process are finance, analysis, business, investment, marketing.

Performance Dashboard Marketing Ppt PowerPoint Presentation Show Microsoft
This is a performance dashboard marketing ppt powerpoint presentation show microsoft. This is a four stage process. The stages in this process are finance, marketing, analysis, business, investment.

Performance Dashboard Ppt PowerPoint Presentation Model Graphics Example
This is a performance dashboard ppt powerpoint presentation model graphics example. This is a four stage process. The stages in this process are finance, marketing, analysis, business, investment.
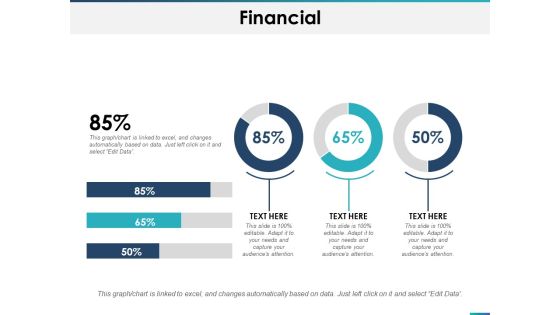
Financial Marketing Ppt PowerPoint Presentation Professional Diagrams
This is a financial marketing ppt powerpoint presentation professional diagrams. This is a three stage process. The stages in this process are finance, marketing, analysis, business, investment.

Comparison Marketing Ppt PowerPoint Presentation Gallery Graphic Tips
This is a comparison marketing ppt powerpoint presentation gallery graphic tips. This is a three stage process. The stages in this process are finance, analysis, business, investment, marketing.

Clustered Column Line Marketing Ppt PowerPoint Presentation Ideas
This is a clustered column line marketing ppt powerpoint presentation ideas. This is a three stage process. The stages in this process are finance, analysis, business, investment, marketing.

Competitor Positioning Ppt Powerpoint Presentation Pictures Gridlines
This is a competitor positioning ppt powerpoint presentation pictures gridlines. This is a two stage process. The stages in this process are finance, marketing, management, investment, analysis.

Stacked Bar Product Ppt PowerPoint Presentation Pictures Layout
This is a stacked bar product ppt powerpoint presentation pictures layout. This is a two stage process. The stages in this process are finance, marketing, management, investment, analysis.
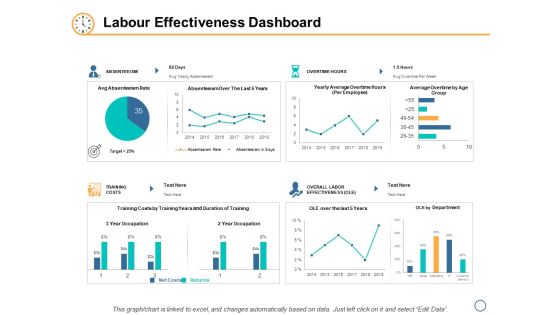
Labour Effectiveness Dashboard Ppt PowerPoint Presentation Inspiration Deck
This is a labour effectiveness dashboard ppt powerpoint presentation inspiration deck. This is a four stage process. The stages in this process are finance, analysis, business, investment, marketing.
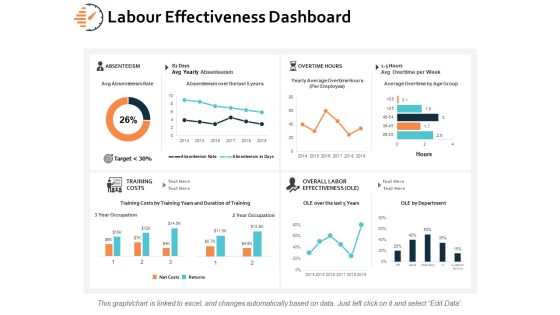
Labour Effectiveness Dashboard Ppt PowerPoint Presentation Model Objects
This is a labour effectiveness dashboard ppt powerpoint presentation model objects. This is a eight stage process. The stages in this process are finance, analysis, business, investment, marketing.
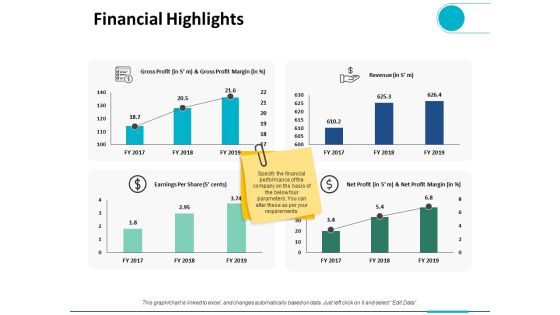
Financial Highlights Ppt PowerPoint Presentation Infographics Slide Portrait
This is a financial highlights ppt powerpoint presentation infographics slide portrait. This is a four stage process. The stages in this process are finance, analysis, business, investment, marketing.

Portfolio Summary Management Dashboard Ppt PowerPoint Presentation Pictures Visuals
This is a portfolio summary management dashboard ppt powerpoint presentation pictures visuals. This is a six stage process. The stages in this process are finance, marketing, management, investment.
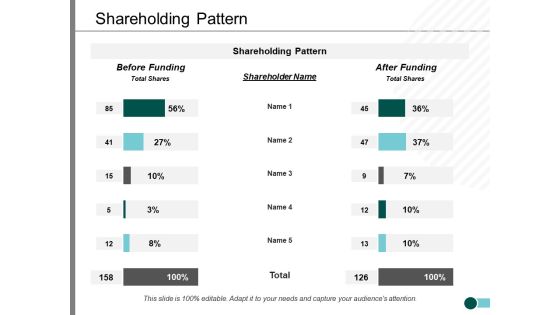
Shareholding Pattern Ppt PowerPoint Presentation Inspiration Background
This is a shareholding pattern ppt powerpoint presentation inspiration background. This is a three stage process. The stages in this process are finance, marketing, management, investment, analysis.
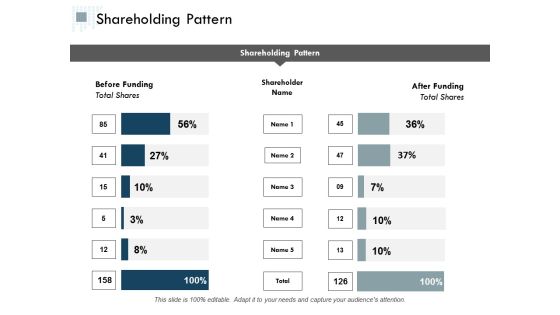
Shareholding Pattern Ppt PowerPoint Presentation Styles Background Images
This is a shareholding pattern ppt powerpoint presentation styles background images. This is a two stage process. The stages in this process are finance, analysis, business, investment, marketing.
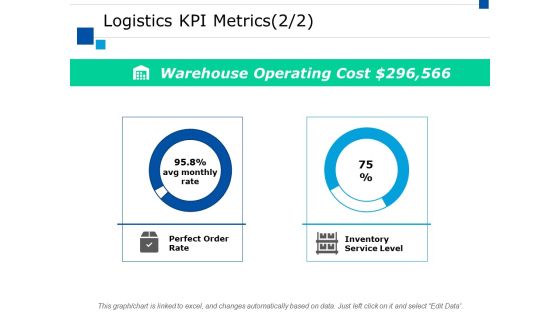
Logistics Kpi Metrics Ppt PowerPoint Presentation Inspiration Gridlines
This is a logistics kpi metrics ppt powerpoint presentation inspiration gridlines. This is a two stage process. The stages in this process are finance, marketing, management, investment, analysis.

Quality Management Dashboard Ppt PowerPoint Presentation File Diagrams
This is a quality management dashboard ppt powerpoint presentation file diagrams. This is a four stage process. The stages in this process are finance, marketing, management, investment, analysis.
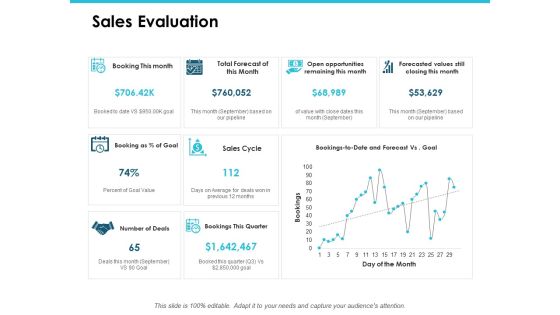
Sales Evaluation Ppt PowerPoint Presentation Infographics Infographic Template
This is a sales evaluation ppt powerpoint presentation infographics infographic template. This is a eight stage process. The stages in this process are finance, marketing, management, investment, analysis.

Data Lineage Implementation Case Study Commercial Bank Pictures PDF
This slide outlines the data lineage case study carried out in a commercial bank that provides banking services in sixty states and wanted an information flow visualization for operational intelligence, development of uniformity with business vocabulary, and so on. Do you have to make sure that everyone on your team knows about any specific topic I yes, then you should give Data Lineage Implementation Case Study Commercial Bank Pictures PDF a try. Our experts have put a lot of knowledge and effort into creating this impeccable Data Lineage Implementation Case Study Commercial Bank Pictures PDF. You can use this template for your upcoming presentations, as the slides are perfect to represent even the tiniest detail. You can download these templates from the Slidegeeks website and these are easy to edit. So grab these today.

Website Performance Analytics Ppt PowerPoint Presentation Show
This is a website performance analytics ppt powerpoint presentation show. This is a three stage process. The stages in this process are conversion rate, visits, average visit value goal, return on investment ric, total visits, cost.
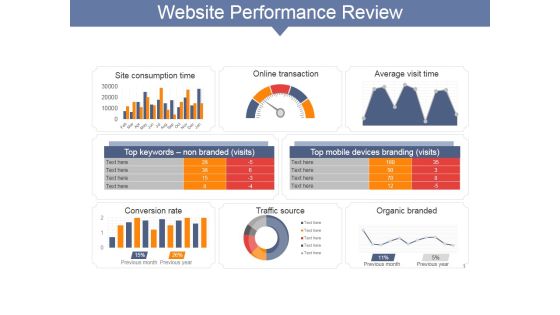
Website Performance Review Ppt PowerPoint Presentation File Visuals
This is a website performance review ppt powerpoint presentation file visuals. This is a eight stage process. The stages in this process are top converting goals, average visit value goal, cost, conversion rate, return on investment, visits .

Data Collection Techniques For Client Case Study Observations Ppt PowerPoint Presentation Ideas Demonstration
Presenting this set of slides with name data collection techniques for client case study observations ppt powerpoint presentation ideas demonstration. This is a six stage process. The stages in this process are finance, marketing, management, investment, analysis. This is a completely editable PowerPoint presentation and is available for immediate download. Download now and impress your audience.

Marketers Guide To Data Analysis Optimization Analyzing Organic Click Through Rates For Better Conversions Structure PDF
This slide covers an overview of click-through rate KPI to identify the percentage of visitors who click on your page after their search triggers an impression. It also includes optimizing strategies, using descriptive URLs, localizing content, and adding structured data. Find highly impressive Marketers Guide To Data Analysis Optimization Analyzing Organic Click Through Rates For Better Conversions Structure PDF on Slidegeeks to deliver a meaningful presentation. You can save an ample amount of time using these presentation templates. No need to worry to prepare everything from scratch because Slidegeeks experts have already done a huge research and work for you. You need to download Marketers Guide To Data Analysis Optimization Analyzing Organic Click Through Rates For Better Conversions Structure PDF for your upcoming presentation. All the presentation templates are 100 percent editable and you can change the color and personalize the content accordingly. Download now.

Corporate Profile IT Organization Companys Cash Flow From Three Activities Sample PDF
The slide provides the cash flows from the operating, investing and financing activities of the company, along with the basic details. Deliver an awe inspiring pitch with this creative corporate profile it organization companys cash flow from three activities sample pdf bundle. Topics like operating, investing, financing can be discussed with this completely editable template. It is available for immediate download depending on the needs and requirements of the user.

Designing And Deployment CRM Software Efficiency Indicators Portrait PDF
The mentioned slide highlights the efficiency indicators related to investment in CRM software by different industries such as services, finance, IT and education. Deliver an awe inspiring pitch with this creative designing and deployment crm software efficiency indicators portrait pdf bundle. Topics like industries investing in crm 2021, finance, services, education, manufacturing, it can be discussed with this completely editable template. It is available for immediate download depending on the needs and requirements of the user.
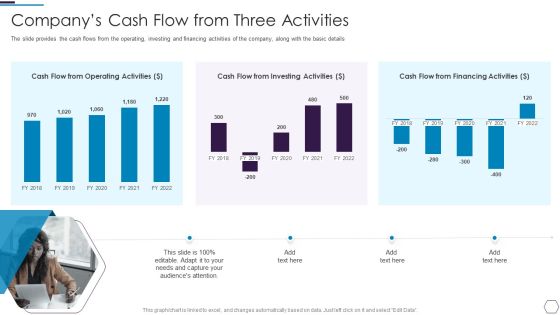
Information Technology Firm Report Example Companys Cash Flow From Three Activities Structure PDF
The slide provides the cash flows from the operating, investing and financing activities of the company, along with the basic details Deliver an awe inspiring pitch with this creative Information Technology Firm Report Example Companys Cash Flow From Three Activities Structure PDF bundle. Topics like Operating Activities, Investing Activities, Financing Activities can be discussed with this completely editable template. It is available for immediate download depending on the needs and requirements of the user.


 Continue with Email
 Sign up for an account
 Home
Home