Budget Planning
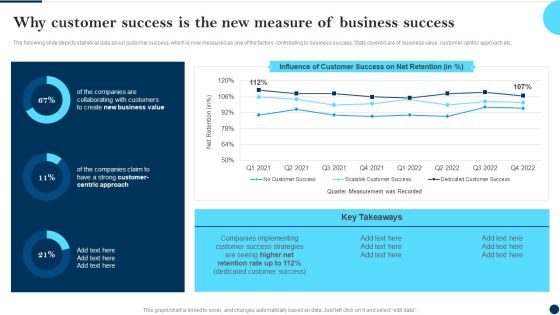
Why Customer Success Is The New Measure Of Business Success Client Success Best Practices Guide Themes PDF
The following slide depicts statistical data about customer success, which is now measured as one of the factors contributing to business success. Stats covered are of business value, customer centric approach etc.Find highly impressive Why Customer Success Is The New Measure Of Business Success Client Success Best Practices Guide Themes PDF on Slidegeeks to deliver a meaningful presentation. You can save an ample amount of time using these presentation templates. No need to worry to prepare everything from scratch because Slidegeeks experts have already done a huge research and work for you. You need to download Why Customer Success Is The New Measure Of Business Success Client Success Best Practices Guide Themes PDF for your upcoming presentation. All the presentation templates are 100 precent editable and you can change the color and personalize the content accordingly. Download now.

Guide For Effective Brand Brand Asset Valuator Power Grid To Assess Overall Health Elements PDF
This slide provides information regarding brand asset valuator power grid to analyze overall brand health. It caters details about new, unfocused, eroding, power, declining or niche brands. There are so many reasons you need a Guide For Effective Brand Brand Asset Valuator Power Grid To Assess Overall Health Elements PDF. The first reason is you cant spend time making everything from scratch, Thus, Slidegeeks has made presentation templates for you too. You can easily download these templates from our website easily.
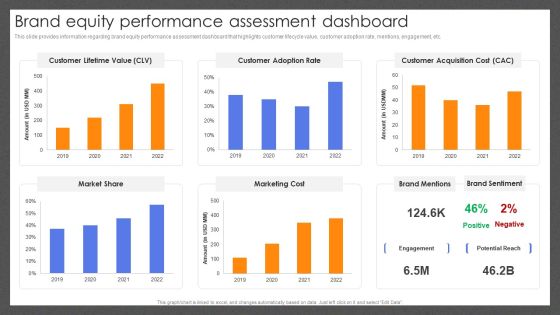
Guide For Effective Brand Brand Equity Performance Assessment Dashboard Diagrams PDF
This slide provides information regarding brand equity performance assessment dashboard that highlights customer lifecycle value, customer adoption rate, mentions, engagement, etc. Present like a pro with Guide For Effective Brand Brand Equity Performance Assessment Dashboard Diagrams PDF Create beautiful presentations together with your team, using our easy-to-use presentation slides. Share your ideas in real-time and make changes on the fly by downloading our templates. So whether youre in the office, on the go, or in a remote location, you can stay in sync with your team and present your ideas with confidence. With Slidegeeks presentation got a whole lot easier. Grab these presentations today.
Guide For Effective Brand Customer Tracking Dashboard To Monitor Brand Loyalty Sample PDF
This slide provides information brand loyalty tracking dashboard in order to monitor customer engagement, average revenues, new vs. returning visitors performance, etc. This modern and well-arranged Guide For Effective Brand Customer Tracking Dashboard To Monitor Brand Loyalty Sample PDF provides lots of creative possibilities. It is very simple to customize and edit with the Powerpoint Software. Just drag and drop your pictures into the shapes. All facets of this template can be edited with Powerpoint, no extra software is necessary. Add your own material, put your images in the places assigned for them, adjust the colors, and then you can show your slides to the world, with an animated slide included.

Guide For Effective Brand Performance Monitoring Dashboard To Track Brand Progress Ideas PDF
This slide provides information regarding monitoring dashboard to track brand performance through monitoring of session, new users, bounce rate, etc. Want to ace your presentation in front of a live audience Our Guide For Effective Brand Performance Monitoring Dashboard To Track Brand Progress Ideas PDF can help you do that by engaging all the users towards you. Slidegeeks experts have put their efforts and expertise into creating these impeccable powerpoint presentations so that you can communicate your ideas clearly. Moreover, all the templates are customizable, and easy-to-edit and downloadable. Use these for both personal and commercial use.
Guide For Effective Brand Rebranding Performance Tracking Dashboard To Track Microsoft PDF
This slide provides information regarding rebranding performance tracking dashboard in order to track renewed brand. It includes details about total spent, total link clicks, total conversations, etc. From laying roadmaps to briefing everything in detail, our templates are perfect for you. You can set the stage with your presentation slides. All you have to do is download these easy-to-edit and customizable templates. Guide For Effective Brand Rebranding Performance Tracking Dashboard To Track Microsoft PDF will help you deliver an outstanding performance that everyone would remember and praise you for. Do download this presentation today.

2018 To 2021 Sales Performance Clustered Bar Graph Graphics PDF
Showcasing this set of slides titled 2018 To 2021 Sales Performance Clustered Bar Graph Graphics PDF. The topics addressed in these templates are Range Of Profits, Increase In Production, Profits Are Stagnant. All the content presented in this PPT design is completely editable. Download it and make adjustments in color, background, font etc. as per your unique business setting.
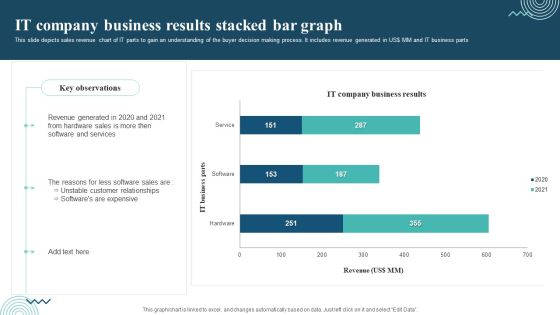
IT Company Business Results Stacked Bar Graph Topics PDF
Showcasing this set of slides titled IT Company Business Results Stacked Bar Graph Topics PDF. The topics addressed in these templates are Revenue Generated, Software And Services, Unstable Customer Relationships. All the content presented in this PPT design is completely editable. Download it and make adjustments in color, background, font etc. As per your unique business setting.
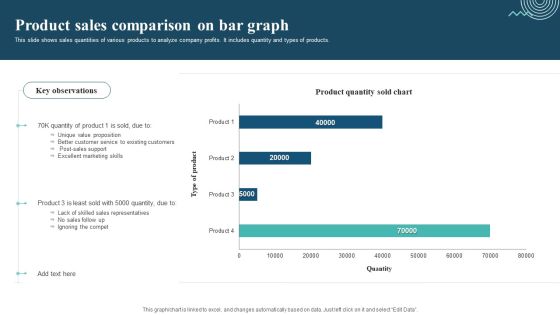
Product Sales Comparison On Bar Graph Sample PDF
This slide shows sales quantities of various products to analyze company profits. It includes quantity and types of products. Pitch your topic with ease and precision using this Product Sales Comparison On Bar Graph Sample PDF. This layout presents information on Unique Value Proposition, Excellent Marketing Skills, Ignoring The Compet. It is also available for immediate download and adjustment. So, changes can be made in the color, design, graphics or any other component to create a unique layout.
Profits And Discounts On Products Clustered Bar Graph Icons PDF
Showcasing this set of slides titled Profits And Discounts On Products Clustered Bar Graph Icons PDF. The topics addressed in these templates are Profits And Discounts, Less Discounts, Market Penetration. All the content presented in this PPT design is completely editable. Download it and make adjustments in color, background, font etc. as per your unique business setting.
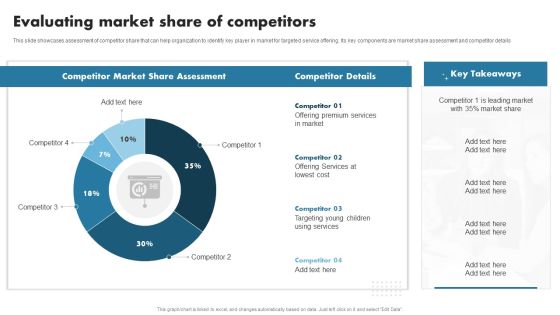
Enhancing Customer Outreach Evaluating Market Share Of Competitors Pictures PDF
This slide showcases assessment of competitor share that can help organization to identify key player in market for targeted service offering. Its key components are market share assessment and competitor details. Want to ace your presentation in front of a live audience Our Enhancing Customer Outreach Evaluating Market Share Of Competitors Pictures PDF can help you do that by engaging all the users towards you. Slidegeeks experts have put their efforts and expertise into creating these impeccable powerpoint presentations so that you can communicate your ideas clearly. Moreover, all the templates are customizable, and easy-to-edit and downloadable. Use these for both personal and commercial use.
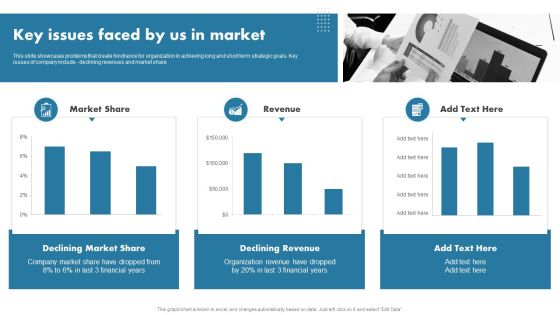
Enhancing Customer Outreach Key Issues Faced By Us In Market Portrait PDF
This slide showcases problems that create hindrance for organization in achieving long and short term strategic goals. Key issues of company include - declining revenues and market share. Present like a pro with Enhancing Customer Outreach Key Issues Faced By Us In Market Portrait PDF Create beautiful presentations together with your team, using our easy-to-use presentation slides. Share your ideas in real-time and make changes on the fly by downloading our templates. So whether youre in the office, on the go, or in a remote location, you can stay in sync with your team and present your ideas with confidence. With Slidegeeks presentation got a whole lot easier. Grab these presentations today.
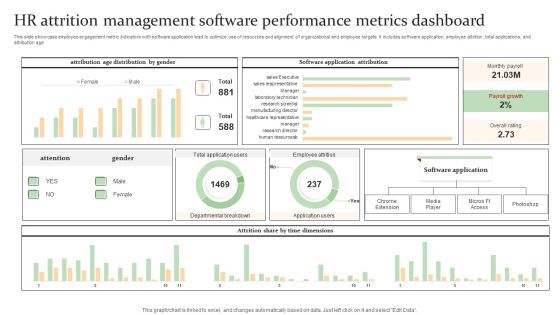
HR Attrition Management Software Performance Metrics Dashboard Sample PDF
Showcasing this set of slides titled Attrition Management, Software Performance, Metrics Dashboard. The topics addressed in these templates are Attrition Management, Software Performance, Metrics Dashboard. All the content presented in this PPT design is completely editable. Download it and make adjustments in color, background, font etc. as per your unique business setting.
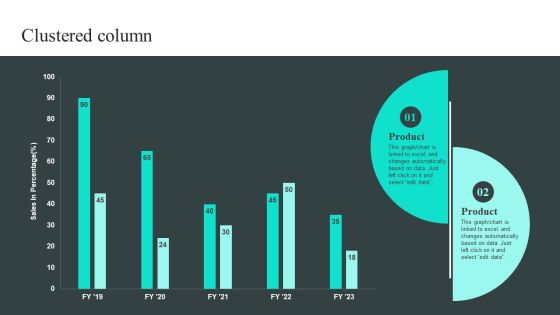
Efficient Administration Of Product Business And Umbrella Branding Clustered Column Clipart PDF
Are you in need of a template that can accommodate all of your creative concepts This one is crafted professionally and can be altered to fit any style. Use it with Google Slides or PowerPoint. Include striking photographs, symbols, depictions, and other visuals. Fill, move around, or remove text boxes as desired. Test out color palettes and font mixtures. Edit and save your work, or work with colleagues. Download Efficient Administration Of Product Business And Umbrella Branding Clustered Column Clipart PDF and observe how to make your presentation outstanding. Give an impeccable presentation to your group and make your presentation unforgettable.
Efficient Administration Of Product Business And Umbrella Branding Corporate Branding Performance Tracking Dashboard Elements PDF
This slide provides information regarding corporate branding performance tracking dashboard in terms of leads, conversion metrics, web traffic, etc. Crafting an eye catching presentation has never been more straightforward. Let your presentation shine with this tasteful yet straightforward Efficient Administration Of Product Business And Umbrella Branding Corporate Branding Performance Tracking Dashboard Elements PDF template. It offers a minimalistic and classy look that is great for making a statement. The colors have been employed intelligently to add a bit of playfulness while still remaining professional. Construct the ideal Efficient Administration Of Product Business And Umbrella Branding Corporate Branding Performance Tracking Dashboard Elements PDF that effortlessly grabs the attention of your audience Begin now and be certain to wow your customers.

KPI Dashboard To Analyze Performance Of Healthcare Financial Department Summary PDF
The following slide showcases key performance indicator KPI dashboard which can be used to analyze the financial performance of hospital. The metrics covered in the slide are net profit margin, income and expenses, etc. Do you have an important presentation coming up Are you looking for something that will make your presentation stand out from the rest Look no further than KPI Dashboard To Analyze Performance Of Healthcare Financial Department Summary PDF. With our professional designs, you can trust that your presentation will pop and make delivering it a smooth process. And with Slidegeeks, you can trust that your presentation will be unique and memorable. So why wait Grab KPI Dashboard To Analyze Performance Of Healthcare Financial Department Summary PDF today and make your presentation stand out from the rest.
Essential Retail Store Activities Tracking Dashboard Customer Engagement Administration Infographics PDF
This slide provides details regarding the dashboard for tracking retail store activities in terms of sales, conversion rate, traffic, average transaction value, recommendations, etc. This modern and well-arranged Essential Retail Store Activities Tracking Dashboard Customer Engagement Administration Infographics PDF provides lots of creative possibilities. It is very simple to customize and edit with the Powerpoint Software. Just drag and drop your pictures into the shapes. All facets of this template can be edited with Powerpoint no extra software is necessary. Add your own material, put your images in the places assigned for them, adjust the colors, and then you can show your slides to the world, with an animated slide included.
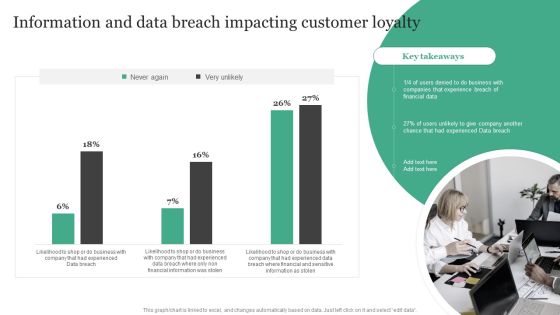
Information And Data Breach Impacting Customer Loyalty Information Security Risk Administration Demonstration PDF
Crafting an eye-catching presentation has never been more straightforward. Let your presentation shine with this tasteful yet straightforward Information And Data Breach Impacting Customer Loyalty Information Security Risk Administration Demonstration PDF template. It offers a minimalistic and classy look that is great for making a statement. The colors have been employed intelligently to add a bit of playfulness while still remaining professional. Construct the ideal Information And Data Breach Impacting Customer Loyalty Information Security Risk Administration Demonstration PDF that effortlessly grabs the attention of your audience Begin now and be certain to wow your customers.

Rising Number Of Information Security Attacks Information Security Risk Administration Information PDF
This slide showcases number of cybersecurity attacks faced by organizations in past financial years. It includes - malware, dos attack, phishing and SQL injection.Find a pre-designed and impeccable Rising Number Of Information Security Attacks Information Security Risk Administration Information PDF. The templates can ace your presentation without additional effort. You can download these easy-to-edit presentation templates to make your presentation stand out from others. So, what are you waiting for Download the template from Slidegeeks today and give a unique touch to your presentation.

Assessing International Market Joint Venture Performance Of Organizations Elements PDF
This slide showcases performance of organization after expanding business globally through joint venture. It can help business to evaluate the success rate of global expansion through joint venture. From laying roadmaps to briefing everything in detail, our templates are perfect for you. You can set the stage with your presentation slides. All you have to do is download these easy-to-edit and customizable templates. Assessing International Market Joint Venture Performance Of Organizations Elements PDF will help you deliver an outstanding performance that everyone would remember and praise you for. Do download this presentation today.

Assessing International Market Dashboard To Analyse Sales Post Global Expansion Elements PDF
This slide showcase dashboard that can help organization track sales after global expansion. Its key components are sales target, target achievement, sales by channel, inventory days outstanding, sales growth, gross profit, gross profit margin etc. Are you in need of a template that can accommodate all of your creative concepts This one is crafted professionally and can be altered to fit any style. Use it with Google Slides or PowerPoint. Include striking photographs, symbols, depictions, and other visuals. Fill, move around, or remove text boxes as desired. Test out color palettes and font mixtures. Edit and save your work, or work with colleagues. Download Assessing International Market Dashboard To Analyse Sales Post Global Expansion Elements PDF and observe how to make your presentation outstanding. Give an impeccable presentation to your group and make your presentation unforgettable.

Assessing International Market Evaluating Growth Rate Of Target Market Professional PDF
This slide showcases graph that can help organization to evaluate growth rate of target market. It can help company to identify potential and suitability of target market for expanding operations globally. This Assessing International Market Evaluating Growth Rate Of Target Market Professional PDF is perfect for any presentation, be it in front of clients or colleagues. It is a versatile and stylish solution for organizing your meetings. The Assessing International Market Evaluating Growth Rate Of Target Market Professional PDF features a modern design for your presentation meetings. The adjustable and customizable slides provide unlimited possibilities for acing up your presentation. Slidegeeks has done all the homework before launching the product for you. So, dont wait, grab the presentation templates today.

Assessing International Market Reasons Of Failure In Strategic Alliance Partnership Structure PDF
This slide showcases reasons for strategic alliance partnership failure. It includes trust in alliance relationship, lack of common vision, inequality in commercial returns, cultural misalignment and lack of suitable governance model. There are so many reasons you need a Assessing International Market Reasons Of Failure In Strategic Alliance Partnership Structure PDF. The first reason is you cant spend time making everything from scratch, Thus, Slidegeeks has made presentation templates for you too. You can easily download these templates from our website easily.
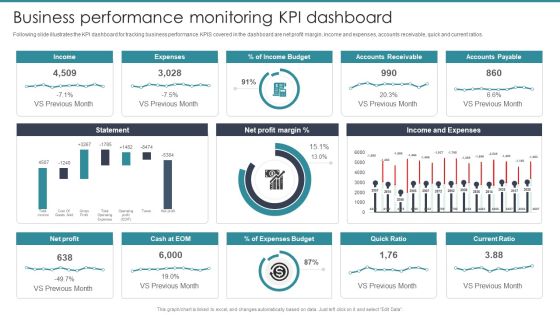
Guide To Mergers And Acquisitions Business Performance Monitoring KPI Dashboard Designs PDF
Following slide illustrates the KPI dashboard for tracking business performance. KPIS covered in the dashboard are net profit margin, income and expenses, accounts receivable, quick and current ratios. Here you can discover an assortment of the finest PowerPoint and Google Slides templates. With these templates, you can create presentations for a variety of purposes while simultaneously providing your audience with an eye catching visual experience. Download Guide To Mergers And Acquisitions Business Performance Monitoring KPI Dashboard Designs PDF to deliver an impeccable presentation. These templates will make your job of preparing presentations much quicker, yet still, maintain a high level of quality. Slidegeeks has experienced researchers who prepare these templates and write high quality content for you. Later on, you can personalize the content by editing the Guide To Mergers And Acquisitions Business Performance Monitoring KPI Dashboard Designs PDF.
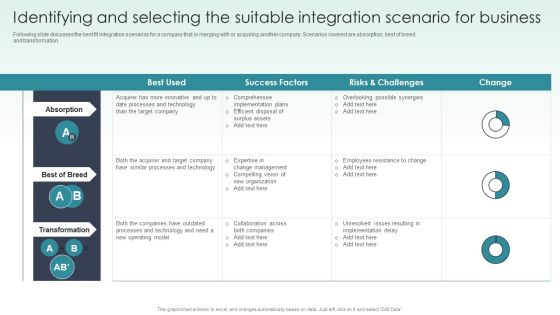
Guide To Mergers And Acquisitions Identifying And Selecting The Suitable Integration Scenario For Business Ideas PDF
Following slide discusses the best fit integration scenarios for a company that is merging with or acquiring another company. Scenarios covered are absorption, best of breed and transformation. This Guide To Mergers And Acquisitions Identifying And Selecting The Suitable Integration Scenario For Business Ideas PDF from Slidegeeks makes it easy to present information on your topic with precision. It provides customization options, so you can make changes to the colors, design, graphics, or any other component to create a unique layout. It is also available for immediate download, so you can begin using it right away. Slidegeeks has done good research to ensure that you have everything you need to make your presentation stand out. Make a name out there for a brilliant performance.

Staff Awareness Playbook Addressing Workforce Required Training Across Different Departments Formats PDF
This slide provides information regarding key people requiring training across different departments. Presenting this PowerPoint presentation, titled Staff Awareness Playbook Addressing Workforce Required Training Across Different Departments Formats PDF, with topics curated by our researchers after extensive research. This editable presentation is available for immediate download and provides attractive features when used. Download now and captivate your audience. Presenting this Staff Awareness Playbook Addressing Workforce Required Training Across Different Departments Formats PDF. Our researchers have carefully researched and created these slides with all aspects taken into consideration. This is a completely customizable Staff Awareness Playbook Addressing Workforce Required Training Across Different Departments Formats PDF that is available for immediate downloading. Download now and make an impact on your audience. Highlight the attractive features available with our PPTs.

Company Brand Value Over Time AI For Brand Administration Pictures PDF
This graph shows the current situation of our company, where it lies according to other brands. This leads to implementing AI in the organization.Want to ace your presentation in front of a live audience Our Company Brand Value Over Time AI For Brand Administration Pictures PDF can help you do that by engaging all the users towards you.. Slidegeeks experts have put their efforts and expertise into creating these impeccable powerpoint presentations so that you can communicate your ideas clearly. Moreover, all the templates are customizable, and easy-to-edit and downloadable. Use these for both personal and commercial use.

Crisis Management Using AI Tool AI For Brand Administration Clipart PDF
This slide covers the crisis management tool used to identify potential issues from social media conversations in real time and helps to safeguard the brand by auto alerts.Do you have to make sure that everyone on your team knows about any specific topic I yes, then you should give Crisis Management Using AI Tool AI For Brand Administration Clipart PDF a try. Our experts have put a lot of knowledge and effort into creating this impeccable Crisis Management Using AI Tool AI For Brand Administration Clipart PDF. You can use this template for your upcoming presentations, as the slides are perfect to represent even the tiniest detail. You can download these templates from the Slidegeeks website and these are easy to edit. So grab these today.

Current Challenges Faced By Our Company AI For Brand Administration Sample PDF
This slide describes the current challenges faced by our company such as difficult existing processes and systems, expensive technologies, less expert availability, etc. which further leads to the needs of artificial intelligence.Get a simple yet stunning designed Current Challenges Faced By Our Company AI For Brand Administration Sample PDF. It is the best one to establish the tone in your meetings. It is an excellent way to make your presentations highly effective. So, download this PPT today from Slidegeeks and see the positive impacts. Our easy-to-edit Current Challenges Faced By Our Company AI For Brand Administration Sample PDF can be your go-to option for all upcoming conferences and meetings. So, what are you waiting for Grab this template today.
Digital Media Tracking Dashboard AI For Brand Administration Template PDF
This slide covers the digital marketing dashboard along with the lead breakdown, google analytics traffic, and social media channels.From laying roadmaps to briefing everything in detail, our templates are perfect for you. You can set the stage with your presentation slides. All you have to do is download these easy-to-edit and customizable templates. Digital Media Tracking Dashboard AI For Brand Administration Template PDF will help you deliver an outstanding performance that everyone would remember and praise you for. Do download this presentation today.
Tracking Mobile Device Activities At Workplace Business Mobile Device Security Management Icons PDF
This slide covers information regarding the tracking mobile device activities at workplace with details about MDM managed mobile summary, MDM users, vulnerabilities and severity summary. Are you in need of a template that can accommodate all of your creative concepts This one is crafted professionally and can be altered to fit any style. Use it with Google Slides or PowerPoint. Include striking photographs, symbols, depictions, and other visuals. Fill, move around, or remove text boxes as desired. Test out color palettes and font mixtures. Edit and save your work, or work with colleagues. Download Tracking Mobile Device Activities At Workplace Business Mobile Device Security Management Icons PDF and observe how to make your presentation outstanding. Give an impeccable presentation to your group and make your presentation unforgettable.
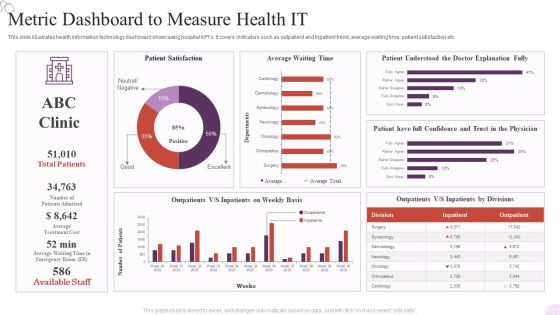
Metric Dashboard To Measure Health IT Background PDF
Pitch your topic with ease and precision using this Metric Dashboard To Measure Health IT Background PDF. This layout presents information on Metric Dashboard, Patient Satisfaction, Average Waiting Time. It is also available for immediate download and adjustment. So, changes can be made in the color, design, graphics or any other component to create a unique layout.

Dashboard For Tracking Organizational OGSM Model Metrics Microsoft PDF
Pitch your topic with ease and precision using this Dashboard For Tracking Organizational OGSM Model Metrics Microsoft PDF. This layout presents information on Revenue, Market Share, Gross Margin. It is also available for immediate download and adjustment. So, changes can be made in the color, design, graphics or any other component to create a unique layout.

Challenges For Blockchain Technology In Supply Chain Management Demonstration PDF
This slide represents a graph showing the challenges faced by blockchain in areas of supply chain that are visibility, risk allocation, sourcing, fluctuating consumer demand, keeping pace with technology manufacturing, inventory and data management. Showcasing this set of slides titled Challenges For Blockchain Technology In Supply Chain Management Demonstration PDF. The topics addressed in these templates are Inventory Management Challenges, Supply Chain Complexity. All the content presented in this PPT design is completely editable. Download it and make adjustments in color, background, font etc. as per your unique business setting.

Communication Channels Used By Client And Business Enterprises Guidelines PDF
This slide shows statistical data of communication between company and consumer. It includes email, phone, in person, social media, online forms, knowledge base, portals, text, live support, mobile app, discussion forums and voice activated personal assistants. Pitch your topic with ease and precision using this Communication Channels Used By Client And Business Enterprises Guidelines PDF. This layout presents information on Service, Communication, Customer. It is also available for immediate download and adjustment. So, changes can be made in the color, design, graphics or any other component to create a unique layout.

Average Business Sale Operating Cycle Length Ideas PDF
This slide showcase sales cycle length for maximum fluency an efficiency shorter the sale length enables bottom line boosting sales revenue graph.Showcasing this set of slides titled Average Business Sale Operating Cycle Length Ideas PDF. The topics addressed in these templates are Average Sales, Opportunities Identification, Negotiation Business. All the content presented in this PPT design is completely editable. Download it and make adjustments in color, background, font etc. as per your unique business setting.
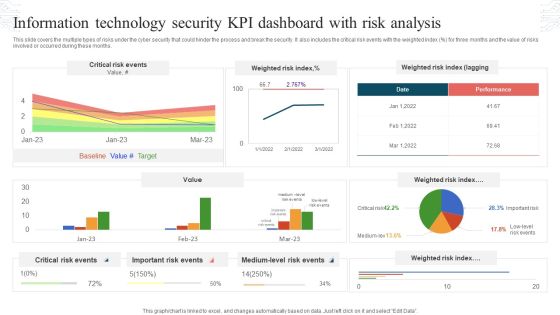
Information Technology Security KPI Dashboard With Risk Analysis Topics PDF
This slide covers the multiple types of risks under the cyber security that could hinder the process and break the security. It also includes the critical risk events with the weighted index percent for three months and the value of risks involved or occurred during these months. Showcasing this set of slides titled Information Technology Security KPI Dashboard With Risk Analysis Topics PDF. The topics addressed in these templates are Critical Risk Events, Weighted Risk Index, Important Risk Events. All the content presented in this PPT design is completely editable. Download it and make adjustments in color, background, font etc. as per your unique business setting.

Information Technology Security Team Analytics Dashboard With KPI Themes PDF
This slide elaborates about the number of incidents that have taken place in cyber security and the malware types with per incident. It also includes the number of open and resolved ticked. Showcasing this set of slides titled Information Technology Security Team Analytics Dashboard With KPI Themes PDF. The topics addressed in these templates are Open Incidents, Resolved Incidents, Open Tickets, Resolved Tickets. All the content presented in this PPT design is completely editable. Download it and make adjustments in color, background, font etc. as per your unique business setting.

Bar Graph Representing Risk Assessment Variant On Basis Of Impact Level Topics PDF
This slide shows the graphical representation of risk scenario on the basis of impact category score and degree of severity which includes impacted categories such as people, economy, environment, territorial security, business reputation, etc. Showcasing this set of slides titled Bar Graph Representing Risk Assessment Variant On Basis Of Impact Level Topics PDF. The topics addressed in these templates are Measuring Metrics, Organization, Greater Impact. All the content presented in this PPT design is completely editable. Download it and make adjustments in color, background, font etc. as per your unique business setting.

Information Technology Operations Operations Dashboard For Issues Management Infographics PDF
The slide illustrates various KPIs to manage and track IT operations in business. Various elements included in the dashboard are month-wise issue status, types of issues, average resolution time, overall status and resolved issues. Showcasing this set of slides titled Information Technology Operations Operations Dashboard For Issues Management Infographics PDF. The topics addressed in these templates are Information Technology Operations, Operations Dashboard, Issues Management. All the content presented in this PPT design is completely editable. Download it and make adjustments in color, background, font etc. as per your unique business setting.

ESO System Incident Management KPI Dashboard Ppt PowerPoint Presentation File Graphic Images PDF
This slide covers enterprise security operation incident management kpi dashboard. It involves details such as average resolution time, new incidents, incident status and new incidents by category. Pitch your topic with ease and precision using this ESO System Incident Management KPI Dashboard Ppt PowerPoint Presentation File Graphic Images PDF. This layout presents information on Average Resolution Time, Incident Status, New Incidents. It is also available for immediate download and adjustment. So, changes can be made in the color, design, graphics or any other component to create a unique layout.

Capital Raised With Initial Public Offering Download PDF
This slide showcase evolution of number of IPOs and capital raised . It include breakdown, north America leads and exchange growth rate. Showcasing this set of slides titled Capital Raised With Initial Public Offering Download PDF. The topics addressed in these templates are Capital Raised, With Initial, Public Offering. All the content presented in this PPT design is completely editable. Download it and make adjustments in color, background, font etc. as per your unique business setting.

Digital Twin Tech IT Dashboard For Our Successful Digital Twin Model Microsoft PDF
This slide represents the digital twin technology dashboard that covers the details of the city, such as the status of CCTVs, buses, street lights, environment sensors, and so on. Do you have an important presentation coming up Are you looking for something that will make your presentation stand out from the rest Look no further than Digital Twin Tech IT Dashboard For Our Successful Digital Twin Model Microsoft PDF. With our professional designs, you can trust that your presentation will pop and make delivering it a smooth process. And with Slidegeeks, you can trust that your presentation will be unique and memorable. So why wait Grab Digital Twin Tech IT Dashboard For Our Successful Digital Twin Model Microsoft PDF today and make your presentation stand out from the rest.
Employees Attrition Tracking Rate Stats Summary Report By Departments Slides PDF
This slide illustrates employees quarterly turnover rates for different departments. It also includes turnover rates on the basis of distinct positions and duration of retention in company. Showcasing this set of slides titled Employees Attrition Tracking Rate Stats Summary Report By Departments Slides PDF. The topics addressed in these templates are Employee Turnover, Involuntary. All the content presented in this PPT design is completely editable. Download it and make adjustments in color, background, font etc. as per your unique business setting.
Employees Attrition Tracking Statistics And Resignation Rate Report By Industry Background PDF
This slide covers dashboard for industry wise employees turnover rates. It further includes statistics on resignation rare of workers, average turnover rates for different industries. Pitch your topic with ease and precision using this Employees Attrition Tracking Statistics And Resignation Rate Report By Industry Background PDF. This layout presents information on Employees, Industry, Average Turnover Rate. It is also available for immediate download and adjustment. So, changes can be made in the color, design, graphics or any other component to create a unique layout.
HR Manager KPI Dashboard With Employee Attrition Tracking Report Brochure PDF
This slide covers performance key indicators for HR manager. It also indicates employee turnover count, new recruitment, retention, training and development of new employees. Showcasing this set of slides titled HR Manager KPI Dashboard With Employee Attrition Tracking Report Brochure PDF. The topics addressed in these templates are Recruitment, Employee Turnover, Development. All the content presented in this PPT design is completely editable. Download it and make adjustments in color, background, font etc. as per your unique business setting.
Parameters Impacting Employee Attrition Tracking Rates Report Sample PDF
This slide depicts key reasons for employee turnover rate. It includes career development, work-life balance, management behaviour, compensation, wellbeing, job characteristics, work environment, relocation and retirement. Showcasing this set of slides titled Parameters Impacting Employee Attrition Tracking Rates Report Sample PDF. The topics addressed in these templates are Parameters Impacting Employee, Attrition Tracking Rates Report. All the content presented in this PPT design is completely editable. Download it and make adjustments in color, background, font etc. as per your unique business setting.

Global Market Scenario Of Building Management Services Ppt Pictures Layouts PDF
This slide highlights the facility management services market share and future growth rate in different geographies. It showcases growth of organized and unorganized facility management services. Showcasing this set of slides titled Global Market Scenario Of Building Management Services Ppt Pictures Layouts PDF. The topics addressed in these templates are Facility Management, Global Market Share, Facility Management Future, Growth Rate. All the content presented in this PPT design is completely editable. Download it and make adjustments in color, background, font etc. as per your unique business setting.
Issues Tracking Dashboard For Organizational Building Management Ppt Infographics Topics PDF
This slide showcases dashboard which can help organization to keep track of issues plus faults during facility management and rectify them within stipulated time. Its key elements are issues reported, fault tracking, etc. Pitch your topic with ease and precision using this Issues Tracking Dashboard For Organizational Building Management Ppt Infographics Topics PDF. This layout presents information on Fault Tracking, Issues Reported, Location. It is also available for immediate download and adjustment. So, changes can be made in the color, design, graphics or any other component to create a unique layout.

Building Management Dashboard Highlighting Power Consumption And Occupancy Rate Template PDF
This slide showcases dashboard that can help organization to keep track of power consumed by machinery and occupancy rate during facility management. Its key components are HVAC, occupancy rate, service requests and temperature. Pitch your topic with ease and precision using this Building Management Dashboard Highlighting Power Consumption And Occupancy Rate Template PDF. This layout presents information on Lighting, Power, Water, Electricity, Temperature. It is also available for immediate download and adjustment. So, changes can be made in the color, design, graphics or any other component to create a unique layout.

Organizational Change Management Process Flow Dashboard Ppt PowerPoint Presentation Diagram PDF
This slide covers Business change management lifecycle dashboard. It involves overall health, customer data, financials and operational efficiency. Pitch your topic with ease and precision using this Organizational Change Management Process Flow Dashboard Ppt PowerPoint Presentation Diagram PDF. This layout presents information on Financial Data, Operational Efficiency, Consumer Data. It is also available for immediate download and adjustment. So, changes can be made in the color, design, graphics or any other component to create a unique layout.
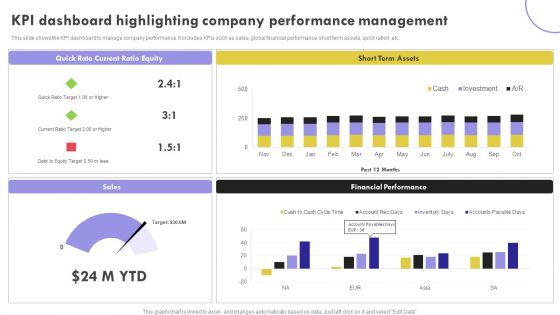
KPI Dashboard Highlighting Company Performance Management Inspiration PDF
This slide shows the KPI dashboard to manage company performance. It includes KPIs such as sales, global financial performance, short term assets, quick ration, etc.Showcasing this set of slides titled KPI Dashboard Highlighting Company Performance Management Inspiration PDF. The topics addressed in these templates are Current Ratio, Term Assets, Financial Performance. All the content presented in this PPT design is completely editable. Download it and make adjustments in color, background, font etc. as per your unique business setting.
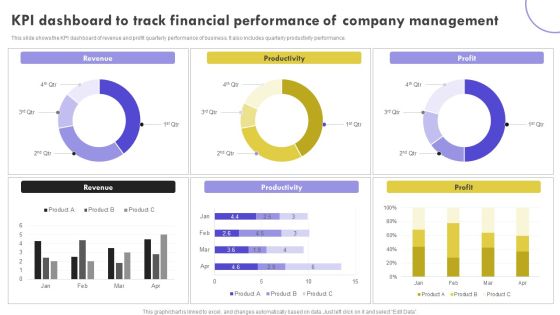
KPI Dashboard To Track Financial Performance Of Company Management Clipart PDF
This slide shows the KPI dashboard of revenue and profit quarterly performance of business. It also includes quarterly productivity performance. Pitch your topic with ease and precision using this KPI Dashboard To Track Financial Performance Of Company Management Clipart PDF. This layout presents information on Revenue, Productivity, Profit. It is also available for immediate download and adjustment. So, changes can be made in the color, design, graphics or any other component to create a unique layout.

Customer And Product Sales Performance Comparison Matrix Introduction PDF
This slide shows client and product sales Performance comparison matrix. It includes top products and Customer of the organization. Showcasing this set of slides titled Customer And Product Sales Performance Comparison Matrix Introduction PDF. The topics addressed in these templates are Top Products, Top Customers, Sales. All the content presented in this PPT design is completely editable. Download it and make adjustments in color, background, font etc. as per your unique business setting.

KPI Dashboard Of Customer And Product Sales Performance Comparison Information PDF
This slide shows the KPI dashboard of client and product sales comparison. It also includes sales by location and total sales. Pitch your topic with ease and precision using this KPI Dashboard Of Customer And Product Sales Performance Comparison Information PDF. This layout presents information on Product Sales, Client Sales, Tim Santana. It is also available for immediate download and adjustment. So, changes can be made in the color, design, graphics or any other component to create a unique layout.
Sales Performance Comparison Graph Of Top Customer Icons PDF
This slide shows the customer sales comparison graph along with the units of product purchased by the clients. Showcasing this set of slides titled Sales Performance Comparison Graph Of Top Customer Icons PDF. The topics addressed in these templates are Highest Units, Customer, Product. All the content presented in this PPT design is completely editable. Download it and make adjustments in color, background, font etc. as per your unique business setting.
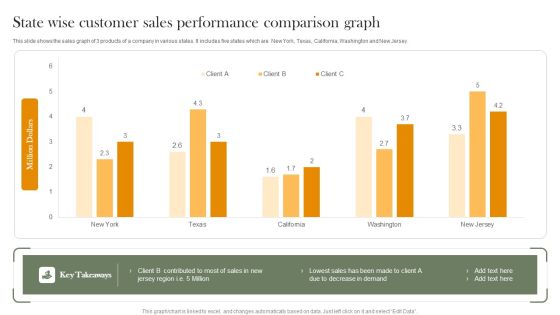
State Wise Customer Sales Performance Comparison Graph Introduction PDF
This slide shows the sales graph of 3 products of a company in various states. It includes five states which are New York, Texas, California, Washington and New Jersey. Showcasing this set of slides titled State Wise Customer Sales Performance Comparison Graph Introduction PDF. The topics addressed in these templates are Lowest Sales, Decrease Demand. All the content presented in this PPT design is completely editable. Download it and make adjustments in color, background, font etc. as per your unique business setting.
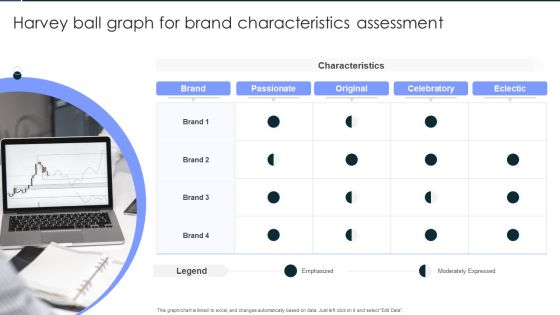
Harvey Ball Graph For Brand Characteristics Assessment Professional PDF
Showcasing this set of slides titled Harvey Ball Graph For Brand Characteristics Assessment Professional PDF. The topics addressed in these templates are Harvey Ball Graph, For Brand, Characteristics Assessment. All the content presented in this PPT design is completely editable. Download it and make adjustments in color, background, font etc. as per your unique business setting.
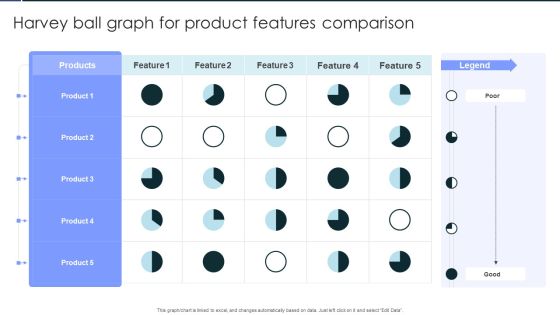
Harvey Ball Graph For Product Features Comparison Rules PDF
Pitch your topic with ease and precision using this Harvey Ball Graph For Product Features Comparison Rules PDF. This layout presents information onHarvey Ball Graph, For Product, Features Comparison. It is also available for immediate download and adjustment. So, changes can be made in the color, design, graphics or any other component to create a unique layout.
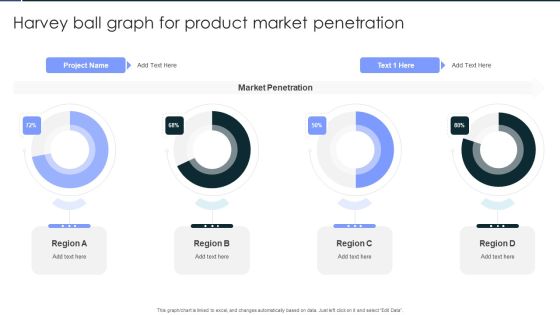
Harvey Ball Graph For Product Market Penetration Clipart PDF
Showcasing this set of slides titled Harvey Ball Graph For Product Market Penetration Clipart PDF. The topics addressed in these templates are Harvey Ball Graph, For Product, Market Penetration. All the content presented in this PPT design is completely editable. Download it and make adjustments in color, background, font etc. as per your unique business setting.
 Home
Home