Budget Planning

Statistics Showing Impact Of Digitization Of Security Systems Ppt Show Ideas PDF
The following slide highlights key statistics of digitization of security systems of an organization. Information covered in this slide is related to current level of security automation such as high, medium, low and none. Showcasing this set of slides titled Statistics Showing Impact Of Digitization Of Security Systems Ppt Show Ideas PDF. The topics addressed in these templates are Current Level, Security Automation, Organization. All the content presented in this PPT design is completely editable. Download it and make adjustments in color, background, font etc. as per your unique business setting.
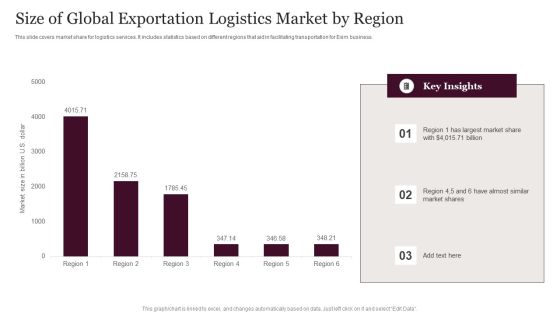
Size Of Global Exportation Logistics Market By Region Information PDF
This slide covers market share for logistics services. It includes statistics based on different regions that aid in facilitating transportation for Exim business. Pitch your topic with ease and precision using this Size Of Global Exportation Logistics Market By Region Information PDF. This layout presents information on Global Exportation Logistics, Market By Region. It is also available for immediate download and adjustment. So, changes can be made in the color, design, graphics or any other component to create a unique layout.
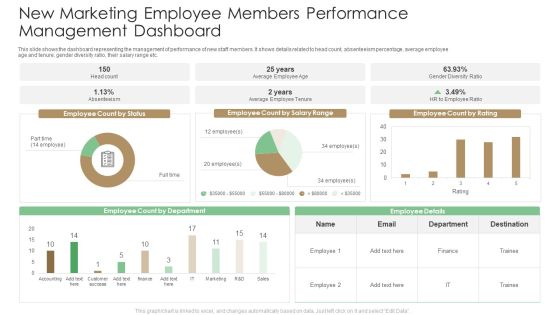
New Marketing Employee Members Performance Management Dashboard Summary PDF
This slide shows the dashboard representing the management of performance of new staff members. It shows details related to head count, absenteeism percentage, average employee age and tenure, gender diversity ratio, their salary range etc. Pitch your topic with ease and precision using this New Marketing Employee Members Performance Management Dashboard Summary PDF. This layout presents information on Employee Ratio, Average Employee Tenure. It is also available for immediate download and adjustment. So, changes can be made in the color, design, graphics or any other component to create a unique layout.

Support Team New Employee Members Performance Dashboard Designs PDF
This slide shows the dashboard representing the performance evaluation of the new staff members of the support team staff. It shoes details related to occupancy rate, net promoter score, average first contact resolution rate etc. Pitch your topic with ease and precision using this Support Team New Employee Members Performance Dashboard Designs PDF. This layout presents information on Target Range, Occupancy Rate, Contact Resolution Rate. It is also available for immediate download and adjustment. So, changes can be made in the color, design, graphics or any other component to create a unique layout.
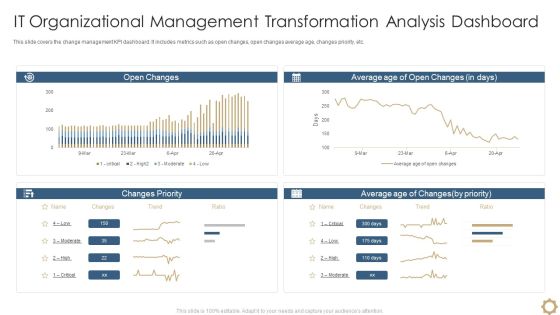
It Organizational Management Transformation Analysis Dashboard Download PDF
This slide covers the change management KPI dashboard. It includes metrics such as open changes, open changes average age, changes priority, etc. Showcasing this set of slides titled It Organizational Management Transformation Analysis Dashboard Download PDF. The topics addressed in these templates are It Organizational Management, Transformation Analysis Dashboard. All the content presented in this PPT design is completely editable. Download it and make adjustments in color, background, font etc. as per your unique business setting.

Open Organizational Management Transformation Kpi Dashboard Information PDF
This slide covers the KPI tracking dashboard for optimizing open changes. It includes metrics such as open changes by risk, status, due date, waiting for approval, etc. Pitch your topic with ease and precision using this Open Organizational Management Transformation Kpi Dashboard Information PDF. This layout presents information on Open Organizational Management, Transformation Kpi Dashboard. It is also available for immediate download and adjustment. So, changes can be made in the color, design, graphics or any other component to create a unique layout.

Social Network Promotion Campaign Performance Report Demonstration PDF
The purpose of this slide is to highlight the digital marketing campaigning performance report to track information in real-time like new leads acquired, total leads, and revenue on monthly basis. The leads generated through various platforms are Twitter, Facebook, LinkedIn, etc. Pitch your topic with ease and precision using this Social Network Promotion Campaign Performance Report Demonstration PDF. This layout presents information on Sales Ready Leads, New Leads, New Revenue. It is also available for immediate download and adjustment. So, changes can be made in the color, design, graphics or any other component to create a unique layout.
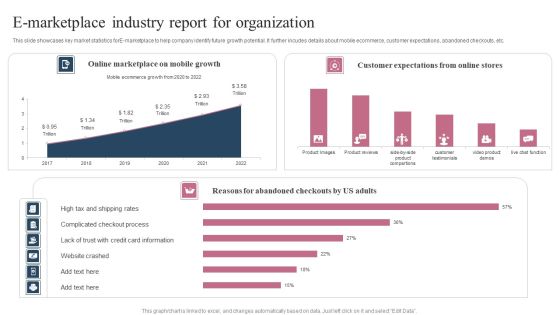
E Marketplace Industry Report For Organization Ppt Pictures Maker PDF
This slide showcases key market statistics forE-marketplace to help company identify future growth potential. It further incudes details about mobile ecommerce, customer expectations, abandoned checkouts, etc. Showcasing this set of slides titled E Marketplace Industry Report For Organization Ppt Pictures Maker PDF. The topics addressed in these templates are Online Marketplace, Mobile Growth, Customer Expectations, Online Stores. All the content presented in this PPT design is completely editable. Download it and make adjustments in color, background, font etc. as per your unique business setting.
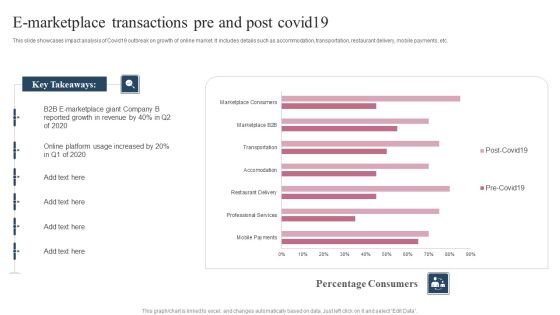
E Marketplace Transactions Pre And Post Covid19 Ppt Pictures Files PDF
This slide showcases impact analysis of Covid19 outbreak on growth of online market. It includes details such as accommodation, transportation, restaurant delivery, mobile payments, etc. Pitch your topic with ease and precision using this E Marketplace Transactions Pre And Post Covid19 Ppt Pictures Files PDF. This layout presents information on Key Takeaways, B2B E Marketplace, Online Platform. It is also available for immediate download and adjustment. So, changes can be made in the color, design, graphics or any other component to create a unique layout.
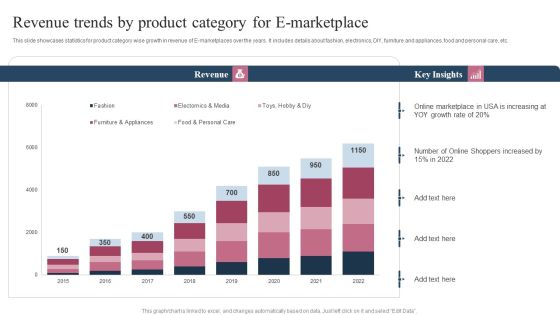
Revenue Trends By Product Category For E Marketplace Ppt Pictures Slide Portrait PDF
This slide showcases statistics for product category wise growth in revenue of E-marketplaces over the years. It includes details about fashion, electronics, DIY, furniture and appliances, food and personal care, etc. Pitch your topic with ease and precision using this Revenue Trends By Product Category For E Marketplace Ppt Pictures Slide Portrait PDF. This layout presents information on Revenue, Online Marketplace, Number Online, Shoppers Increased, 2015 To 2022. It is also available for immediate download and adjustment. So, changes can be made in the color, design, graphics or any other component to create a unique layout.

Results Of Poor Smarketing Ppt PowerPoint Presentation File Brochure PDF
This slides shows impacts of poor sales and marketing alignment on business. It provides information about revenue loss, loss of qualified leads, loss of customers, etc. Showcasing this set of slides titled Results Of Poor Smarketing Ppt PowerPoint Presentation File Brochure PDF. The topics addressed in these templates are Loss Customers, Decrease Customer Satisfaction, Poor Content Marketing. All the content presented in this PPT design is completely editable. Download it and make adjustments in color, background, font etc. as per your unique business setting.
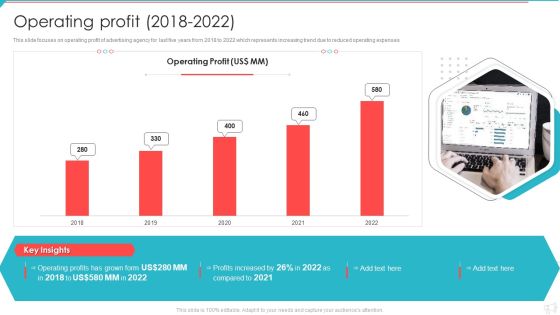
Advertisement And Marketing Agency Company Profile Operating Profit 2018 To 2022 Infographics PDF
This slide focuses on operating profit of advertising agency for last five years from 2018 to 2022 which represents increasing trend due to reduced operating expenses. Deliver and pitch your topic in the best possible manner with this Advertisement And Marketing Agency Company Profile Operating Profit 2018 To 2022 Infographics PDF. Use them to share invaluable insights on Operating Profit, Profits Increased, 2018 To 2022 and impress your audience. This template can be altered and modified as per your expectations. So, grab it now.

Advertisement And Marketing Agency Company Profile Revenue And Net Profits Formats PDF
This slide focuses on financial highlights of advertising agency which represents revenue and net profits for last five years from 2018 to 2022. Deliver and pitch your topic in the best possible manner with this Advertisement And Marketing Agency Company Profile Revenue And Net Profits Formats PDF. Use them to share invaluable insights on Companys Revenue, Profit Increased, 2018 To 2022 and impress your audience. This template can be altered and modified as per your expectations. So, grab it now.

Advertisement And Marketing Agency Company Profile Revenue Split By Geography Rules PDF
This slide represents the revenue split by geography and media channels such as video, newspapers, print and digital publications, out-of-home, etc. Deliver an awe inspiring pitch with this creative Advertisement And Marketing Agency Company Profile Revenue Split By Geography Rules PDF bundle. Topics like Revenue Geography, Revenue Media Channels, 2022 can be discussed with this completely editable template. It is available for immediate download depending on the needs and requirements of the user.

DISC Assessment Personality Style Report Of Employee Sample PDF
This slide covers employees disc personality style sheet. It includes DISC personality testing outcomes showing both natural or internal style and adapted or external style of an employee. Pitch your topic with ease and precision using this DISC Assessment Personality Style Report Of Employee Sample PDF. This layout presents information on Congratulations Sara Mathew, Internal Motivations, Remains Constant. It is also available for immediate download and adjustment. So, changes can be made in the color, design, graphics or any other component to create a unique layout.

Actual And Target Stock Ratio Comparison Ppt Visual Aids Ideas PDF
This slide shows the difference between actual Stock ratio and target in last eight months. No sudden increase or decrease has been observed in turnover ratio through out this time. Showcasing this set of slides titled Actual And Target Stock Ratio Comparison Ppt Visual Aids Ideas PDF. The topics addressed in these templates are Turnover Ratio, Price, 2015 To 2022. All the content presented in this PPT design is completely editable. Download it and make adjustments in color, background, font etc. as per your unique business setting.

Business Products Stock Turnover Ratio Ppt File Aids PDF
This slide shows the comparison of quarterly stock turnover ratio of three products of a company during the year. Highest profitable product was product C Pitch your topic with ease and precision using this Business Products Stock Turnover Ratio Ppt File Aids PDF. This layout presents information on Better Management, Production Level, Turnover Ratio. It is also available for immediate download and adjustment. So, changes can be made in the color, design, graphics or any other component to create a unique layout.

Comparison Of Stock Ratio Available In Warehouse Ppt Show Elements PDF
This slide shows the available quantities of various types of Stock in storage house. These inventories are finished goods, raw material, work in progress, MRO, etc. Showcasing this set of slides titled Comparison Of Stock Ratio Available In Warehouse Ppt Show Elements PDF. The topics addressed in these templates are Raw Material, Work Progess, Maintenance, Repair And Operations. All the content presented in this PPT design is completely editable. Download it and make adjustments in color, background, font etc. as per your unique business setting.
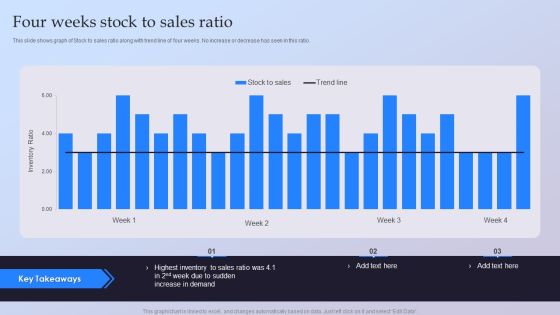
Four Weeks Stock To Sales Ratio Ppt Ideas Guide PDF
This slide shows graph of Stock to sales ratio along with trend line of four weeks. No increase or decrease has seen in this ratio. Pitch your topic with ease and precision using this Four Weeks Stock To Sales Ratio Ppt Ideas Guide PDF. This layout presents information on Highest Inventory, Sales Ratio, Increase Demand. It is also available for immediate download and adjustment. So, changes can be made in the color, design, graphics or any other component to create a unique layout.
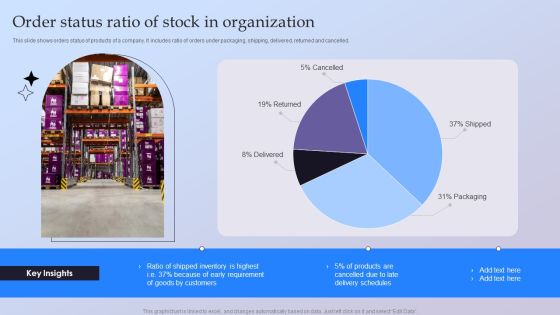
Order Status Ratio Of Stock In Organization Ppt Portfolio Examples PDF
This slide shows orders status of products of a company. It includes ratio of orders under packaging, shipping, delivered, returned and cancelled. Pitch your topic with ease and precision using this Order Status Ratio Of Stock In Organization Ppt Portfolio Examples PDF. This layout presents information on Shipped, Packaging, Delivered, Returned. It is also available for immediate download and adjustment. So, changes can be made in the color, design, graphics or any other component to create a unique layout.

Stock Ratio Comparison Of Four Brands Ppt Model Layout Ideas PDF
This slide shows a comparative analysis of Stock ratio of four brands in last five year. Continuous increase has seen in Stock ratio of brand D. Showcasing this set of slides titled Stock Ratio Comparison Of Four Brands Ppt Model Layout Ideas PDF. The topics addressed in these templates are 2018 To 2022, Stock Ratio, Stock Management System. All the content presented in this PPT design is completely editable. Download it and make adjustments in color, background, font etc. as per your unique business setting.
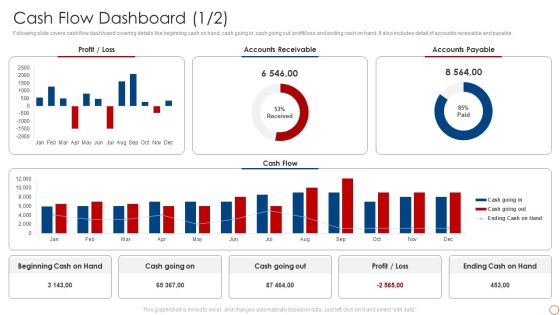
Kpis For Evaluating Business Sustainability Cash Flow Dashboard Background PDF
Following slide covers cash flow dashboard covering details like beginning cash on hand, cash going in, cash going out, profit or loss and ending cash on hand. It also includes detail of accounts receivable and payable. Deliver an awe inspiring pitch with this creative Kpis For Evaluating Business Sustainability Cash Flow Dashboard Background PDF bundle. Topics like Accounts Receivable, Accounts Payable, Cash Flow can be discussed with this completely editable template. It is available for immediate download depending on the needs and requirements of the user.

Kpis For Evaluating Business Sustainability Customer Churn Rate Dashboard Guidelines PDF
Mentioned slide covers customer churn rate dashboard. It includes details of monthly customer churn rate, accounts opened, churned accounts demographics and churn heatmap. Deliver an awe inspiring pitch with this creative Kpis For Evaluating Business Sustainability Customer Churn Rate Dashboard Guidelines PDF bundle. Topics like Accounts Opened, Monthly Customer, Churn Rate, Demographics can be discussed with this completely editable template. It is available for immediate download depending on the needs and requirements of the user.

Kpis For Evaluating Business Sustainability Customer Lifetime Value Dashboard Clipart PDF
This slide covers customer lifetime value dashboard. It covers details of average customer lifetime and average lifetime value in a 12 months format. Deliver and pitch your topic in the best possible manner with this Kpis For Evaluating Business Sustainability Customer Lifetime Value Dashboard Clipart PDF. Use them to share invaluable insights on Average Customer Lifetime, Average Lifetime Value and impress your audience. This template can be altered and modified as per your expectations. So, grab it now.
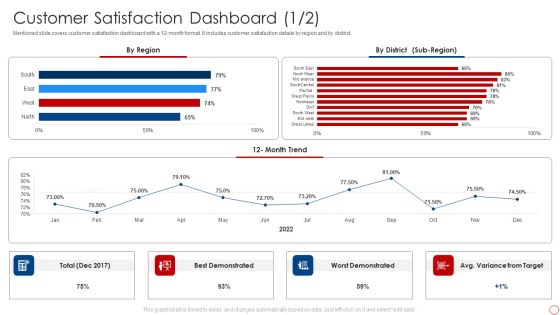
Kpis For Evaluating Business Sustainability Customer Satisfaction Dashboard Clipart PDF
Mentioned slide covers customer satisfaction dashboard with a 12-month format. It includes customer satisfaction details by region and by district. Deliver an awe inspiring pitch with this creative Kpis For Evaluating Business Sustainability Customer Satisfaction Dashboard Clipart PDF bundle. Topics like Best Demonstrated, Worst Demonstrated, 12 Month Trend can be discussed with this completely editable template. It is available for immediate download depending on the needs and requirements of the user.

Kpis For Evaluating Business Sustainability Effective Rate Metrics By Customer Ideas PDF
This slide covers effective rate metrics. It shows over year over comparison of effective rate per customer as well as effective rate per offering. Deliver an awe inspiring pitch with this creative Kpis For Evaluating Business Sustainability Effective Rate Metrics By Customer Ideas PDF bundle. Topics like Effective Rate, Per Customer, Effective Rate, Per Offering can be discussed with this completely editable template. It is available for immediate download depending on the needs and requirements of the user.
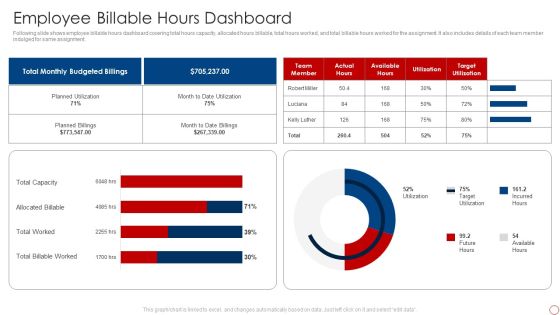
Kpis For Evaluating Business Sustainability Employee Billable Hours Dashboard Professional PDF
Following slide shows employee billable hours dashboard covering total hours capacity, allocated hours billable, total hours worked, and total billable hours worked for the assignment. It also includes details of each team member indulged for same assignment. Deliver and pitch your topic in the best possible manner with this Kpis For Evaluating Business Sustainability Employee Billable Hours Dashboard Professional PDF. Use them to share invaluable insights on Total Billable Worked, Total Worked, Allocated Billable, Total Capacity and impress your audience. This template can be altered and modified as per your expectations. So, grab it now.
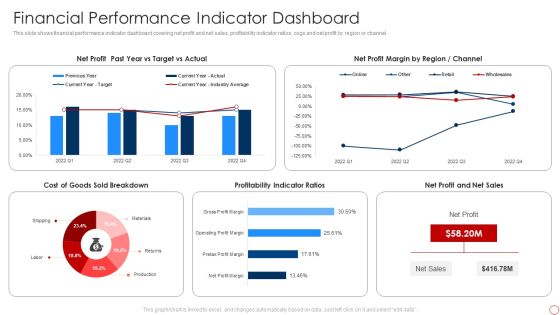
Kpis For Evaluating Business Sustainability Financial Performance Indicator Dashboard Demonstration PDF
This slide shows financial performance indicator dashboard covering net profit and net sales, profitability indicator ratios, cogs and net profit by region or channel. Deliver and pitch your topic in the best possible manner with this Kpis For Evaluating Business Sustainability Financial Performance Indicator Dashboard Demonstration PDF. Use them to share invaluable insights on Net Profit, Net Profit Margin, Profitability Indicator Ratios and impress your audience. This template can be altered and modified as per your expectations. So, grab it now.
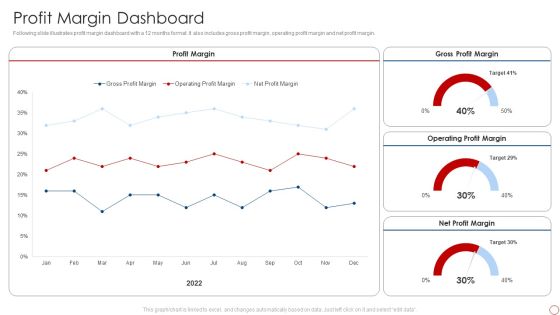
Kpis For Evaluating Business Sustainability Profit Margin Dashboard Pictures PDF
Following slide illustrates profit margin dashboard with a 12 months format. It also includes gross profit margin, operating profit margin and net profit margin. Deliver and pitch your topic in the best possible manner with this Kpis For Evaluating Business Sustainability Profit Margin Dashboard Pictures PDF. Use them to share invaluable insights on Profit Margin, Gross Profit Margin, Operating Profit Margin and impress your audience. This template can be altered and modified as per your expectations. So, grab it now.

Legal And Law Assistance LLP Business Competitive Analysis Ppt Layouts Layouts PDF
This slide highlights the law firm competitive analysis on the basis of founding year, service locations, total attorneys, revenue, profit per equity partner and CSR spend. Deliver and pitch your topic in the best possible manner with this Legal And Law Assistance LLP Business Competitive Analysis Ppt Layouts Layouts PDF. Use them to share invaluable insights on Net Revenue, Regional Offices, Service Locations and impress your audience. This template can be altered and modified as per your expectations. So, grab it now.

ANN System Hyperbolic Tangent Tanh Activation Function Graphics PDF
This slide depicts the tanh Activation Function ranging from 1 to 1, and both tanh and sigmoid are used in feedforward networks. Deliver an awe inspiring pitch with this creative ANN System Hyperbolic Tangent Tanh Activation Function Graphics PDF bundle. Topics like Hyperbolic Tangent, Activation Function can be discussed with this completely editable template. It is available for immediate download depending on the needs and requirements of the user.

ANN System Introduction To Artificial Neuron Introduction PDF
This slide introduces an artificial neuron, the primary processing unit it takes an input and sends output using the activation function. Deliver an awe inspiring pitch with this creative ANN System Introduction To Artificial Neuron Introduction PDF bundle. Topics like Introduction To Artificial Neuron can be discussed with this completely editable template. It is available for immediate download depending on the needs and requirements of the user.

ANN System Relu Rectified Linear Unit Activation Function Ideas PDF
This slide demonstrates the rectified linear unit activation function, which is the most utilized function in the current world and is both derivative and monotonic. Deliver an awe inspiring pitch with this creative ANN System Relu Rectified Linear Unit Activation Function Ideas PDF bundle. Topics like Convolutional Neural Networks, Values can be discussed with this completely editable template. It is available for immediate download depending on the needs and requirements of the user.

ANN System Two Types Of Activation Function Demonstration PDF
This slide depicts two types of activation function linear in which the functions output will not be restricted within range, and the other is non linear, which allows the model to adapt to a wide range of data. Deliver an awe inspiring pitch with this creative ANN System Two Types Of Activation Function Demonstration PDF bundle. Topics like Neural Networks, Data can be discussed with this completely editable template. It is available for immediate download depending on the needs and requirements of the user.

Conversational Marketing Dashboard For B2B And B2C Organization Sample PDF
Purpose of the following slide is to show key metrics that can help the organization to track conversational marketing efforts, it highlights essential KPIs such as open opportunities, qualified influence etc. Deliver and pitch your topic in the best possible manner with this Conversational Marketing Dashboard For B2B And B2C Organization Sample PDF. Use them to share invaluable insights on Conversational Marketing Dashboard, B2c Organization and impress your audience. This template can be altered and modified as per your expectations. So, grab it now.

Decentralized Applications IT Dashboard For Dapp Development Topics PDF
This slide depicts the dashboard for dApp development based on the portfolio performance, recent activities, assets, deposits, and so on. Deliver an awe inspiring pitch with this creative Decentralized Applications IT Dashboard For Dapp Development Topics PDF bundle. Topics like Portfolio Performance, Marketplace, Deposit can be discussed with this completely editable template. It is available for immediate download depending on the needs and requirements of the user.
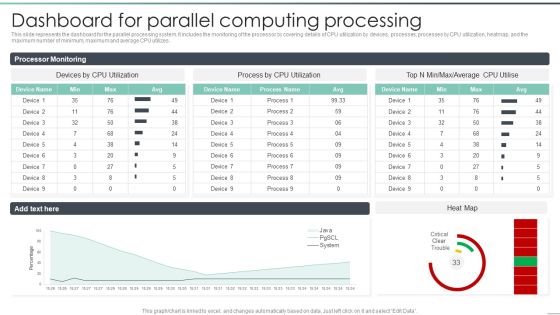
Parallel Computing Processing Dashboard For Parallel Computing Processing Template PDF
This slide represents the dashboard for the parallel processing system. It includes the monitoring of the processor by covering details of CPU utilization by devices, processes, processes by CPU utilization, heatmap, and the maximum number of minimum, maximum and average CPU utilizes. Deliver an awe inspiring pitch with this creative Parallel Computing Processing Dashboard For Parallel Computing Processing Template PDF bundle. Topics like Average, Processor Monitoring, Device can be discussed with this completely editable template. It is available for immediate download depending on the needs and requirements of the user.

Business Software Development Company Profile Company Historic Revenue Graphics PDF
The slide shows annual revenue growth of the company with the CAGR for last five financial years from 2018 to 2022. It also highlights year on year growth along with key insights. Deliver and pitch your topic in the best possible manner with this Business Software Development Company Profile Company Historic Revenue Graphics PDF. Use them to share invaluable insights on Company Revenue, Observed CAGR, 2018 To 2022 and impress your audience. This template can be altered and modified as per your expectations. So, grab it now.

Business Software Development Company Profile Competitor Comparison Summary PDF
The slide compares top competitor comparison of software company to assess companies based on employee count, geographical presence, active software, revenue and global market share. Deliver and pitch your topic in the best possible manner with this Business Software Development Company Profile Competitor Comparison Summary PDF. Use them to share invaluable insights on Global Market Share, Software Company, Employees and impress your audience. This template can be altered and modified as per your expectations. So, grab it now.

Business Software Development Company Profile EBITDA And Margin Summary PDF
This slide illustrates a graph of EBITDA in US dollar and margin in percentage for software company illustrating growth trend in last five years from 2018 to 2022. It also showcases net profit contribution by services and solutions. Deliver an awe inspiring pitch with this creative Business Software Development Company Profile EBITDA And Margin Summary PDF bundle. Topics like EBITDA, Services EBITDA, Solutions EBITDA can be discussed with this completely editable template. It is available for immediate download depending on the needs and requirements of the user.

Business Software Development Company Profile CSR Spend Inspiration PDF
The slide describes the spending on corporate social responsibility for last five years. It shows CSR spend split based on category people, environment and category and CSR spend by location. Deliver an awe inspiring pitch with this creative Business Software Development Company Profile CSR Spend Inspiration PDF bundle. Topics like Comparative CSR Spend, CSR Spent Category, Environment can be discussed with this completely editable template. It is available for immediate download depending on the needs and requirements of the user.

Business Software Development Company Profile Workforce Structure Information PDF
The slide highlights total employee count for five years illustrating diversity in the organization. It showcases employee split based on region, employee split by work experience and gender diversity of employees. Deliver an awe inspiring pitch with this creative Business Software Development Company Profile Workforce Structure Information PDF bundle. Topics like Historical Employee Strength, Employees Split Region, Total Employees can be discussed with this completely editable template. It is available for immediate download depending on the needs and requirements of the user.

Automotive Industry Report Motor Vehicle Production By Type Portrait PDF
This slide covers the details of the data related to vehicle production all over the world in last 10 years to know where we are right now and what is needed to be at a good spot in future. Pitch your topic with ease and precision using this Automotive Industry Report Motor Vehicle Production By Type Portrait PDF. This layout presents information on Automotive Industry Report, Motor Vehicle Production. It is also available for immediate download and adjustment. So, changes can be made in the color, design, graphics or any other component to create a unique layout.
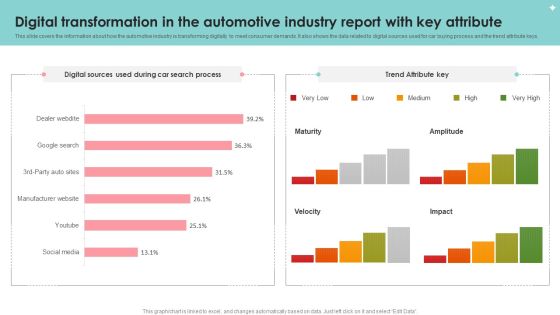
Digital Transformation In The Automotive Industry Report With Key Attribute Slides PDF
This slide covers the information about how the automotive industry is transforming digitally to meet consumer demands. It also shows the data related to digital sources used for car buying process and the trend attribute keys. Pitch your topic with ease and precision using this Digital Transformation In The Automotive Industry Report With Key Attribute Slides PDF. This layout presents information on Digital Transformation, Automotive Industry Report, Key Attribute. It is also available for immediate download and adjustment. So, changes can be made in the color, design, graphics or any other component to create a unique layout.

Brand Promotion Advertising Dashboard With Purchase Kpis Ppt PowerPoint Presentation File Format PDF
This slide illustrates the KPI dashboard for brand management. It also includes tracking metrics such as brand awareness, brand commitment, brand attribute, advertising awareness, sources of ad awareness, market share, repeat purchase, etc. Showcasing this set of slides titled Brand Promotion Advertising Dashboard With Purchase Kpis Ppt PowerPoint Presentation File Format PDF. The topics addressed in these templates are Brand Awareness, Advertising Awareness, Purchase Frequency. All the content presented in this PPT design is completely editable. Download it and make adjustments in color, background, font etc. as per your unique business setting.

Brand Promotion Awareness Dashboard With Digital Media Advertising Analysis Ppt PowerPoint Presentation Design Ideas PDF
This slide depicts the KPI dashboard for measuring brand awareness growth. It includes measurement KPIs such as users by channel, Google search console for impressions, clicks, CTR, and positions, etc. Pitch your topic with ease and precision using this Brand Promotion Awareness Dashboard With Digital Media Advertising Analysis Ppt PowerPoint Presentation Design Ideas PDF. This layout presents information on Console Impress, Reach Engagement, Combo Rating. It is also available for immediate download and adjustment. So, changes can be made in the color, design, graphics or any other component to create a unique layout.

Advertisement Campaign Dashboard Representing Conversions Target And Value Microsoft PDF
The following slide highlights the promotion campaign dashboard which illustrates the campaign impressions, CTR rate, conversions and total amount spent. Showcasing this set of slides titled Advertisement Campaign Dashboard Representing Conversions Target And Value Microsoft PDF. The topics addressed in these templates are Advertisement Campaign, Dashboard Representing, Conversions Target And Value. All the content presented in this PPT design is completely editable. Download it and make adjustments in color, background, font etc. as per your unique business setting.
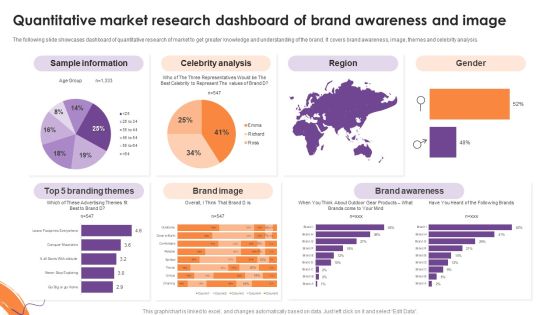
Quantitative Market Research Dashboard Of Brand Awareness And Image Inspiration PDF
The following slide showcases dashboard of quantitative research of market to get greater knowledge and understanding of the brand. It covers brand awareness, image, themes and celebrity analysis. Showcasing this set of slides titled Quantitative Market Research Dashboard Of Brand Awareness And Image Inspiration PDF. The topics addressed in these templates are Celebrity Analysis, Sample Information, Brand Awareness. All the content presented in this PPT design is completely editable. Download it and make adjustments in color, background, font etc. as per your unique business setting.

Quantitative Market Research Survey Results Structure PDF
This slide showcases market survey conducted and data gathered by various people to know the topics that drive better customer engagement. It also covers the location of the users. Pitch your topic with ease and precision using this Quantitative Market Research Survey Results Structure PDF. This layout presents information on Marketing Manager, Customer Support, Data Analyst. It is also available for immediate download and adjustment. So, changes can be made in the color, design, graphics or any other component to create a unique layout.
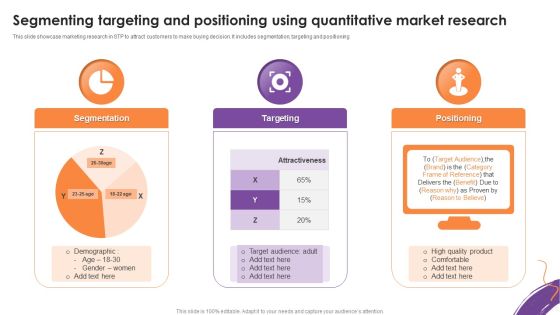
Segmenting Targeting And Positioning Using Quantitative Market Research Download PDF
This slide showcase marketing research in STP to attract customers to make buying decision. It includes segmentation, targeting and positioning. Showcasing this set of slides titled Segmenting Targeting And Positioning Using Quantitative Market Research Download PDF. The topics addressed in these templates are Segmentation, Targeting, Positioning. All the content presented in this PPT design is completely editable. Download it and make adjustments in color, background, font etc. as per your unique business setting.

Business Software Development Company Profile Financial Statements Diagrams PDF
The slide showcases income statement, balance sheet and cashflow statement of last five years to represent current financial position of organisation. Deliver an awe inspiring pitch with this creative Business Software Development Company Profile Financial Statements Diagrams PDF bundle. Topics like Income Statement, Balance Sheet, Cash Flow can be discussed with this completely editable template. It is available for immediate download depending on the needs and requirements of the user.

Business Software Development Company Profile Gross Profit And Margin Microsoft PDF
This slide illustrates a graph of gross profit in US dollar and gross margin in percentage for software company illustrating growth trend in last five years from 2018 to 2022. It also showcases gross profit contribution by services and solutions. Deliver and pitch your topic in the best possible manner with this Business Software Development Company Profile Gross Profit And Margin Microsoft PDF. Use them to share invaluable insights on Total Gross Profit, Services Gross Profit, Solutions Gross Profit and impress your audience. This template can be altered and modified as per your expectations. So, grab it now.

Business Software Development Company Profile Net Profit And Margin Mockup PDF
This slide illustrates a graph of net profit in US dollar and net margin in percentage for software company illustrating growth trend in last five years from 2018 to 2022. It also showcases net profit contribution by services and solutions. Deliver an awe inspiring pitch with this creative Business Software Development Company Profile Net Profit And Margin Mockup PDF bundle. Topics like Net Profit, Services Net Profit, Solutions Net Profit can be discussed with this completely editable template. It is available for immediate download depending on the needs and requirements of the user.

Business Software Development Company Profile Operating Profit And Margin Summary PDF
This slide illustrates a graph of operating profit in US dollar and operating margin in percentage for software company illustrating growth trend in last five years from 2018 to 2022. It also showcases operating profit contribution by services and solutions. Deliver and pitch your topic in the best possible manner with this Business Software Development Company Profile Operating Profit And Margin Summary PDF. Use them to share invaluable insights on Operating Profit, Services Operating Profit, Solutions Operating Profit and impress your audience. This template can be altered and modified as per your expectations. So, grab it now.

Business Software Development Company Profile Revenue Split By Geography Portrait PDF
The slide highlights the historical revenue split for software company since its inception and revenue share for current year based on geography. Deliver an awe inspiring pitch with this creative Business Software Development Company Profile Revenue Split By Geography Portrait PDF bundle. Topics like Revenue Share 2022, Historical Revenue Contribution, Services And Solutions can be discussed with this completely editable template. It is available for immediate download depending on the needs and requirements of the user.

Hospital Medical Research Company Profile Business Verticals Year On Year Growth Themes PDF
The slide showcases the healthcare company historical yearly growth for profit and revenue. It also showcases comparative revenue and profit year on year growth for pharmacy, hospital and research business verticals Deliver an awe inspiring pitch with this creative Hospital Medical Research Company Profile Business Verticals Year On Year Growth Themes PDF bundle. Topics like Comparative Profit, YoY Growth, Comparative Revenue, Company YoY Growth can be discussed with this completely editable template. It is available for immediate download depending on the needs and requirements of the user.
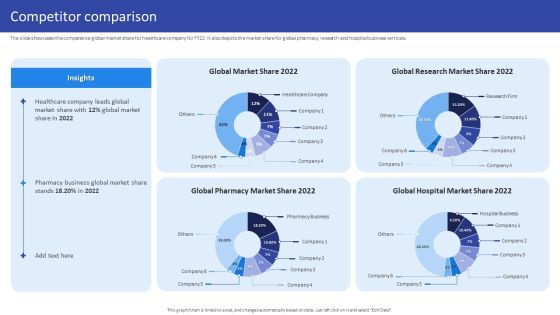
Hospital Medical Research Company Profile Competitor Comparison Inspiration PDF
The slide showcases the healthcare company historical yearly growth for profit and revenue. It also showcases comparative revenue and profit year on year growth for pharmacy, hospital and research business verticals. Deliver an awe inspiring pitch with this creative Hospital Medical Research Company Profile Competitor Comparison Inspiration PDF bundle. Topics like Global Market, Share 2022, Global Research, Market Share 2022 can be discussed with this completely editable template. It is available for immediate download depending on the needs and requirements of the user.
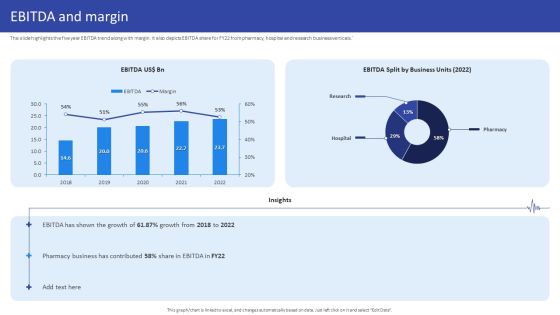
Hospital Medical Research Company Profile EBITDA And Margin Background PDF
The slide highlights the five year EBITDA trend along with margin. It also depicts EBITDA share for FY22 from pharmacy, hospital and research business verticals. Deliver and pitch your topic in the best possible manner with this Hospital Medical Research Company Profile EBITDA And Margin Background PDF.Use them to share invaluable insights on EBITDA US, EBITDA Split, Business Units, 2018 To 2022 and impress your audience. This template can be altered and modified as per your expectations. So, grab it now.
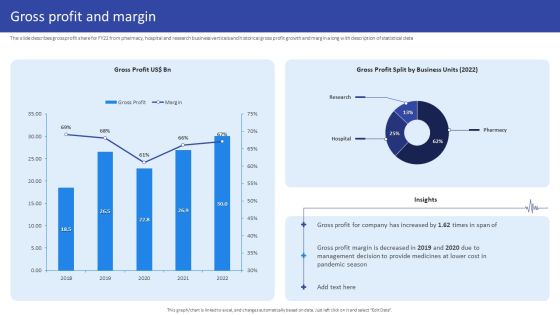
Hospital Medical Research Company Profile Gross Profit And Margin Pictures PDF
The slide describes gross profit share for FY22 from pharmacy, hospital and research business verticals and historical gross profit growth and margin along with description of statistical data. Deliver an awe inspiring pitch with this creative Hospital Medical Research Company Profile Gross Profit And Margin Pictures PDF bundle. Topics like Gross Profit Split, Business Units 2022, 2018 To 2022 can be discussed with this completely editable template. It is available for immediate download depending on the needs and requirements of the user.
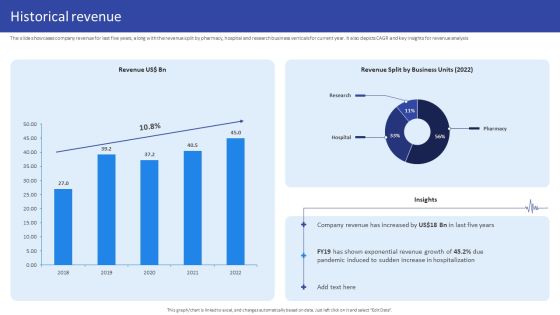
Hospital Medical Research Company Profile Historical Revenue Structure PDF
The slide showcases company revenue for last five years, along with the revenue split by pharmacy, hospital and research business verticals for current year. It also depicts CAGR and key insights for revenue analysis. Deliver and pitch your topic in the best possible manner with this Hospital Medical Research Company Profile Historical Revenue Structure PDF. Use them to share invaluable insights on Revenue US, Revenue Split, Business Units, 2018 To 2022 and impress your audience. This template can be altered and modified as per your expectations. So, grab it now.
 Home
Home