Budget Chart

Sales Sales By Geographic Region Report With Doughnut Chart Themes PDF
This slide illustrates graphical representation of sales contribution of countries. It includes revenue of FY19 in percentage and numbers and revenue of FY20 in percentage and numbers. Showcasing this set of slides titled Sales Sales By Geographic Region Report With Doughnut Chart Themes PDF. The topics addressed in these templates are Revenue, Doughnut Chart, Geographic Region Report. All the content presented in this PPT design is completely editable. Download it and make adjustments in color, background, font etc. as per your unique business setting.
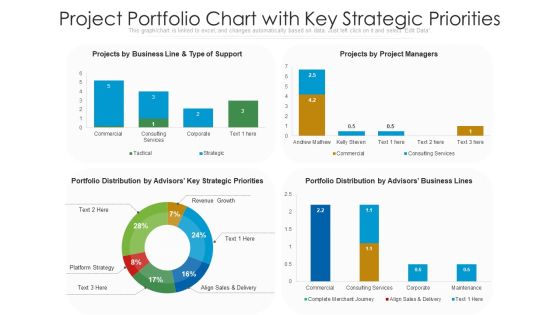
Project Portfolio Chart With Key Strategic Priorities Ppt Inspiration Mockup PDF
Showcasing this set of slides titled project portfolio chart with key strategic priorities ppt inspiration mockup pdf. The topics addressed in these templates are portfolio distribution, business lines, key strategic priorities. All the content presented in this PPT design is completely editable. Download it and make adjustments in color, background, font etc. as per your unique business setting.

3 Project Groups Comparative Assessment Chart For Performance Evaluation Background PDF
Showcasing this set of slides titled 3 project groups comparative assessment chart for performance evaluation background pdf. The topics addressed in these templates are data analysis, data recovery, android development. All the content presented in this PPT design is completely editable. Download it and make adjustments in color, background, font etc. as per your unique business setting.

Shopper And Client Marketing Plan To Boost Sales Column Chart Inspiration PDF
Do you have to make sure that everyone on your team knows about any specific topic I yes, then you should give Shopper And Client Marketing Plan To Boost Sales Column Chart Inspiration PDF a try. Our experts have put a lot of knowledge and effort into creating this impeccable Shopper And Client Marketing Plan To Boost Sales Column Chart Inspiration PDF. You can use this template for your upcoming presentations, as the slides are perfect to represent even the tiniest detail. You can download these templates from the Slidegeeks website and these are easy to edit. So grab these today.
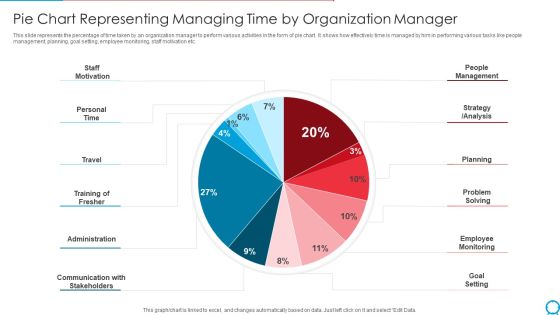
Pie Chart Representing Managing Time By Organization Manager Ppt PowerPoint Presentation Gallery Template PDF
This slide represents the percentage of time taken by an organization manager to perform various activities in the form of pie chart. It shows how effectively time is managed by him in performing various tasks like people management, planning, goal setting, employee monitoring, staff motivation etc. Pitch your topic with ease and precision using this pie chart representing managing time by organization manager ppt powerpoint presentation gallery template pdf. This layout presents information on staff motivation, personal time, travel training of fresher, administration. It is also available for immediate download and adjustment. So, changes can be made in the color, design, graphics or any other component to create a unique layout.

Supply Chain Solutions Business Outline Logistics Company Organization Chart Pictures PDF
This slide highlights the organization chart of supply chain or logistics company which includes transportation and warehouse, international forwarding, shipping agency and finance department. This is a Supply Chain Solutions Business Outline Logistics Company Organization Chart Pictures PDF template with various stages. Focus and dispense information on eight stages using this creative set, that comes with editable features. It contains large content boxes to add your information on topics like Finance Department, Administration Department, Project Investment. You can also showcase facts, figures, and other relevant content using this PPT layout. Grab it now.

Illustration Of 6 Data Processes And Flows Circular Spoke Chart PowerPoint Slides
We present our illustration of 6 data processes and flows Circular Spoke Chart PowerPoint Slides.Present our Arrows PowerPoint Templates because this slide helps you to communicate your concerns and educate your team along the path to success. Download our Process and Flows PowerPoint Templates because it Highlights the results of you thought process and convinces your team of the reasons for selecting a particular path to follow. Present our Business PowerPoint Templates because project your ideas to you colleagues and complete the full picture. Download our Shapes PowerPoint Templates because different personalities, different abilities but formidable together. Download and present our Circle Charts PowerPoint Templates because this slide shows each path to the smallest detail.Use these PowerPoint slides for presentations relating to Arrows, Background, Blue, Chart, Circle, Circular, Circulation, Color, Connection, Continuity, Cycle, Cyclic, Diagram, Direction, Empty, Flow, Four, Dimensional, Graph, Icon, Presentation, Process, Progress, Reason, Recycle, Recycling, Repetition, Report, Result, Ring, Rotation, Round, Scheme, Section, Step, Symbol, Teamwork. The prominent colors used in the PowerPoint template are Yellow, Gray, White. Professionals tell us our illustration of 6 data processes and flows Circular Spoke Chart PowerPoint Slides are Beautiful. You can be sure our Circulation PowerPoint templates and PPT Slides are Charming. Customers tell us our illustration of 6 data processes and flows Circular Spoke Chart PowerPoint Slides look good visually. Professionals tell us our Circle PowerPoint templates and PPT Slides are Endearing. People tell us our illustration of 6 data processes and flows Circular Spoke Chart PowerPoint Slides are Energetic. People tell us our Chart PowerPoint templates and PPT Slides are Breathtaking.

Pie Chart With Arrow Success PowerPoint Themes And PowerPoint Slides 0411
Microsoft PowerPoint Theme and Slide with 3D pie chart with arrow shows success

Six Months Gantt Chart For Project Performance Management Ppt PowerPoint Presentation Portfolio Shapes PDF
Presenting this set of slides with name six months gantt chart for project performance management ppt powerpoint presentation portfolio shapes pdf. The topics discussed in these slides are design the project, on site meeting. This is a completely editable PowerPoint presentation and is available for immediate download. Download now and impress your audience.

Company Profitability Financial Ratios Chart Comparison With Industry Average Download PDF
This slide illustrates graph for profitability ratio that can help to evaluate how efficiently a company generates profit and value for shareholders. It showcases ratio comparison of four companies with industry average Showcasing this set of slides titled company profitability financial ratios chart comparison with industry average download pdf. The topics addressed in these templates are company profitability financial ratios chart comparison with industry average. All the content presented in this PPT design is completely editable. Download it and make adjustments in color, background, font etc. as per your unique business setting.

Approaches To Targeting New Customers In Various Markets Column Chart Mockup PDF
Here you can discover an assortment of the finest PowerPoint and Google Slides templates. With these templates, you can create presentations for a variety of purposes while simultaneously providing your audience with an eye catching visual experience. Download Approaches To Targeting New Customers In Various Markets Column Chart Mockup PDF to deliver an impeccable presentation. These templates will make your job of preparing presentations much quicker, yet still, maintain a high level of quality. Slidegeeks has experienced researchers who prepare these templates and write high quality content for you. Later on, you can personalize the content by editing the Approaches To Targeting New Customers In Various Markets Column Chart Mockup PDF.
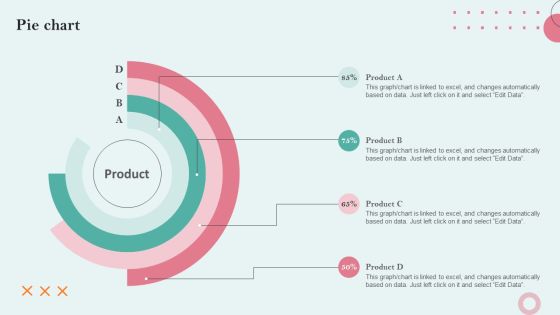
Strategies Employing PPC Advertising To Generate High Quality Leads Pie Chart Information PDF
Here you can discover an assortment of the finest PowerPoint and Google Slides templates. With these templates, you can create presentations for a variety of purposes while simultaneously providing your audience with an eye catching visual experience. Download Strategies Employing PPC Advertising To Generate High Quality Leads Pie Chart Information PDF to deliver an impeccable presentation. These templates will make your job of preparing presentations much quicker, yet still, maintain a high level of quality. Slidegeeks has experienced researchers who prepare these templates and write high quality content for you. Later on, you can personalize the content by editing the Strategies Employing PPC Advertising To Generate High Quality Leads Pie Chart Information PDF.

Column Chart Shopper Marketing Initiatives To Boost Retail Store Performance Brochure PDF
Here you can discover an assortment of the finest PowerPoint and Google Slides templates. With these templates, you can create presentations for a variety of purposes while simultaneously providing your audience with an eye catching visual experience. Download Column Chart Shopper Marketing Initiatives To Boost Retail Store Performance Brochure PDF to deliver an impeccable presentation. These templates will make your job of preparing presentations much quicker, yet still, maintain a high level of quality. Slidegeeks has experienced researchers who prepare these templates and write high quality content for you. Later on, you can personalize the content by editing the Column Chart Shopper Marketing Initiatives To Boost Retail Store Performance Brochure PDF.

Deploying Iot Solutions In The Retail Market Column Chart Information PDF
Explore a selection of the finest Deploying Iot Solutions In The Retail Market Column Chart Information PDF here. With a plethora of professionally designed and pre-made slide templates, you can quickly and easily find the right one for your upcoming presentation. You can use our Deploying Iot Solutions In The Retail Market Column Chart Information PDF to effectively convey your message to a wider audience. Slidegeeks has done a lot of research before preparing these presentation templates. The content can be personalized and the slides are highly editable. Grab templates today from Slidegeeks.

Integrating Naas Service Model To Enhance Stacked Column Chart Infographics PDF
Find highly impressive Integrating Naas Service Model To Enhance Stacked Column Chart Infographics PDF on Slidegeeks to deliver a meaningful presentation. You can save an ample amount of time using these presentation templates. No need to worry to prepare everything from scratch because Slidegeeks experts have already done a huge research and work for you. You need to download Integrating Naas Service Model To Enhance Stacked Column Chart Infographics PDF for your upcoming presentation. All the presentation templates are 100 percent editable and you can change the color and personalize the content accordingly. Download now.

Adopting Flexible Work Policy Area Chart Ppt PowerPoint Presentation File Slideshow PDF
Do you have to make sure that everyone on your team knows about any specific topic I yes, then you should give Adopting Flexible Work Policy Area Chart Ppt PowerPoint Presentation File Slideshow PDF a try. Our experts have put a lot of knowledge and effort into creating this impeccable Adopting Flexible Work Policy Area Chart Ppt PowerPoint Presentation File Slideshow PDF. You can use this template for your upcoming presentations, as the slides are perfect to represent even the tiniest detail. You can download these templates from the Slidegeeks website and these are easy to edit. So grab these today.
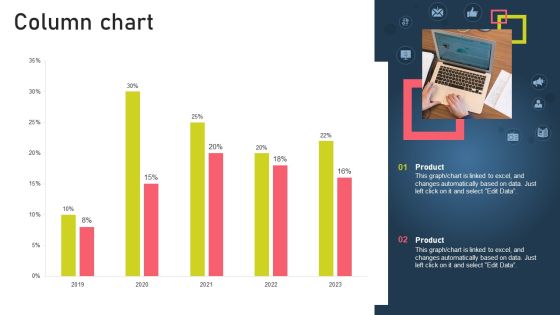
Strategies For Acquiring Online And Offline Clients Column Chart Clipart PDF
Find highly impressive Strategies For Acquiring Online And Offline Clients Column Chart Clipart PDF on Slidegeeks to deliver a meaningful presentation. You can save an ample amount of time using these presentation templates. No need to worry to prepare everything from scratch because Slidegeeks experts have already done a huge research and work for you. You need to download Strategies For Acquiring Online And Offline Clients Column Chart Clipart PDF for your upcoming presentation. All the presentation templates are 100 percent editable and you can change the color and personalize the content accordingly. Download now.
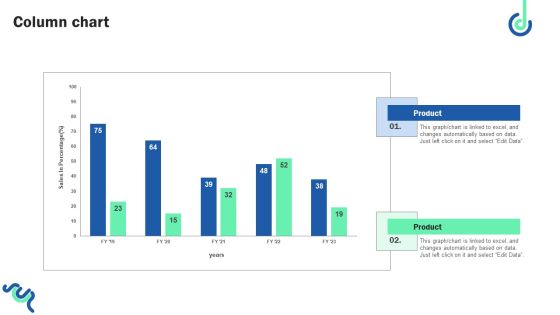
Digital Shopper Marketing Strategy To Capture Customer Interest Column Chart Introduction PDF
Create an editable Digital Shopper Marketing Strategy To Capture Customer Interest Column Chart Introduction PDF that communicates your idea and engages your audience. Whether you are presenting a business or an educational presentation, pre designed presentation templates help save time. Digital Shopper Marketing Strategy To Capture Customer Interest Column Chart Introduction PDF is highly customizable and very easy to edit, covering many different styles from creative to business presentations. Slidegeeks has creative team members who have crafted amazing templates. So, go and get them without any delay.

Stacked Column Chart Techniques For Enhancing Buyer Acquisition Approach Ideas PDF
Get a simple yet stunning designed Stacked Column Chart Techniques For Enhancing Buyer Acquisition Approach Ideas PDF. It is the best one to establish the tone in your meetings. It is an excellent way to make your presentations highly effective. So, download this PPT today from Slidegeeks and see the positive impacts. Our easy-to-edit Stacked Column Chart Techniques For Enhancing Buyer Acquisition Approach Ideas PDF can be your go-to option for all upcoming conferences and meetings. So, what are you waiting for Grab this template today.
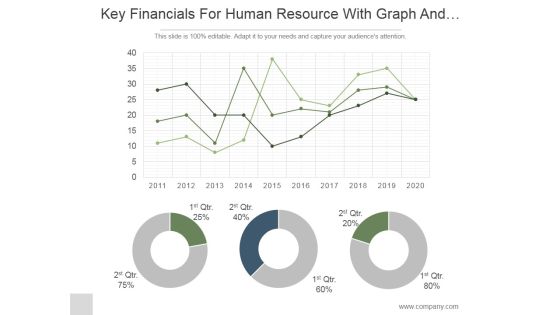
Key Financials For Human Resource With Graph And Pie Chart Ppt PowerPoint Presentation Ideas
This is a key financials for human resource with graph and pie chart ppt powerpoint presentation ideas. This is a three stage process. The stages in this process are business, strategy, marketing, analysis, donut, growth.
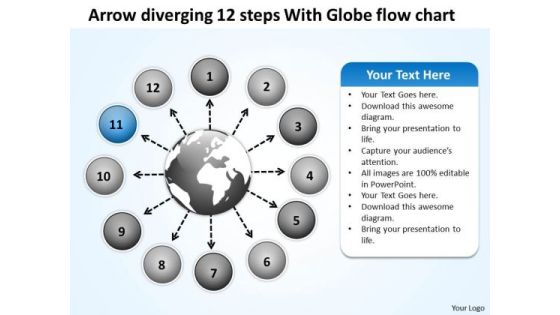
Diverging 12 Steps With Globe Flow Chart Ppt Circular Process Diagram PowerPoint Templates
We present our diverging 12 steps with globe flow chart ppt Circular Process Diagram PowerPoint templates.Present our Globe PowerPoint Templates because this Slide offers an excellent background to build up the various stages of your business process. Download and present our Business PowerPoint Templates because maximising sales of your product is the intended destination. Download and present our Circle Charts PowerPoint Templates because you can Highlight the key components of your entire manufacturing/ business process. Download and present our Process and flows PowerPoint Templates because you can Decorate it with your well wrapped ideas and colourful thoughts. Present our Marketing PowerPoint Templates because these slides are the triggers of our growth.Use these PowerPoint slides for presentations relating to Around, arrow, business, chart, circle,circular, circulation, commerce, concept,curving, cycle, diagram, direction,element, finance, financial,flow, flowchart, flowing, global, globe,internet, investment, loop, map, market,motion, movement, moving,presentation, process, recession,recycle, repeat, repetitive, ring, rotation,round, savings, shape. The prominent colors used in the PowerPoint template are Blue light, Black, White. People tell us our diverging 12 steps with globe flow chart ppt Circular Process Diagram PowerPoint templates will help you be quick off the draw. Just enter your specific text and see your points hit home. Professionals tell us our circle PowerPoint templates and PPT Slides will get their audience's attention. We assure you our diverging 12 steps with globe flow chart ppt Circular Process Diagram PowerPoint templates are Cheerful. PowerPoint presentation experts tell us our commerce PowerPoint templates and PPT Slides have awesome images to get your point across. We assure you our diverging 12 steps with globe flow chart ppt Circular Process Diagram PowerPoint templates are Awesome. People tell us our circle PowerPoint templates and PPT Slides are Striking.

People Around Pie Chart Business PowerPoint Templates And PowerPoint Backgrounds 0311
Microsoft PowerPoint Template and Background with 3D people around a pie chart

Pie Chart With Arrow Success PowerPoint Templates And PowerPoint Backgrounds 0411
Microsoft PowerPoint Template and Background with 3D pie chart with arrow shows success

Falling Bar Chart Loss Business PowerPoint Templates And PowerPoint Backgrounds 0611
Microsoft PowerPoint Template and Background with falling bar chart with glowing arrow
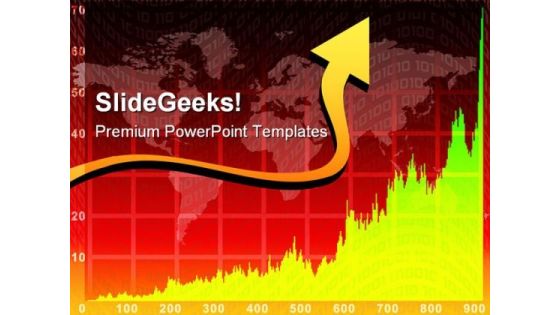
Red Chart Arrow On World Map Background PowerPoint Templates And PowerPoint Backgrounds 0711
Microsoft PowerPoint Template and Background with red chart arrow on world map background world wide business

People With Pie Chart Business PowerPoint Templates And PowerPoint Backgrounds 0711
Microsoft PowerPoint Template and Background with people with a pie chart

Investment Pitch For Aftermarket Organization Chart Diagram Of The Company Management Introduction
Presenting this set of slides with name investment pitch for aftermarket organization chart diagram of the company management introduction. This is a three stage process. The stages in this process are insurance operations, insurance corporation, services provider, banking solutions, investment company, asset management solutions, banking activities. This is a completely editable PowerPoint presentation and is available for immediate download. Download now and impress your audience.

Financial Chart For Current And Quick Financial Ratios Comparison Brochure PDF
This slide showcases current and quick ratio graph that can help to evaluate companys liquidity and and assess the company abilities to pay off debt. It also showcases comparison of ratio with previous financial year Pitch your topic with ease and precision using this financial chart for current and quick financial ratios comparison brochure pdf. This layout presents information on financial chart for current and quick financial ratios comparison. It is also available for immediate download and adjustment. So, changes can be made in the color, design, graphics or any other component to create a unique layout.

Customized Vs Mass Marketing Comparison With Line Chart Ppt PowerPoint Presentation File Ideas PDF
This slide signifies the customized vs mass marketing with line chart. It includes comparison based on strategies that are being implemented for growth in customer engagement. Pitch your topic with ease and precision using this Customized Vs Mass Marketing Comparison With Line Chart Ppt PowerPoint Presentation File Ideas PDF. This layout presents information on Customized Marketing, Mass Marketing, 2016 To 2022. It is also available for immediate download and adjustment. So, changes can be made in the color, design, graphics or any other component to create a unique layout.

Adopting Flexible Work Policy Pie Chart Ppt PowerPoint Presentation File Layouts PDF
Do you have an important presentation coming up Are you looking for something that will make your presentation stand out from the rest Look no further than Adopting Flexible Work Policy Pie Chart Ppt PowerPoint Presentation File Layouts PDF. With our professional designs, you can trust that your presentation will pop and make delivering it a smooth process. And with Slidegeeks, you can trust that your presentation will be unique and memorable. So why wait Grab Adopting Flexible Work Policy Pie Chart Ppt PowerPoint Presentation File Layouts PDF today and make your presentation stand out from the rest.
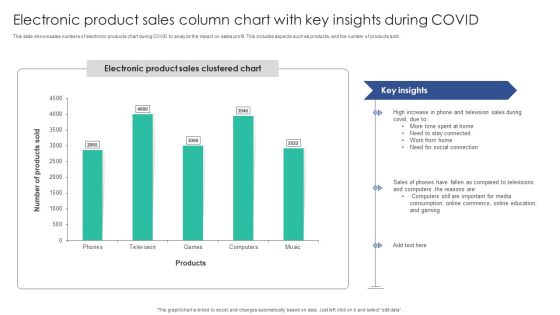
Electronic Product Sales Column Chart With Key Insights During COVID Microsoft PDF
This slide shows sales numbers of electronic products chart during COVID to analyze the impact on sales profit. This includes aspects such as products, and the number of products sold. Pitch your topic with ease and precision using this Electronic Product Sales Column Chart With Key Insights During COVID Microsoft PDF. This layout presents information on Stay Connected, Social Connection, Compared Televisions. It is also available for immediate download and adjustment. So, changes can be made in the color, design, graphics or any other component to create a unique layout.
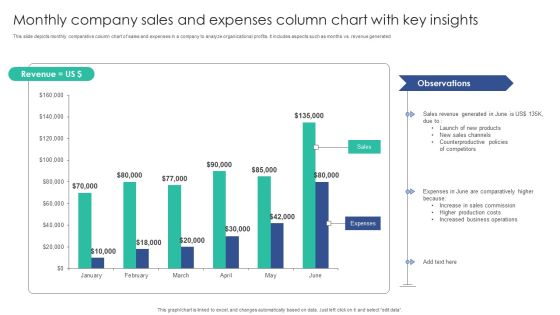
Monthly Company Sales And Expenses Column Chart With Key Insights Mockup PDF
This slide depicts monthly comparative column chart of sales and expenses in a company to analyze organizational profits. It includes aspects such as months vs. revenue generatedPitch your topic with ease and precision using this Monthly Company Sales And Expenses Column Chart With Key Insights Mockup PDF. This layout presents information on Sales Channels, Counterproductive Policies, Sales Commission. It is also available for immediate download and adjustment. So, changes can be made in the color, design, graphics or any other component to create a unique layout.
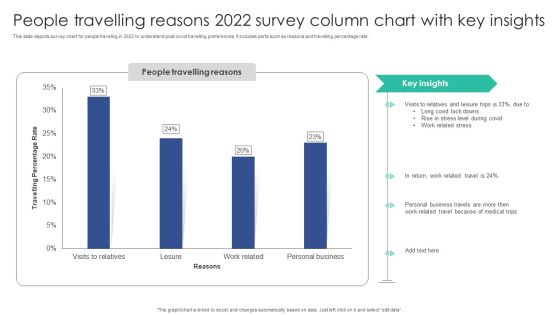
People Travelling Reasons 2022 Survey Column Chart With Key Insights Sample PDF
This slide depicts survey chart for people traveling in 2022 to understand post covid travelling preferences. It includes parts such as reasons and travelling percentage rate.Pitch your topic with ease and precision using this People Travelling Reasons 2022 Survey Column Chart With Key Insights Sample PDF. This layout presents information on Visits Relatives, Leisure Trips, Personal Business. It is also available for immediate download and adjustment. So, changes can be made in the color, design, graphics or any other component to create a unique layout.
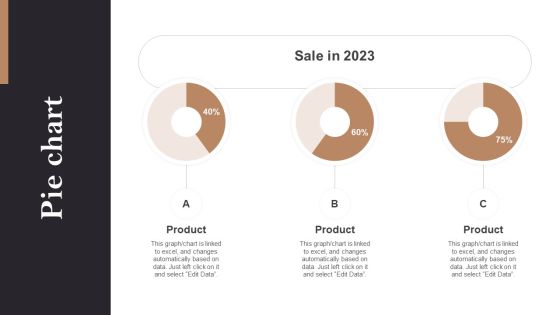
Pie Chart Opening Retail Store In Untapped Industry For Sales Growth Information PDF
Do you have an important presentation coming up Are you looking for something that will make your presentation stand out from the rest Look no further than Pie Chart Opening Retail Store In Untapped Industry For Sales Growth Information PDF. With our professional designs, you can trust that your presentation will pop and make delivering it a smooth process. And with Slidegeeks, you can trust that your presentation will be unique and memorable. So why wait Grab Pie Chart Opening Retail Store In Untapped Industry For Sales Growth Information PDF today and make your presentation stand out from the rest.
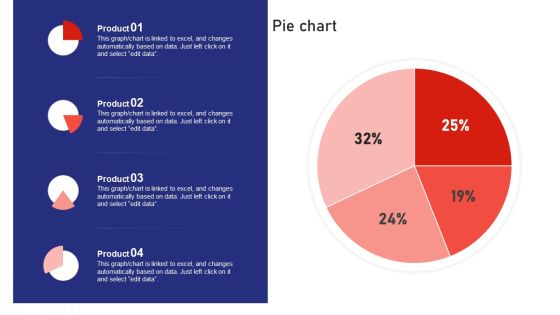
Sales Risk Assessment Profit Maximization Team Performance Enhancement Pie Chart Clipart PDF
Do you have an important presentation coming up Are you looking for something that will make your presentation stand out from the rest Look no further than Sales Risk Assessment Profit Maximization Team Performance Enhancement Pie Chart Clipart PDF. With our professional designs, you can trust that your presentation will pop and make delivering it a smooth process. And with Slidegeeks, you can trust that your presentation will be unique and memorable. So why wait Grab Sales Risk Assessment Profit Maximization Team Performance Enhancement Pie Chart Clipart PDF today and make your presentation stand out from the rest.

Diverging Arrow Process Project Activity Diagram Ppt Radial Chart PowerPoint Slides
We present our diverging arrow process project activity diagram ppt Radial Chart PowerPoint Slides.Use our Arrows PowerPoint Templates because this slide illustrates your thoughts and experiences to your staff. Present our Flow Charts PowerPoint Templates because there are a bucketful of brilliant ideas swirling around within your group. Present our Process and Flows PowerPoint Templates because Our PowerPoint Templates and Slides will give you great value for your money. Be assured of finding the best projection to highlight your words. Download and present our Business PowerPoint Templates because the fruits of your labour are beginning to show.Enlighten them on the great plans you have for their enjoyment. Use our Shapes PowerPoint Templates because stable ideas are the building blocks of a sucessful structure.Use these PowerPoint slides for presentations relating to Arrow, art, artistic,background, caricature, chart, childish,circular, creative, design, diagram,doodle, draw, flow, graffiti, graphic,grunge, hand, handwritten, icon,illustration, image, isolated, object, pie, pieces, process, raster,report, retro, rough, scribble, segmented, simple, sketch, sketchy, slices,statistic, styling, succeed, success,symbol. The prominent colors used in the PowerPoint template are Blue navy, Black, Gray. Professionals tell us our diverging arrow process project activity diagram ppt Radial Chart PowerPoint Slides are Flirty. People tell us our caricature PowerPoint templates and PPT Slides are Bold. The feedback we get is that our diverging arrow process project activity diagram ppt Radial Chart PowerPoint Slides are Stylish. Presenters tell us our circular PowerPoint templates and PPT Slides are Clever. You can be sure our diverging arrow process project activity diagram ppt Radial Chart PowerPoint Slides are Energetic. PowerPoint presentation experts tell us our creative PowerPoint templates and PPT Slides are Great.
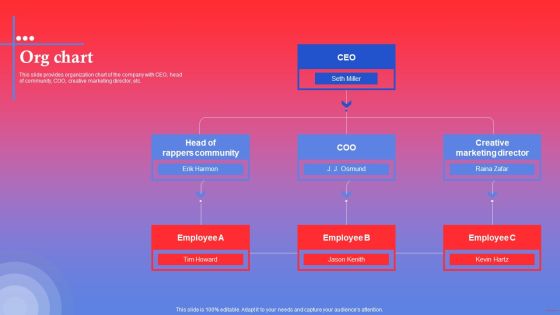
Rapping Platform Investor Funding Elevator Pitch Deck Org Chart Inspiration PDF
This slide provides organization chart of the company with CEO, head of community, COO, creative marketing director, etc. Welcome to our selection of the Rapping Platform Investor Funding Elevator Pitch Deck Org Chart Inspiration PDF. These are designed to help you showcase your creativity and bring your sphere to life. Planning and Innovation are essential for any business that is just starting out. This collection contains the designs that you need for your everyday presentations. All of our PowerPoints are 100 percent editable, so you can customize them to suit your needs. This multi purpose template can be used in various situations. Grab these presentation templates today.

Project Management Under Supervision Project Management Team Structure Chart Download PDF
The chart illustrates the hierarchical structure of the team that will undertake the project. Presenting project management under supervision project management team structure chart download pdf to provide visual cues and insights. Share and navigate important information on three stages that need your due attention. This template can be used to pitch topics like technical director, marine project manager, integration and manufacture manager, project director, project manager. In addtion, this PPT design contains high resolution images, graphics, etc, that are easily editable and available for immediate download.
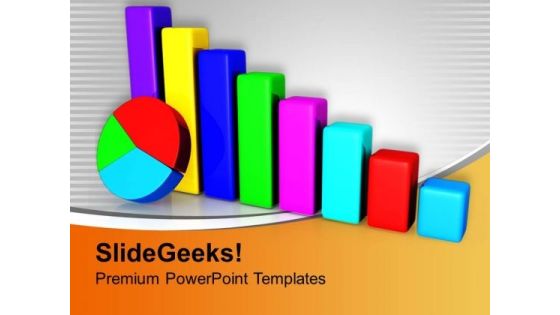
Colorful Bar Graph Pie Chart Finance PowerPoint Templates Ppt Backgrounds For Slides 0313
We present our Colorful Bar Graph Pie Chart Finance PowerPoint Templates PPT Backgrounds For Slides 0313.Download and present our Pie Charts PowerPoint Templates because You aspire to touch the sky with glory. Let our PowerPoint Templates and Slides provide the fuel for your ascent. Present our Business PowerPoint Templates because Our PowerPoint Templates and Slides are topically designed to provide an attractive backdrop to any subject. Use our Marketing PowerPoint Templates because They will bring a lot to the table. Their alluring flavours will make your audience salivate. Download our Shapes PowerPoint Templates because You can Stir your ideas in the cauldron of our PowerPoint Templates and Slides. Cast a magic spell on your audience. Download and present our Success PowerPoint Templates because It will mark the footprints of your journey. Illustrate how they will lead you to your desired destination.Use these PowerPoint slides for presentations relating to Chart pie and bar business chart in vector, pie charts, business, marketing, shapes, success. The prominent colors used in the PowerPoint template are Green, Red, Yellow.

Circular Stages 9 Converging And Diverging Flow Layout Chart PowerPoint Templates
We present our circular stages 9 converging and diverging Flow Layout Chart PowerPoint templates.Present our Ring charts PowerPoint Templates because this layout helps you to see satisfaction spread across the room as they unravel your gifted views. Present our Marketing PowerPoint Templates because networking is an imperative in todays world. You need to access the views of others. Similarly you need to give access to them of your abilities. Download and present our Arrows PowerPoint Templates because you can Ring them out loud with your brilliant ideas. Present our Shapes PowerPoint Templates because they will help you to organise the logic of your views. Use our Business PowerPoint Templates because you are ready to flap your wings and launch off. All poised are you to touch the sky with glory.Use these PowerPoint slides for presentations relating to Around, arrow, business, chart, circle, circular, circulation, commerce, concept, curving, cycle, diagram, direction,element, finance, financial, flow, flowchart, flowing, global, globe, investment, market, motion, movement, moving, presentation, process, recession, recycle, repeat, repetitive, ring, rotation, round, savings, shape, shipping, spinning, step, structure, symbol. The prominent colors used in the PowerPoint template are Blue light, Black, Gray. People tell us our circular stages 9 converging and diverging Flow Layout Chart PowerPoint templates are Luxurious. We assure you our concept PowerPoint templates and PPT Slides are Magnificent. PowerPoint presentation experts tell us our circular stages 9 converging and diverging Flow Layout Chart PowerPoint templates will impress their bosses and teams. You can be sure our concept PowerPoint templates and PPT Slides are Festive. Professionals tell us our circular stages 9 converging and diverging Flow Layout Chart PowerPoint templates are Flirty. Use our circle PowerPoint templates and PPT Slides are Pleasant.

Chart Illustrating The Various Steps Of New Business Funding Ppt PowerPoint Presentation Show Gridlines PDF
Showcasing this set of slides titled chart illustrating the various steps of new business funding ppt powerpoint presentation show gridlines pdf. The topics addressed in these templates are friend, family investment, business angels accelerators, next phase is categorized into following. All the content presented in this PPT design is completely editable. Download it and make adjustments in colour, background, font etc. as per your unique business setting.
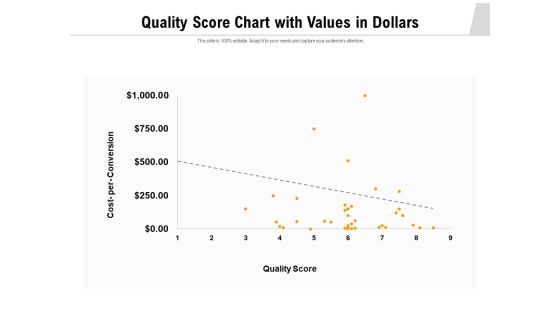
Quality Score Chart With Values In Dollars Ppt PowerPoint Presentation Ideas Graphics Template PDF
Showcasing this set of slides titled quality score chart with values in dollars ppt powerpoint presentation ideas graphics template pdf. The topics addressed in these templates are quality score, cost per conversion. All the content presented in this PPT design is completely editable. Download it and make adjustments in color, background, font etc. as per your unique business setting.

Business Chart Indicating Major Outsourcing Advantages Ppt PowerPoint Presentation File Template PDF
Showcasing this set of slides titled business chart indicating major outsourcing advantages ppt powerpoint presentation file template pdf. The topics addressed in these templates are cost, business, service. All the content presented in this PPT design is completely editable. Download it and make adjustments in color, background, font etc. as per your unique business setting.
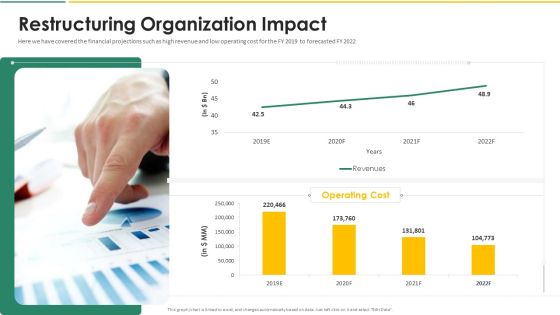
Organization Chart And Corporate Model Transformation Restructuring Organization Impact Structure PDF
Here we have covered the financial projections such as high revenue and low operating cost for the FY 2019 to forecasted FY 2022. Deliver and pitch your topic in the best possible manner with this organization chart and corporate model transformation restructuring organization impact structure pdf. Use them to share invaluable insights on restructuring organization impact and impress your audience. This template can be altered and modified as per your expectations. So, grab it now.

Executing Risk Mitigation Functional Chart Of Risk Management Team Designs PDF
The following slide exhibits the org chat of risk stakeholders in the real estate company. The key stakeholders mentioned in the slide are subject matter experts, sponsor, project manager, risk owners, enterprise risk management team, scheduler, project management office PMO etc. From laying roadmaps to briefing everything in detail, our templates are perfect for you. You can set the stage with your presentation slides. All you have to do is download these easy-to-edit and customizable templates. Executing Risk Mitigation Functional Chart Of Risk Management Team Designs PDF will help you deliver an outstanding performance that everyone would remember and praise you for. Do download this presentation today.

Decision Making Flow Chart For Construction A Building Ppt Outline Background Designs PDF
This slide covers the information related to the construction project for making a building with the decisions taking by them for the same. It includes various steps through which an employee has to go through before finalizing his decision. Presenting Decision Making Flow Chart For Construction A Building Ppt Outline Background Designs PDF to dispense important information. This template comprises one stages. It also presents valuable insights into the topics including Specific Features, Project, Preferred Alternative. This is a completely customizable PowerPoint theme that can be put to use immediately. So, download it and address the topic impactfully.

Data Analysis Chart For Funds Management Ppt PowerPoint Presentation Infographic Template Files
This is a data analysis chart for funds management ppt powerpoint presentation infographic template files. This is a five stage process. The stages in this process are financial analysis, quantitative, statistical modelling.

Decision Making Flow Chart For Business Optimization Ppt Show Images PDF
This slide covers the information related to the business optimization and the steps through which a company come to a decision . It includes the strategies that are followed by the company for achieving the target. Persuade your audience using this Decision Making Flow Chart For Business Optimization Ppt Show Images PDF. This PPT design covers one stages, thus making it a great tool to use. It also caters to a variety of topics including Services, And Customers, Product, Minimize Cost. Download this PPT design now to present a convincing pitch that not only emphasizes the topic but also showcases your presentation skills.

Five Stages Agorithm Of Procedure Design Process Flow Chart PowerPoint Slides
We present our five stages agorithm of procedure design process flow chart PowerPoint Slides.Present our Arrows PowerPoint Templates because all elements of the venture are equally critical. Use our Shapes PowerPoint Templates because you can outline your targets to your team. Download our Business PowerPoint Templates because this layout helps you to bring some important aspects of your business process to the notice of all concerned. Streamline the flow of information across the board. Use our Circle Charts PowerPoint Templates because this diagram provides range of options to garner your interest. Present our Process and Flows PowerPoint Templates because you should explain the process by which you intend to right it.Use these PowerPoint slides for presentations relating to 3d, action, algorithm, algorithmic, arrow, automatic, automation, block, calculation, chart, computer, cycle, development, diagram, digital, engineering, flow, flowchart, informatics, information, logic, mathematical, mathematics, operation, plan, procedure, process, program, programme, programming, scheme, science, software, solve, task, technology. The prominent colors used in the PowerPoint template are Red, Gray, White. The feedback we get is that our five stages agorithm of procedure design process flow chart PowerPoint Slides are Nifty. PowerPoint presentation experts tell us our arrow PowerPoint templates and PPT Slides help you meet deadlines which are an element of today's workplace. Just browse and pick the slides that appeal to your intuitive senses. People tell us our five stages agorithm of procedure design process flow chart PowerPoint Slides are Sparkling. Professionals tell us our calculation PowerPoint templates and PPT Slides look good visually. You can be sure our five stages agorithm of procedure design process flow chart PowerPoint Slides are Ritzy. We assure you our arrow PowerPoint templates and PPT Slides are Adorable.

Business Process Flow Chart Example Diagram To Visualize Projects PowerPoint Templates
We present our business process flow chart example diagram to visualize projects PowerPoint templates.Download our Circle Charts PowerPoint Templates because Our PowerPoint Templates and Slides have the Brilliant backdrops. Guaranteed to illuminate the minds of your audience. Download our Business PowerPoint Templates because You aspire to touch the sky with glory. Let our PowerPoint Templates and Slides provide the fuel for your ascent. Use our Shapes PowerPoint Templates because Our PowerPoint Templates and Slides are Clear and concise. Use them and dispel any doubts your team may have. Present our Flow Charts PowerPoint Templates because Our PowerPoint Templates and Slides will provide weight to your words. They will bring out the depth of your thought process. Download and present our Process and Flows PowerPoint Templates because You have a driving passion to excel in your field. Our PowerPoint Templates and Slides will prove ideal vehicles for your ideas.Use these PowerPoint slides for presentations relating to Art, beautiful, celebration, circle, color, cottontail, crowd, decoration, design, element, frame, illustration, image, international, isolated, ornament, pattern, precious, present, red, reflection, silhouette, symbol, traditional, white, yellow . The prominent colors used in the PowerPoint template are Red, Gray, White.

BI Solutions Process And Data Complexity Chart Ppt PowerPoint Presentation File Professional PDF
Showcasing this set of slides titled bi solutions process and data complexity chart ppt powerpoint presentation file professional pdf. The topics addressed in these templates are process, project duration, date complexity. All the content presented in this PPT design is completely editable. Download it and make ajustments in color, background, font etc. as per your unique business setting.

3d Stages Of Process Analysis 8 Concepts Circular Flow Chart PowerPoint Slides
We present our 3d stages of process analysis 8 concepts Circular Flow Chart PowerPoint Slides.Use our Business PowerPoint Templates because it helps you to project your enthusiasm and single mindedness to your colleagues. Present our Circle Charts PowerPoint Templates because you should explain the process by which you intend to right it. Present our Shapes PowerPoint Templates because it outlines the process with this innovative graphic to authenticate your plan of achieving the goal of added value/profit. Present our Process and Flows PowerPoint Templates because it shows how one can contribute to the overall feeling of well-being. Download our Success PowerPoint Templates because iT outlines the entire thought process for the benefit of others. Tell it to the world with your characteristic aplomb.Use these PowerPoint slides for presentations relating to Abstract, arrow,blank, business, chart, circle, concept,connection, cycle, development,diagram, direction, element,environment, exchange, finance,financial, flow, graph, graphic, graphicpresentation, group, icon, illustration,investment, isolated, isometric, market,motion, movement, organization, p perspective, presentation,process, processchart, recycle, report,ring, sign, step, stock, success, symbol. The prominent colors used in the PowerPoint template are Blue light, Gray, White. The feedback we get is that our 3d stages of process analysis 8 concepts Circular Flow Chart PowerPoint Slides are Enchanting. The feedback we get is that our concept PowerPoint templates and PPT Slides are Clever. Presenters tell us our 3d stages of process analysis 8 concepts Circular Flow Chart PowerPoint Slides are Vintage. The feedback we get is that our blank PowerPoint templates and PPT Slides are Clever. PowerPoint presentation experts tell us our 3d stages of process analysis 8 concepts Circular Flow Chart PowerPoint Slides are Adorable. Customers tell us our concept PowerPoint templates and PPT Slides are Ultra.

Five Stages Agorithm Of Procedure Business Flow Chart Description PowerPoint Templates
We present our five stages agorithm of procedure business flow chart description PowerPoint templates.Download and present our Arrows PowerPoint Templates because this diagram helps you to show goal also clearly etched in your mind. Download our Shapes PowerPoint Templates because you have the people in place, selected the team leaders and all are raring to go. Download our Business PowerPoint Templates because this slide will fire away with all the accuracy at your command. Download and present our Circle Charts PowerPoint Templates because profit is fairly earned in what you believe. Present our Process and Flows PowerPoint Templates because this slide illuminates the spiritual brilliance of Jesus and showers the love for mankind he showed even while being crucified.Use these PowerPoint slides for presentations relating to 3d, action, algorithm, algorithmic, arrow, automatic, automation, block, calculation, chart, computer, cycle, development, diagram, digital, engineering, flow, flowchart, informatics, information, logic, mathematical, mathematics, operation, plan, procedure, process, program, programme, programming, scheme, science, software, solve, task, technology. The prominent colors used in the PowerPoint template are Green, Gray, White. The feedback we get is that our five stages agorithm of procedure business flow chart description PowerPoint templates are Dynamic. PowerPoint presentation experts tell us our algorithmic PowerPoint templates and PPT Slides are Graceful. People tell us our five stages agorithm of procedure business flow chart description PowerPoint templates are Playful. Professionals tell us our arrow PowerPoint templates and PPT Slides are Precious. You can be sure our five stages agorithm of procedure business flow chart description PowerPoint templates are Ritzy. We assure you our calculation PowerPoint templates and PPT Slides are Dazzling.

Trend Of Quarterly Funding For Start Up Project Performance Chart Graphics PDF
This slide depicts investment made in different start up projects for 2 years. It also includes the investment amount, funding quarters in graphical form with a trend line and insights. Pitch your topic with ease and precision using this Trend Of Quarterly Funding For Start Up Project Performance Chart Graphics PDF. This layout presents information on Good Management, Efficient Team, Investment Decreased. It is also available for immediate download and adjustment. So, changes can be made in the color, design, graphics or any other component to create a unique layout.

Decision Making Flow Chart For Product Launch Ppt Infographic Template Picture PDF
This slide contains the information related to the process of launching a project and making the decisions accordingly to make this launch a huge success for the business. Presenting Decision Making Flow Chart For Product Launch Ppt Infographic Template Picture PDF to dispense important information. This template comprises one stages. It also presents valuable insights into the topics including Generate Idea, Manufacture, Marketing, Advertising. This is a completely customizable PowerPoint theme that can be put to use immediately. So, download it and address the topic impactfully.

Strawman Project Action Plan Organizational Chart With Key People Involved Slides PDF
This slide presents the organizational structure of the firm with key people involved in managing firm. This is a strawman project action plan organizational chart with key people involved slides pdf template with various stages. Focus and dispense information on three stages using this creative set, that comes with editable features. It contains large content boxes to add your information on topics like organizational chart with key people involved. You can also showcase facts, figures, and other relevant content using this PPT layout. Grab it now.

Volume Open High Low Close Chart Ppt PowerPoint Presentation Model Ideas
This is a volume open high low close chart ppt powerpoint presentation model ideas. This is a five stage process. The stages in this process are finance, marketing, analysis, business, investment.

Developing Implementing Strategic HRM Plans Bar Chart Template Ppt File Slides PDF
Presenting this set of slides with name developing implementing strategic hrm plans bar chart template ppt file slides pdf. The topics discussed in these slides are product 1, product 2. This is a completely editable PowerPoint presentation and is available for immediate download. Download now and impress your audience.
Guide Map Employee Experience Workplace Bar Chart Template Ppt Gallery Icons PDF
Presenting this set of slides with name guide map employee experience workplace bar chart template ppt gallery icons pdf. The topics discussed in these slides are product 1, product 2. This is a completely editable PowerPoint presentation and is available for immediate download. Download now and impress your audience.

Staff Task Completion Daily Chart Analysis Ppt PowerPoint Presentation Model Objects PDF
Presenting this set of slides with name staff task completion daily chart analysis ppt powerpoint presentation model objects pdf. The topics discussed in these slides are opportunity win rate, opportunity win rate, record count, assigned. This is a completely editable PowerPoint presentation and is available for immediate download. Download now and impress your audience.
 Home
Home