Budget Chart
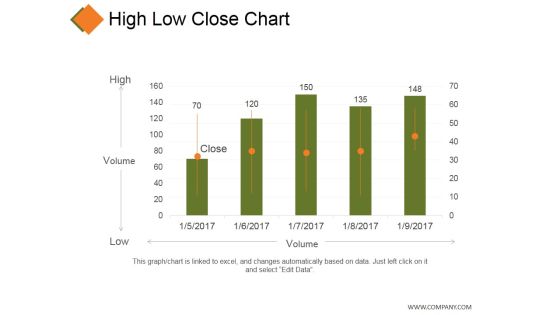
High Low Close Chart Ppt PowerPoint Presentation Model Grid
This is a high low close chart ppt powerpoint presentation model grid. This is a five stage process. The stages in this process are business, high, volume, low, marketing.

Donut Pie Chart Ppt PowerPoint Presentation Inspiration Background Image
This is a donut pie chart ppt powerpoint presentation inspiration background image. This is a three stage process. The stages in this process are product, percentage, business, marketing, process.
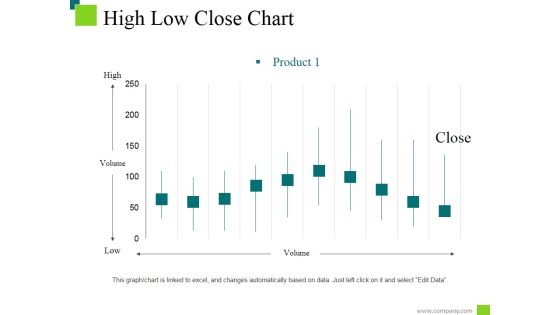
High Low Close Chart Ppt PowerPoint Presentation Styles Information
This is a high low close chart ppt powerpoint presentation styles information. This is a ten stage process. The stages in this process are low, high, product, volume, close.
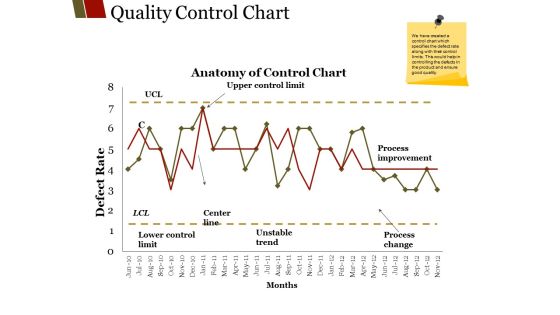
Quality Control Chart Ppt PowerPoint Presentation File Graphics Design
This is a quality control chart ppt powerpoint presentation file graphics design. This is a two stage process. The stages in this process are unstable trend, months center line, lower control limit, process improvement.
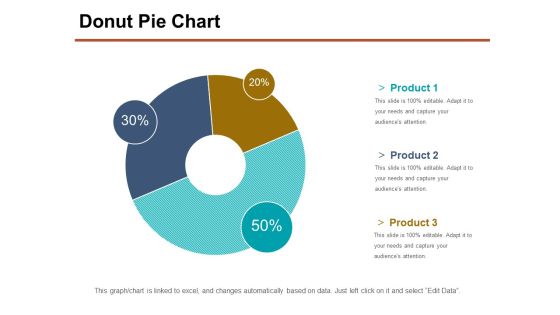
Donut Pie Chart Ppt PowerPoint Presentation Professional Slide Portrait
This is a donut pie chart ppt powerpoint presentation professional slide portrait. This is a three stage process. The stages in this process are product, percentage, business, management, process.
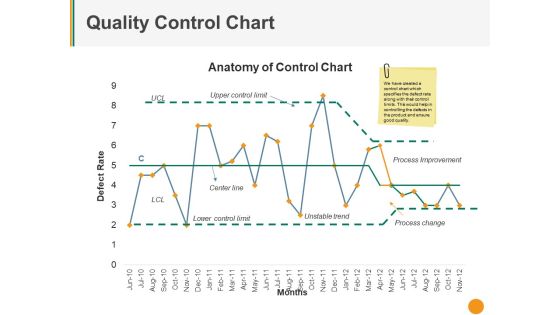
Quality Control Chart Ppt PowerPoint Presentation Pictures Deck
This is a quality control chart ppt powerpoint presentation pictures deck. This is a one stage process. The stages in this process are upper control limit, center line, unstable trend, process improvement, process change.
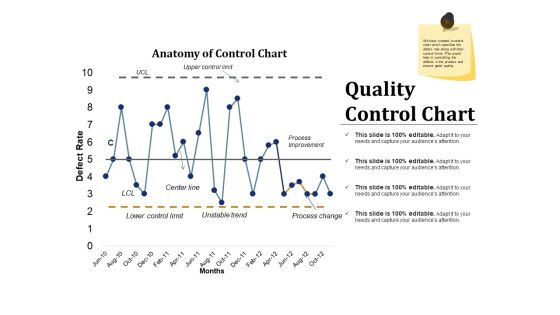
Quality Control Chart Ppt PowerPoint Presentation Inspiration Example Introduction
This is a quality control chart ppt powerpoint presentation inspiration example introduction. This is a two stage process. The stages in this process are process improvement, process change, unstable trend, lower control limit, center line.

Bar Chart Ppt PowerPoint Presentation Infographic Template Graphics Design
This is a bar chart ppt powerpoint presentation infographic template graphics design. This is a five stage process. The stages in this process are management, marketing, business, percentage, product.
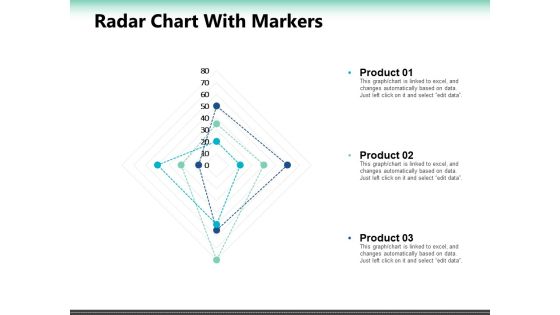
Radar Chart With Markers Ppt PowerPoint Presentation Summary Slide Portrait
This is a radar chart with markers ppt powerpoint presentation summary slide portrait. This is a seven stage process. The stages in this process are percentage, product, business, marketing.

Cash Payment Management Flow Chart Ppt PowerPoint Presentation Styles Professional
This is a cash payment management flow chart ppt powerpoint presentation styles professional. This is a seven stage process. The stages in this process are liquidity, cash assets, solvency.

Gantt Chart Events Ppt PowerPoint Presentation Portfolio Graphics
Make a highly optimized project management report using this content-ready Gantt Chart PPT Diagram. Effortless yet very clear, this layout proves a useful tool to present the professional details of a task or activity. Showcase the activities and allotted time to the business executives with this Gantt Chart PowerPoint theme. List down the column tasks in various timeframes and the activities associated with each of them here. Further, plot time allocation for various tasks, monitor their actual time and make comparisons to interpret the final progress with this well-structured Gantt Chart Excel Template. You can add all the significant details of a particular project in this chart and showcase it to all the project members so that they can participate in the overall development. Not only this but also our PPT template can help you showcase the work breakdown structure of your project.
Gantt Chart Ppt PowerPoint Presentation Model Design Inspiration
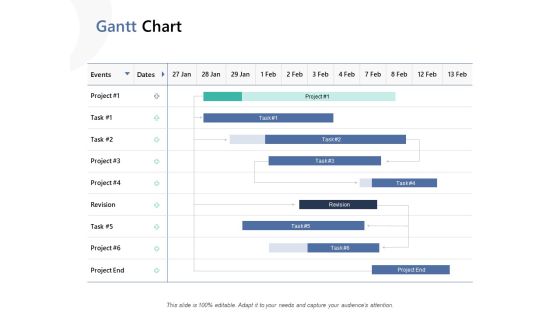
Make a highly optimized project management report using this content-ready Gantt Chart PPT Diagram. Effortless yet very clear, this layout proves a useful tool to present the professional details of a task or activity. Showcase the activities and allotted time to the business executives with this Gantt Chart PowerPoint theme. List down the column tasks in various timeframes and the activities associated with each of them here. Further, plot time allocation for various tasks, monitor their actual time and make comparisons to interpret the final progress with this well-structured Gantt Chart Excel Template. You can add all the significant details of a particular project in this chart and showcase it to all the project members so that they can participate in the overall development. Not only this but also our PPT template can help you showcase the work breakdown structure of your project.

Gantt Chart Ppt PowerPoint Presentation Infographic Template Influencers
Make a highly optimized project management report using this content-ready Gantt Chart PPT Diagram. Effortless yet very clear, this layout proves a useful tool to present the professional details of a task or activity. Showcase the activities and allotted time to the business executives with this Gantt Chart PowerPoint theme. List down the column tasks in various timeframes and the activities associated with each of them here. Further, plot time allocation for various tasks, monitor their actual time and make comparisons to interpret the final progress with this well-structured Gantt Chart Excel Template. You can add all the significant details of a particular project in this chart and showcase it to all the project members so that they can participate in the overall development. Not only this but also our PPT template can help you showcase the work breakdown structure of your project.

Business Coaching Gantt Chart Ppt PowerPoint Presentation Layouts Files PDF
Make a highly optimized project management report using this content-ready Gantt Chart PPT Diagram. Effortless yet very clear, this layout proves a useful tool to present the professional details of a task or activity. Showcase the activities and allotted time to the business executives with this Gantt Chart PowerPoint theme. List down the column tasks in various timeframes and the activities associated with each of them here. Further, plot time allocation for various tasks, monitor their actual time and make comparisons to interpret the final progress with this well-structured Gantt Chart Excel Template. You can add all the significant details of a particular project in this chart and showcase it to all the project members so that they can participate in the overall development. Not only this but also our PPT template can help you showcase the work breakdown structure of your project.

Network Planning And Analysis Chart Powerpoint Slides Designs Download
This is a network planning and analysis chart powerpoint slides designs download. This is a six stage process. The stages in this process are equipment planning, proof of concept, project execution, configuration, installation, gap and root cause analysis.
Growth Chart Of Pound Currency Value Powerpoint Template
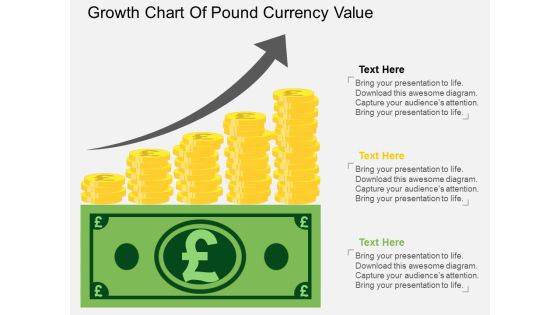
The above PPT template displays growth chart of Pound currency. This diagram helps to exhibit Pound currency value growth. Adjust the above diagram in your business presentations to visually support your content.
High Low Close Chart Ppt PowerPoint Presentation Summary Ideas
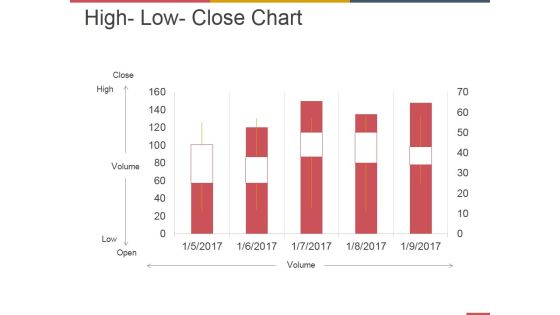
This is a high low close chart ppt powerpoint presentation summary ideas. This is a five stage process. The stages in this process are business, strategy, marketing, analysis, growth.
Stakeholders Needs Development Cycle Chart Example Of Ppt
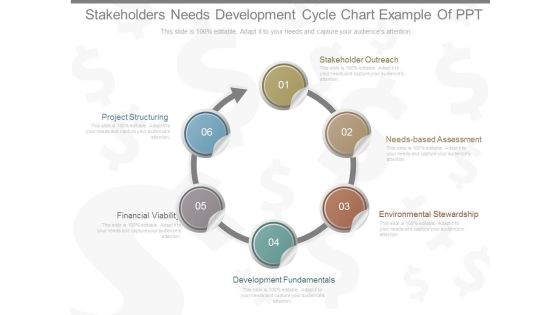
This is a stakeholders needs development cycle chart example of ppt. This is a six stage process. The stages in this process are stakeholder outreach, needs based assessment, environmental stewardship,, development fundamentals, financial viability, project structuring.

Business Development Skills Business Development Skills Chart Slides
This is a business development skills business development skills chart slides. This is a eleven stage process. The stages in this process are entrepreneur, strategies, commercial, project, leadership, marketing, international, innovation, gestation, management, developer.
Pie Chart Icon For Yearly Earning Breakup Portrait PDF
Persuade your audience using this Pie Chart Icon For Yearly Earning Breakup Portrait PDF. This PPT design covers Three stages, thus making it a great tool to use. It also caters to a variety of topics including Pie Chart Icon, Yearly Earning Breakup. Download this PPT design now to present a convincing pitch that not only emphasizes the topic but also showcases your presentation skills.

5 Reinforcing Components Arrow Diagram Chart Business Prototyping PowerPoint Slides
We present our 5 reinforcing components arrow diagram chart business prototyping PowerPoint Slides.Use our Arrows PowerPoint Templates because it shows the pyramid which is a symbol of the desire to reach the top in a steady manner. Present our Business PowerPoint Templates because watch the excitement levels rise as they realise their worth. Download and present our Competition PowerPoint Templates because you know your business and have a vision for it. Use our Design PowerPoint Templates because your business and plans for its growth consist of processes that are highly co-related. Download and present our Shapes PowerPoint Templates because the atmosphere in the worplace is electric.Use these PowerPoint slides for presentations relating to arrow, arrows, block, business, chart, design, development, diagram, direction, element, flow, flowchart, graph, linear, management, organization, process, program, section, sign, solution, symbol. The prominent colors used in the PowerPoint template are Blue, Gray, Black. Professionals tell us our 5 reinforcing components arrow diagram chart business prototyping PowerPoint Slides are Efficacious. The feedback we get is that our block PowerPoint templates and PPT Slides are Appealing. We assure you our 5 reinforcing components arrow diagram chart business prototyping PowerPoint Slides are designed by professionals Customers tell us our chart PowerPoint templates and PPT Slides are Fantastic. Presenters tell us our 5 reinforcing components arrow diagram chart business prototyping PowerPoint Slides are Fun. People tell us our block PowerPoint templates and PPT Slides are Nice.

Chart For Cash Flow In Business Investment Ideas PDF
Pitch your topic with ease and precision using this chart for cash flow in business investment ideas pdf. This layout presents information on operating account, designated account, capital returns. It is also available for immediate download and adjustment. So, changes can be made in the color, design, graphics or any other component to create a unique layout.
Price Catalogue Chart Icon Of Automobile Company Demonstration PDF
Persuade your audience using this price catalogue chart icon of automobile company demonstration pdf. This PPT design covers three stages, thus making it a great tool to use. It also caters to a variety of topics including price catalogue chart icon of automobile company. Download this PPT design now to present a convincing pitch that not only emphasizes the topic but also showcases your presentation skills.
Business Framework Project Management Flow Chart PowerPoint Presentation
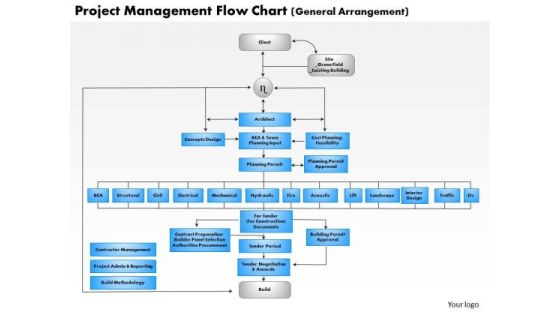
This diagram displays profitability ratio calculation template. Use this diagram in business and marketing presentations to depict profit ratio. This diagram will enhance the quality of your presentations.
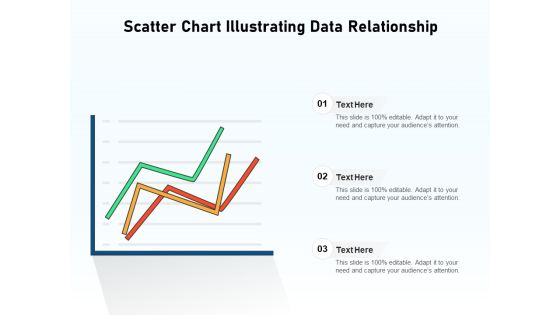
Scatter Chart Illustrating Data Relationship Ppt PowerPoint Presentation Microsoft PDF
Persuade your audience using this scatter chart illustrating data relationship ppt powerpoint presentation microsoft pdf. This PPT design covers three stages, thus making it a great tool to use. It also caters to a variety of topics including scatter chart illustrating data relationship. Download this PPT design now to present a convincing pitch that not only emphasizes the topic but also showcases your presentation skills.

Organizational Stakeholder Engagement And Management Comparative Analysis Chart Professional PDF
This slide exhibits stakeholder analysis comparative chart. It includes stakeholder name, position role, power, interest and support of stakeholders. Showcasing this set of slides titled Organizational Stakeholder Engagement And Management Comparative Analysis Chart Professional PDF. The topics addressed in these templates are Finance Manager, Operation Manager, Developer. All the content presented in this PPT design is completely editable. Download it and make adjustments in color, background, font etc. as per your unique business setting.

Cyber Computing Services Risk Analysis Software Status Chart Portrait PDF
This slide illustrates different digitally enabled cyber computing applications. It includes risk severity chart, action cost along with risk owner details and implementation due date. Showcasing this set of slides titled Cyber Computing Services Risk Analysis Software Status Chart Portrait PDF. The topics addressed in these templates are Risk Treatment, Risk Owner, Implementation. All the content presented in this PPT design is completely editable. Download it and make adjustments in color, background, font etc. as per your unique business setting.

PMP Process Chart With Progress Groups Ppt Pictures Deck PDF
Following slide displays project management process chart along with the details about progress groups namely initiating, planning, executing, monitoring and controlling and closing. Deliver an awe inspiring pitch with this creative pmp process chart with progress groups ppt pictures deck pdf bundle. Topics like management, integration, schedule can be discussed with this completely editable template. It is available for immediate download depending on the needs and requirements of the user.

RACI Chart For Launching Advertising Campaign Ideas PDF
The purpose of this template is to provide RACI chart for launching marketing campaigns . It covers information about responsible, accountable, consulted and informed team members. Pitch your topic with ease and precision using this RACI Chart For Launching Advertising Campaign Ideas PDF. This layout presents information on Project Management, Webpage Design, Tracking And Reporting. It is also available for immediate download and adjustment. So, changes can be made in the color, design, graphics or any other component to create a unique layout.

Data Visualization And Predictive Analysis Chart Ppt Slides
This is a data visualization and predictive analysis chart ppt slides. This is a nine stage process. The stages in this process are business requirement, data exploration, data selection, data preparation, design model, validate model, deploy model, analyze results, update model, revalidate.

Explain Parallel Processing 10 Stages Flow Chart PowerPoint Templates
We present our explain parallel processing 10 stages flow chart PowerPoint templates.Download and present our Business PowerPoint Templates because Our PowerPoint Templates and Slides will let Your superior ideas hit the target always and everytime. Download and present our Arrows PowerPoint Templates because Our PowerPoint Templates and Slides will steer your racing mind. Hit the right buttons and spur on your audience. Present our Shapes PowerPoint Templates because You can Stir your ideas in the cauldron of our PowerPoint Templates and Slides. Cast a magic spell on your audience. Use our Success PowerPoint Templates because Our PowerPoint Templates and Slides are focused like a searchlight beam. They highlight your ideas for your target audience. Download and present our Signs PowerPoint Templates because You will get more than you ever bargained for. Use these PowerPoint slides for presentations relating to 3d, achievement, aim, arrows, business, career, chart, competition,development, direction, education, financial, forecast, forward, glossy, graph,group, growth, higher, icon, increase, investment, leader, leadership, moving,onwards, outlook, path, plan, prediction, price, profit, progress, property, race,sales, series, success, target, team, teamwork, turn, up, upwards, vector, win,winner. The prominent colors used in the PowerPoint template are Tan, Gray, White. We assure you our explain parallel processing 10 stages flow chart PowerPoint templates are designed by professionals PowerPoint presentation experts tell us our arrows PowerPoint templates and PPT Slides will save the presenter time. The feedback we get is that our explain parallel processing 10 stages flow chart PowerPoint templates look good visually. We assure you our chart PowerPoint templates and PPT Slides have awesome images to get your point across. PowerPoint presentation experts tell us our explain parallel processing 10 stages flow chart PowerPoint templates will make you look like a winner. We assure you our arrows PowerPoint templates and PPT Slides are specially created by a professional team with vast experience. They diligently strive to come up with the right vehicle for your brilliant Ideas.
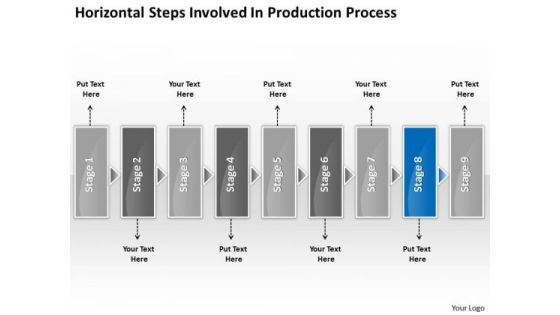
Horizontal Steps Involved Production Processs Business Fishbone Chart PowerPoint Templates
We present our horizontal steps involved production processs business fishbone chart PowerPoint templates.Download and present our Arrows PowerPoint Templates because this layout helps you to see satisfaction spread across the room as they unravel your gifted views. Use our Shapes PowerPoint Templates because you should take your team soaring to the pinnacle they crave. Present our Business PowerPoint Templates because this is the unerring accuracy in reaching the target. the effortless ability to launch into flight. Use our Boxes PowerPoint Templates because your listeners do not have to put on their thinking caps. Download our Communication PowerPoint Templates because you can gain the success to desired levels in one go.Use these PowerPoint slides for presentations relating to abstract, arrow, blank, business, chart, circular, circulation, concept, conceptual, design, diagram, executive, flow, horizontal, icon, idea, illustration, management, model, numbers, organization, process, progression, resource, sequence, stages, steps, strategy. The prominent colors used in the PowerPoint template are Blue, Gray, Black. The feedback we get is that our horizontal steps involved production processs business fishbone chart PowerPoint templates are Magnificent. PowerPoint presentation experts tell us our chart PowerPoint templates and PPT Slides are Elegant. People tell us our horizontal steps involved production processs business fishbone chart PowerPoint templates are Nice. Professionals tell us our circulation PowerPoint templates and PPT Slides are Colorful. You can be sure our horizontal steps involved production processs business fishbone chart PowerPoint templates are Fun. We assure you our concept PowerPoint templates and PPT Slides are designed by a team of presentation professionals.

Dollar Chart Business PowerPoint Themes And PowerPoint Slides 0611
Microsoft PowerPoint Theme and Slide with red and blue charts and a dollar sign with an arrow

Dollar Chart Business PowerPoint Templates And PowerPoint Backgrounds 0611
Microsoft PowerPoint Template and Background with red and blue charts and a dollar sign with an arrow
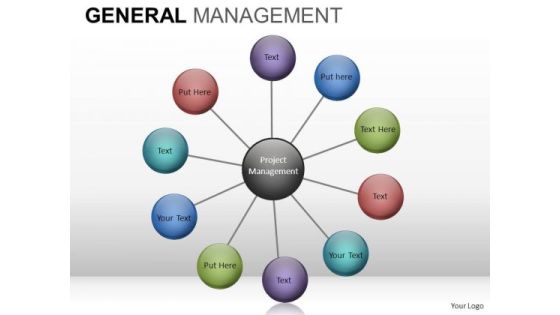
Wheel Chart Diagram PowerPoint Slides And Editable Ppt Templates Download
Wheel_Chart_Diagram_PowerPoint_slides_and_Editable_PPT_templates_Download-These high quality powerpoint pre-designed slides and powerpoint templates have been carefully created by our professional team to help you impress your audience. All slides have been created and are 100% editable in powerpoint. Each and every property of any graphic - color, size, orientation, shading, outline etc. can be modified to help you build an effective powerpoint presentation. Any text can be entered at any point in the powerpoint template or slide. Simply DOWNLOAD, TYPE and PRESENT! These PowerPoint presentation slides can be used to represent themes relating to --Abstract, action, analysis, blank, business, chart, clipart, commerce, concept, conceptual, design, diagram, direction, flow, generic, goals, guide, guidelines, heirarchy, icon, idea, illustration, lingakes, links, manage, management, mba, model, organization, performance, plan, process, project, relationship, representation, resource, steps, strategy, success, tactics, theoretical, theory, tool, workflow-Wheel_Chart_Diagram_PowerPoint_slides_and_Editable_PPT_templates_Download
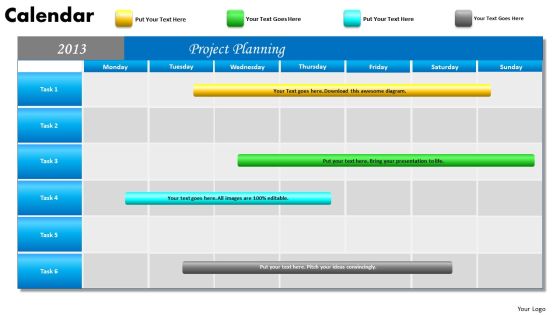
Project Planning Gantt Chart 2013 Calendar PowerPoint Slides Ppt Templates
We present our Project Planning Gantt Chart 2013 Calendar PowerPoint Slides PPT templates.Download and present our Calendars PowerPoint Templates because this slide depicts the occasion for gifting and giving. Present our New Year PowerPoint Templates because our templates emphasises your views. Use our Timelines PowerPoint Templates because this one depicts the popular chart. Use our Targets PowerPoint Templates because you can asked to strive to give true form to your great dream. Use our Time Planning PowerPoint Templates because you can Help your viewers automatically emphathise with your thoughts.Use these PowerPoint slides for presentations relating to 2013, Abstract, Agenda, Annual, April, Background, Book, Business, Calendar, Calendar, Content, Date, Day, Design, Desk, Diary, Document, Editable, Element, Eps10, Graphic, Green, Icon, Illustration, Layout, Monday, Month, Monthly, New, Note, Notepaper, Number, Old, Organizer, Paper, Plan, Planner. The prominent colors used in the PowerPoint template are Blue, Green, Yellow. PowerPoint presentation experts tell us our Project Planning Gantt Chart 2013 Calendar PowerPoint Slides PPT templates are Amazing. You can be sure our April PowerPoint templates and PPT Slides will make the presenter look like a pro even if they are not computer savvy. Presenters tell us our Project Planning Gantt Chart 2013 Calendar PowerPoint Slides PPT templates are Ritzy. We assure you our Calendar PowerPoint templates and PPT Slides are Tranquil. Professionals tell us our Project Planning Gantt Chart 2013 Calendar PowerPoint Slides PPT templates are Nice. The feedback we get is that our Business PowerPoint templates and PPT Slides are Tranquil.

Human Resource Value Chain Chart Showing Impact Slides PDF
This slide shows HR value chain chart to show value addition in organizational goals. It includes elements such as process, effectiveness, and impact. Persuade your audience using this Human Resource Value Chain Chart Showing Impact Slides PDF. This PPT design covers three stages, thus making it a great tool to use. It also caters to a variety of topics including Process, Effectivenes, Impact. Download this PPT design now to present a convincing pitch that not only emphasizes the topic but also showcases your presentation skills.

Leverage Securities Estimation Chart Ppt PowerPoint Presentation File Format
Presenting this set of slides with name leverage securities estimation chart ppt powerpoint presentation file format. The topics discussed in these slides are marketing, process, management, planning, strategy. This is a completely editable PowerPoint presentation and is available for immediate download. Download now and impress your audience.

Column Chart Finance Marketing Ppt PowerPoint Presentation Inspiration Graphic Images
Presenting this set of slides with name column chart finance marketing ppt powerpoint presentation inspiration graphic images. The topics discussed in these slides are finance, marketing, management, investment, analysis. This is a completely editable PowerPoint presentation and is available for immediate download. Download now and impress your audience.
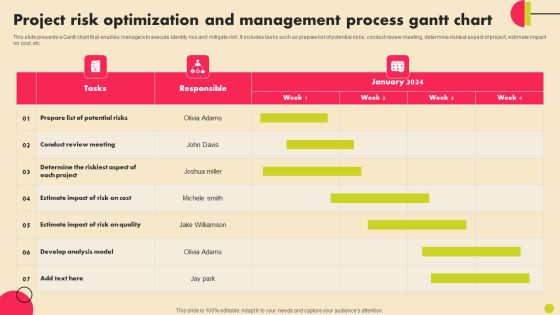
Project Risk Optimization And Management Process Gantt Chart Introduction PDF
This slide presents a Gantt chart that enables managers to execute identity risk and mitigate risk. It includes tasks such as prepare list of potential risks, conduct review meeting, determine riskiest aspect of project, estimate impact on cost, etc. Pitch your topic with ease and precision using this Project Risk Optimization And Management Process Gantt Chart Introduction PDF. This layout presents information on Determine, Develop Analysis Model, Potential Risks. It is also available for immediate download and adjustment. So, changes can be made in the color, design, graphics or any other component to create a unique layout.
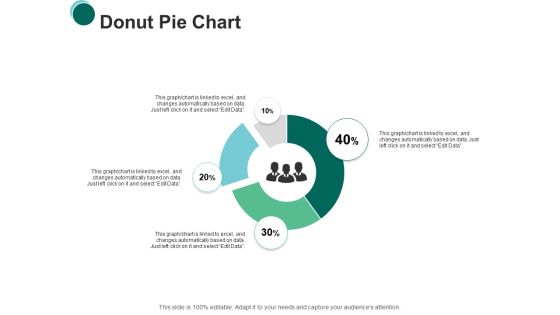
Donut Pie Chart Finance Ppt PowerPoint Presentation Infographics Slides
Presenting this set of slides with name donut pie chart finance ppt powerpoint presentation infographics slides. This is a four stage process. The stages in this process are finance, marketing, management, investment, analysis. This is a completely editable PowerPoint presentation and is available for immediate download. Download now and impress your audience.

Construction Project Administration Strategy With Gantt Chart Topics PDF
This slide covers a Gantt Chart which will help project leaders in tracking the status of the tasked involved in the project. It also includes project name, start date, end date, projects assigned to and percentage of task completion.Pitch your topic with ease and precision using this Construction Project Administration Strategy With Gantt Chart Topics PDF. This layout presents information on Estimate Complete, Basement Demolition, Contract Signed. It is also available for immediate download and adjustment. So, changes can be made in the color, design, graphics or any other component to create a unique layout.
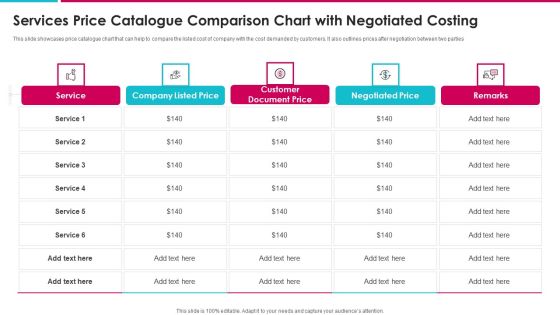
Services Price Catalogue Comparison Chart With Negotiated Costing Topics PDF
This slide showcases price catalogue chart that can help to compare the listed cost of company with the cost demanded by customers. It also outlines prices after negotiation between two parties Pitch your topic with ease and precision using this services price catalogue comparison chart with negotiated costing topics pdf. This layout presents information on service, company listed price, customer document price, negotiated price. It is also available for immediate download and adjustment. So, changes can be made in the color, design, graphics or any other component to create a unique layout.

Company Product Sales Forecast Chart Ppt Gallery Design Templates PDF
This slide shows the Product sales forecast table with Product names along with price per unit and total units sold for the current as well as the projected period till the year 2023. Deliver and pitch your topic in the best possible manner with this company product sales forecast chart ppt gallery design templates pdf. Use them to share invaluable insights on active sports wear, gaming consoles, deodorants, product and impress your audience. This template can be altered and modified as per your expectations. So, grab it now.

Two Layered Venn Diagram Cycle Chart PowerPoint Slides
We present our two layered venn diagram Cycle Chart PowerPoint Slides.Use our Marketing PowerPoint Templates because Our PowerPoint Templates and Slides will let you Clearly mark the path for others to follow. Present our Business PowerPoint Templates because maximising sales of your product is the intended destination. Use our Shapes PowerPoint Templates because you know what it takes to keep it fit and healthy. Use our Finance PowerPoint Templates because you envisage some areas of difficulty in the near future. The overall financial situation could be a source of worry. Download our Symbol PowerPoint Templates because this helps you to put all your brilliant views to your audience.Use these PowerPoint slides for presentations relating to Background, Black, Blue, Business, Chart, Circle, Diagram, Drop, Financial, Green, Icon, Isolated, Overlapping, Process, Red, Round, Shadow, Shape, Three, Transparency, Vector, Venn, White. The prominent colors used in the PowerPoint template are Blue, Green, Black. We assure you our two layered venn diagram Cycle Chart PowerPoint Slides are Awesome. Customers tell us our Diagram PowerPoint templates and PPT Slides are Attractive. The feedback we get is that our two layered venn diagram Cycle Chart PowerPoint Slides are Luxuriant. We assure you our Business PowerPoint templates and PPT Slides are Amazing. People tell us our two layered venn diagram Cycle Chart PowerPoint Slides are Excellent. We assure you our Blue PowerPoint templates and PPT Slides are Tasteful.

Action Management Chart For Project Status Progress Background PDF
This slide exhibits project action planning chart illustrating action steps, goal, department responsible etc that helps organization to monitor and track project progress and take immediate required steps to make procedure more efficient. Showcasing this set of slides titled Action Management Chart For Project Status Progress Background PDF. The topics addressed in these templates are Web Development, Marketing, Resources Required. All the content presented in this PPT design is completely editable. Download it and make adjustments in color, background, font etc. as per your unique business setting.
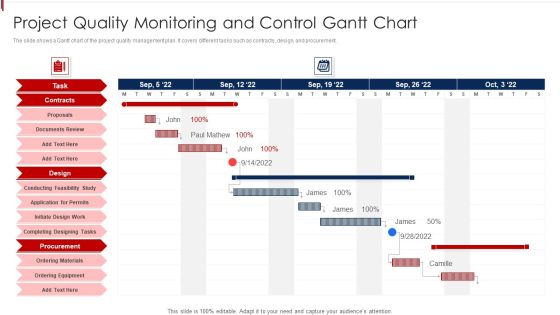
Project Quality Monitoring And Control Gantt Chart Clipart PDF
The slide shows a Gantt chart of the project quality management plan. It covers different tasks such as contracts, design, and procurement. Introducing our Project Quality Monitoring And Control Gantt Chart Clipart PDF that is designed to showcase some of the vital components that will help you create timelines, roadmaps, and project plans. In addition, also communicate your project durations, milestones, tasks, subtasks, dependencies, and other attributes using this well structured Project Quality Monitoring And Control Gantt Chart Clipart PDF template. You can also exhibit preeminence against time by deploying this easily adaptable slide to your business presentation. Our experts have designed this template in such a way that it is sure to impress your audience. Thus, download it and steer your project meetings, meetups, and conferences.

Project Performance Progress Monitoring Calendar Chart Pictures PDF
This slide covers the project performance measurement schedule chart. It includes the project details along with the project status, task assigned to, start date, end date, and duration of completing each task. Showcasing this set of slides titled Project Performance Progress Monitoring Calendar Chart Pictures PDF. The topics addressed in these templates are Plan Risk Management, Project Definition And Planning, Execution. All the content presented in this PPT design is completely editable. Download it and make adjustments in color, background, font etc. as per your unique business setting.

Project Time Scheduling Chart With Task Details Pictures PDF
This slide delineates project time management chart with task details that businesses can use during their routine projects . It also contains information about analysis, design, development and testing which can assist project managers in effective time management. Showcasing this set of slides titled project time scheduling chart with task details pictures pdf. The topics addressed in these templates are design, analysis, development. All the content presented in this PPT design is completely editable. Download it and make adjustments in color, background, font etc. as per your unique business setting.

5 Year Selling Forecasts Conversion Rate Chart Microsoft PDF
This slide covers forecast for sales conversion rates. It includes elements such as units in pipeline, pipeline growth rate, sales conversion rate, annual units sold, price per unit, forecast on revenue generation, etc. Pitch your topic with ease and precision using this 5 Year Selling Forecasts Conversion Rate Chart Microsoft PDF. This layout presents information on Conversion Rate, Price Per Unit, Growth Rate. It is also available for immediate download and adjustment. So, changes can be made in the color, design, graphics or any other component to create a unique layout.

Weekly Project Monitoring Calendar Performance Gantt Chart Formats PDF
This template covers the project implementation chart with various project stages. It also includes the project task completion status with task start date, end date, target days, days taken to complete the task, percentage of the job finished, etc. Showcasing this set of slides titled Weekly Project Monitoring Calendar Performance Gantt Chart Formats PDF. The topics addressed in these templates are Plan, Execution, Analysis. All the content presented in this PPT design is completely editable. Download it and make adjustments in color, background, font etc. as per your unique business setting.

Sales Techniques Playbook Different Products Price Comparison Chart Demonstration PDF
This slide provides information regarding product price comparison chart that captures information about price per unit, change over list price, reason for proposed price, volumes sold, forecasted growth. This is a sales techniques playbook different products price comparison chart demonstration pdf template with various stages. Focus and dispense information on two stages using this creative set, that comes with editable features. It contains large content boxes to add your information on topics like product, consumer, price, growth. You can also showcase facts, figures, and other relevant content using this PPT layout. Grab it now.

Sales Techniques Playbook Different Products Price Comparison Chart Graphics PDF
This slide provides information regarding product price comparison chart that captures information about price per unit, change over list price, reason for proposed price, volumes sold, forecasted growth. This is a sales techniques playbook different products price comparison chart graphics pdf template with various stages. Focus and dispense information on one stage using this creative set, that comes with editable features. It contains large content boxes to add your information on topics like ensuring effective communication among sales management team You can also showcase facts, figures, and other relevant content using this PPT layout. Grab it now.
Project Incremental Life Cycles Gantt Chart Icon Information PDF
This slide covers spiral model that puts focus on thorough risk assessment. It includes spiral iteration starting with four activities such as thorough planning, risk analysis, prototypes creation and evaluation of part previously delivered. Pitch your topic with ease and precision using this Project Incremental Life Cycles Gantt Chart Icon Information PDF. This layout presents information on Project Incremental, Life Cycles Gantt, Chart Icon. It is also available for immediate download and adjustment. So, changes can be made in the color, design, graphics or any other component to create a unique layout.

Project Timeline Gantt Chart For Weekly Themes PDF
Introducing our project timeline gantt chart for weekly themes pdf that is designed to showcase some of the vital components that will help you create timelines, roadmaps, and project plans. In addition, also communicate your project durations, milestones, tasks, subtasks, dependencies, and other attributes using this well structured project timeline gantt chart for weekly themes pdf template. You can also exhibit preeminence against time by deploying this easily adaptable slide to your business presentation. Our experts have designed this template in such a way that it is sure to impress your audience. Thus, download it and steer your project meetings, meetups, and conferences.
Project Task Management Chart For Tracking Progress Themes PDF
This slide exhibits project task planning chart for tracking progress illustrating task description, starting date, planned ending date, actual end date, planned work days etc that helps in tracking project progress. Showcasing this set of slides titled Project Task Management Chart For Tracking Progress Themes PDF. The topics addressed in these templates are Requirements Analysis, Business Case, Configuration Management. All the content presented in this PPT design is completely editable. Download it and make adjustments in color, background, font etc. as per your unique business setting.

Web Design Development Project Strategy Gantt Chart Information PDF
The slide showcases a website design project Gantt chart help visualizing project plan over the course of several weeks or even months. It covers aspects such as key tasks, progress and assigned teams. Pitch your topic with ease and precision using this Web Design Development Project Strategy Gantt Chart Information PDF. This layout presents information on Content Design, Develop Content, Web Design Project. It is also available for immediate download and adjustment. So, changes can be made in the color, design, graphics or any other component to create a unique layout.

Agile Project Incremental Life Cycles Plan Gantt Chart Guidelines PDF
This slide covers gantt chart of agile project iteration tasks. It includes tasks such as sprint planning, set up staging environment, configure multilingual features, create base theme, etc. Along with assigned persons and task progress bars. Showcasing this set of slides titled Agile Project Incremental Life Cycles Plan Gantt Chart Guidelines PDF. The topics addressed in these templates are Agile Project Plan, Sprint Planning, Assemble Template. All the content presented in this PPT design is completely editable. Download it and make adjustments in color, background, font etc. as per your unique business setting.

Financial Growth Examples Flow Chart Diagram Powerpoint Slide Graphics
This is a financial growth examples flow chart diagram powerpoint slide graphics. This is a six stage process. The stages in this process are increase in productivity, economic growth and development, increase in flow of goods and services in economy, consumption rises, size of market increase, inducement to invest for firms.
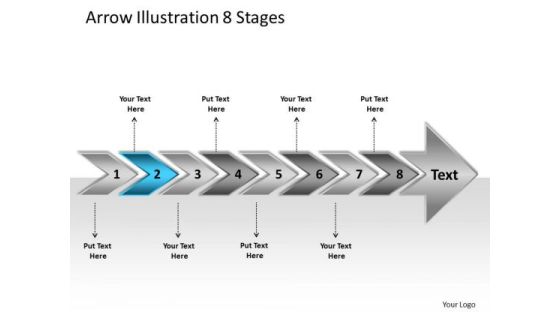
Arrow Illustration 8 Stages Business Flow Chart Slides PowerPoint
We present our arrow illustration 8 stages business flow chart Slides PowerPoint. Use our Arrows PowerPoint Templates because, the color coding of our templates are specifically designed to highlight you points. Use our Business PowerPoint Templates because, Now use this slide to bullet point your views. Use our Shapes PowerPoint Templates because; unravel the desired and essential elements of your overall strategy. Use our Finance PowerPoint Templates because, Goal Pie Chart Template: - You have a clear vision of the cake you want. Use our Process and Flows PowerPoint Templates because, you have the entire picture in mind. Use these PowerPoint slides for presentations relating to 3d arrow background bullet business chart checkmark chevron diagram drop eps10 financial five glass graphic gray icon illustration management point process project reflection set shadow stage text transparency vector white. The prominent colors used in the PowerPoint template are Blue, Gray, and Black

 Home
Home