Budget Chart

Advertising And Marketing Department Organizational Chart Professional PDF
This slide covers organization chart for advertising and marketing department. It includes key stakeholders such as board of directors, account managers, marketing services, creative services, finance, HR, online and digital services. Presenting Advertising And Marketing Department Organizational Chart Professional PDF to dispense important information. This template comprises six stages. It also presents valuable insights into the topics including Account Services, Brand Strategy, Account Executives. This is a completely customizable PowerPoint theme that can be put to use immediately. So, download it and address the topic impactfully.

4 Stages Strategy Pie Chart Business Plan PowerPoint Templates
We present our 4 stages strategy pie chart business plan PowerPoint templates.Download our Process and Flows PowerPoint Templates because Our PowerPoint Templates and Slides are like the strings of a tennis racquet. Well strung to help you serve aces. Download our Circle Charts PowerPoint Templates because You can Stir your ideas in the cauldron of our PowerPoint Templates and Slides. Cast a magic spell on your audience. Download and present our Marketing PowerPoint Templates because You have gained great respect for your brilliant ideas. Use our PowerPoint Templates and Slides to strengthen and enhance your reputation. Download and present our Success PowerPoint Templates because They will Put your wonderful verbal artistry on display. Our PowerPoint Templates and Slides will provide you the necessary glam and glitter. Download and present our Flow Charts PowerPoint Templates because You should Ascend the ladder of success with ease. Our PowerPoint Templates and Slides will provide strong and sturdy steps.Use these PowerPoint slides for presentations relating to Chart, pie, market, isolated, slice, isometric, perspective, business, blank, concept, vector, sign, presentation, symbol, diagram, circle, ring, graphic, finance,stock, element, report, abstract, graph, illustration, icon, text, motion, organization, movement, environment, financial. The prominent colors used in the PowerPoint template are Red, Gray, White.

Commercial And Urban Architect Business Profile Organization Chart Pictures PDF
This slide highlights the organization chart of architecture company which includes project manager, senior urban designer, architecture design principal, event center expert and sector wise head. Presenting Commercial And Urban Architect Business Profile Organization Chart Pictures PDF to provide visual cues and insights. Share and navigate important information on three stages that need your due attention. This template can be used to pitch topics like Architecture Design Principal, Branded Environments, Project Manager. In addtion, this PPT design contains high resolution images, graphics, etc, that are easily editable and available for immediate download.

Commercial Construction And Architecture Firm Organization Chart Microsoft PDF
This slide highlights the organization chart of architecture company which includes project manager, senior urban designer, architecture design principal, event center expert and sector wise head. Presenting Commercial Construction And Architecture Firm Organization Chart Microsoft PDF to provide visual cues and insights. Share and navigate important information on two stages that need your due attention. This template can be used to pitch topics like Project Manager, Branded Environments, Architecture Design Principal. In addtion, this PPT design contains high resolution images, graphics, etc, that are easily editable and available for immediate download.

Organization Chart Global Food Products Company Profile Brochure PDF
This slide highlights the organization chart of agricultural company which includes founder, CEO, EVP of retail products, fertilizer products, chief financial officer, chief legal officer, corporate development and strategy. Slidegeeks is one of the best resources for PowerPoint templates. You can download easily and regulate Organization Chart Global Food Products Company Profile Brochure PDF for your personal presentations from our wonderful collection. A few clicks is all it takes to discover and get the most relevant and appropriate templates. Use our Templates to add a unique zing and appeal to your presentation and meetings. All the slides are easy to edit and you can use them even for advertisement purposes.

Relocation Investment Program Schema Chart Three Months Roadmap Background
We present our relocation investment program schema chart three months roadmap background. This PowerPoint layout is easy to edit so you can change the font size, font type, color, and shape conveniently. In addition to this, the PowerPoint layout is Google Slides compatible, so you can share it with your audience and give them access to edit it. Therefore, download and save this well researched relocation investment program schema chart three months roadmap background in different formats like PDF, PNG, and JPG to smoothly execute your business plan.

Marketing Department Agency Departmental Organizational Chart Designs PDF
This slide covers structure chart for marketing agency team. It includes key stakeholders such as cofounder. executive assistant, marketing manager, marketing research head, marketing strategy executive, marking analysis, sales promotion, business development, vice president strategy director, etc. Persuade your audience using this Marketing Department Agency Departmental Organizational Chart Designs PDF. This PPT design covers seven stages, thus making it a great tool to use. It also caters to a variety of topics including Business Development, Finance, Technology. Download this PPT design now to present a convincing pitch that not only emphasizes the topic but also showcases your presentation skills.
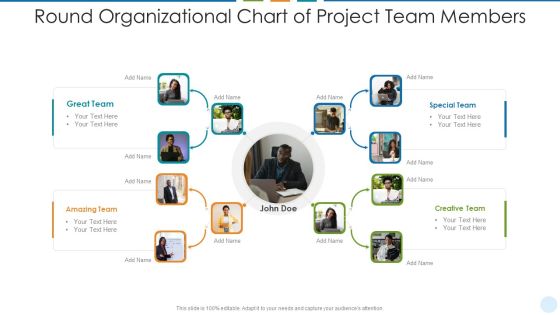
Round Organizational Chart Of Project Team Members Infographics PDF
Presenting round organizational chart of project team members infographics pdf to dispense important information. This template comprises four stages. It also presents valuable insights into the topics including amazing team, creative team, special team. This is a completely customizable PowerPoint theme that can be put to use immediately. So, download it and address the topic impactfully.

Money Raised With Growth Bar Chart Powerpoint Shapes
This is a money raised with growth bar chart powerpoint shapes. This is a nine stage process. The stages in this process are bar chart, growth, business, success, management.

Building Design Firm Details Organization Chart Ppt Infographics Deck PDF
This slide highlights the organization chart of architecture company which includes project manager, senior urban designer, architecture design principal, event center expert and sector wise head. This is a Building Design Firm Details Organization Chart Ppt Infographics Deck PDF template with various stages. Focus and dispense information on four stages using this creative set, that comes with editable features. It contains large content boxes to add your information on topics like Retail, Hospitality, Corporate Office. You can also showcase facts, figures, and other relevant content using this PPT layout. Grab it now.

Data Management Maturity Chart With Capabilities Topics PDF
The slide carries a data management maturity model for effective assessment of different business capabilities. Various elements included are maturity levels and capabilities such as data management function, data policies and procedures, data management initiatives budget, etc. Pitch your topic with ease and precision using this Data Management Maturity Chart With Capabilities Topics PDF. This layout presents information on Data Management Function, Development Stage, Team. It is also available for immediate download and adjustment. So, changes can be made in the color, design, graphics or any other component to create a unique layout.
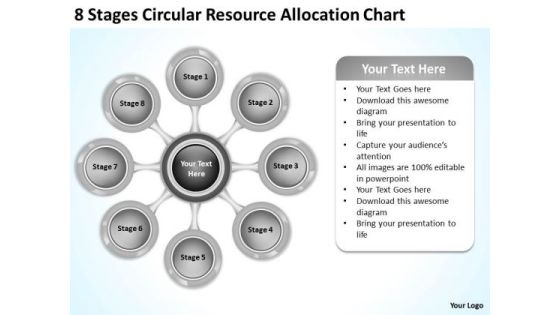
Business Development Strategy Template Resource Allocation Chart Creative Marketing Concepts
We present our business development strategy template resource allocation chart creative marketing concepts.Present our Advertising PowerPoint Templates because You can Double your output with our PowerPoint Templates and Slides. They make beating deadlines a piece of cake. Use our Marketing PowerPoint Templates because They will Put the wind in your sails. Skim smoothly over the choppy waters of the market. Use our Finance PowerPoint Templates because They will bring a lot to the table. Their alluring flavours will make your audience salivate. Present our Circle Charts PowerPoint Templates because You can Inspire your team with our PowerPoint Templates and Slides. Let the force of your ideas flow into their minds. Use our Business PowerPoint Templates because You have a driving passion to excel in your field. Our PowerPoint Templates and Slides will prove ideal vehicles for your ideas.Use these PowerPoint slides for presentations relating to Application, brainstorming, business, chart, circle, circular, clipart, closing, concept, diagram, flowchart, graph, graphic, illustration, infographic, insurance, loan, mortgage, pre-closing, pre-qualification, process, processing, stage, steps, symbol, text, underwriting, vector, visualization. The prominent colors used in the PowerPoint template are Black, Gray, White.
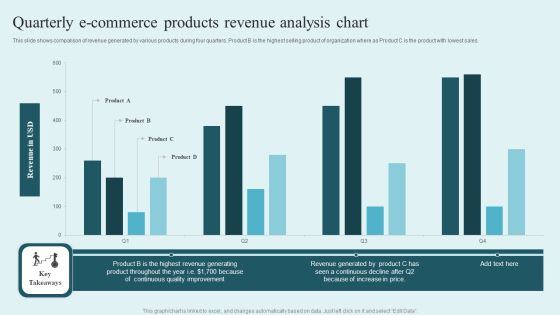
Quarterly E Commerce Products Revenue Analysis Chart Guidelines PDF
This slide shows comparison of revenue generated by various products during four quarters. Product B is the highest selling product of organization where as Product C is the product with lowest sales. Showcasing this set of slides titled Quarterly E Commerce Products Revenue Analysis Chart Guidelines PDF. The topics addressed in these templates are Revenue USD, Product, Continuous Quality Improvement. All the content presented in this PPT design is completely editable. Download it and make adjustments in color, background, font etc. as per your unique business setting.

Contract Management Half Yearly Gantt Chart Mockup PDF
This slide covers the information on how to manage the process of research or what activities has to be done for getting the accurate results form our research. Pitch your topic with ease and precision using this Contract Management Half Yearly Gantt Chart Mockup PDF. This layout presents information on Recognize Requirements, Budget, Execute Field Evaluation. It is also available for immediate download and adjustment. So, changes can be made in the color, design, graphics or any other component to create a unique layout.

Bar Chart Ppt PowerPoint Presentation Summary File Formats
This is a bar chart ppt powerpoint presentation summary file formats. This is a two stage process. The stages in this process are business, finance, financial years, sales in percentage, graph.

Bar Chart Ppt PowerPoint Presentation Inspiration Background Image
This is a bar chart ppt powerpoint presentation inspiration background image. This is a two stage process. The stages in this process are business, marketing, strategy, finance, in years, in percentage.

4 Steps On Pie Chart Business Plan Sample PowerPoint Templates
We present our 4 steps on pie chart business plan sample PowerPoint templates.Use our Flow Charts PowerPoint Templates because Your success is our commitment. Our PowerPoint Templates and Slides will ensure you reach your goal. Use our Process and Flows PowerPoint Templates because Our PowerPoint Templates and Slides will let you Hit the target. Go the full distance with ease and elan. Present our Marketing PowerPoint Templates because you can Set pulses racing with our PowerPoint Templates and Slides. They will raise the expectations of your team. Download our Success PowerPoint Templates because Our PowerPoint Templates and Slides help you meet the demand of the Market. Just browse and pick the slides that appeal to your intuitive senses. Download our Business PowerPoint Templates because Our PowerPoint Templates and Slides will let you Illuminate the road ahead to Pinpoint the important landmarks along the way.Use these PowerPoint slides for presentations relating to Chart, pie, bar, business, percent, forecasting, economy, piechart, white, achievement, future, sign, symbol, chartgraph, diagram, styles, finance, data, stock,report, marketing, analyzing, shape, graph, modern, economic, up, stair, money, solution, design, growth, colorful, progress, profit, inspiration,background, investment, successful, growthbusiness, prosperity, improvement, financial, concepts, structure, ideas. The prominent colors used in the PowerPoint template are Red, Yellow, Blue.
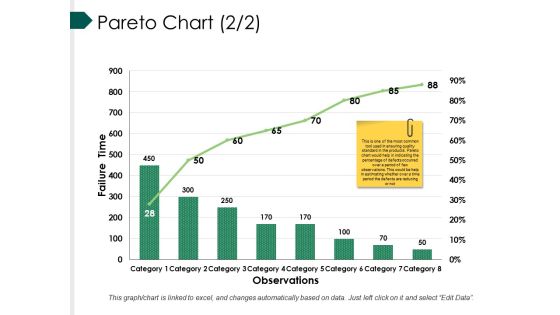
Pareto Chart Template Ppt PowerPoint Presentation Summary Graphic Images
This is a pareto chart template ppt powerpoint presentation summary graphic images. This is a eight stage process. The stages in this process are bar, marketing, strategy, finance, teamwork.

Client Acquisition Journey Plan Column Chart Ppt Professional Demonstration PDF
Boost your pitch with our creative Client Acquisition Journey Plan Column Chart Ppt Professional Demonstration PDF. Deliver an awe-inspiring pitch that will mesmerize everyone. Using these presentation templates you will surely catch everyones attention. You can browse the ppts collection on our website. We have researchers who are experts at creating the right content for the templates. So you dont have to invest time in any additional work. Just grab the template now and use them.

Bar Chart Ppt PowerPoint Presentation Visual Aids Diagrams
This is a bar chart ppt powerpoint presentation visual aids diagrams. This is a two stage process. The stages in this process are business, marketing, financial years, sales in percentage, graph.
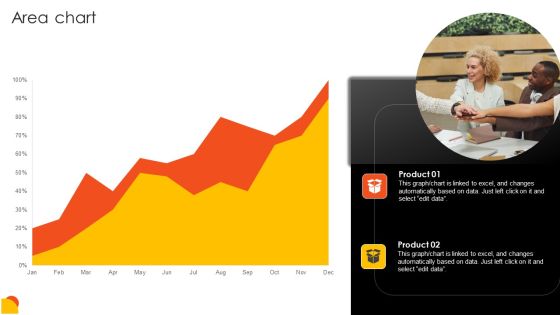
Effective Staff Performance Optimization Techniques Area Chart Template PDF
Boost your pitch with our creative Effective Staff Performance Optimization Techniques Area Chart Template PDF. Deliver an awe inspiring pitch that will mesmerize everyone. Using these presentation templates you will surely catch everyones attention. You can browse the ppts collection on our website. We have researchers who are experts at creating the right content for the templates. So you do not have to invest time in any additional work. Just grab the template now and use them.

Combo Chart Ppt PowerPoint Presentation File Visual Aids
This is a combo chart ppt powerpoint presentation file visual aids. This is a two stage process. The stages in this process are bar graph, business, marketing, finance, planning.

Column Chart Ppt PowerPoint Presentation Model Background Images
This is a column chart ppt powerpoint presentation model background images. This is a six stage process. The stages in this process are bar graph, marketing, finance, strategy, planning.

Profits Bar Chart Finance PowerPoint Templates And PowerPoint Themes 0612
Profits Bar Chart Finance PowerPoint Templates And PowerPoint Themes PPT Slides-Microsoft Powerpoint Templates and Background with graph with arrow
Scatter Chart Template 2 Ppt PowerPoint Presentation Slides Icons
This is a scatter chart template 2 ppt powerpoint presentation slides icons. This is a two stage process. The stages in this process are business, marketing, graph, in percentage, finance.

Column Chart Ppt PowerPoint Presentation Infographics Design Inspiration
This is a column chart ppt powerpoint presentation infographics design inspiration. This is a two stage process. The stages in this process are slide bar, marketing, strategy, finance, planning.

Clustered Column Line Chart Ppt PowerPoint Presentation Professional Slides
This is a clustered column line chart ppt powerpoint presentation professional slides. This is a four stage process. The stages in this process are bar, finance, business, marketing, growth.
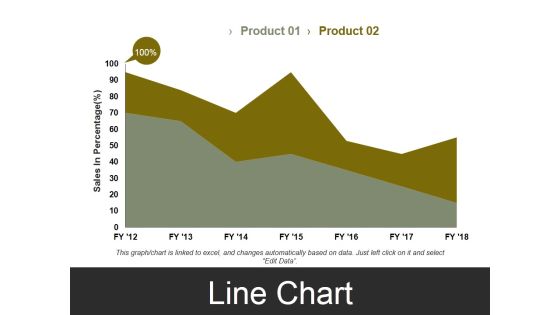
Line Chart Template 3 Ppt PowerPoint Presentation Styles Visual Aids
This is a line chart template 3 ppt powerpoint presentation styles visual aids. This is a two stage process. The stages in this process are sales in percentage, business, marketing, finance, graph.
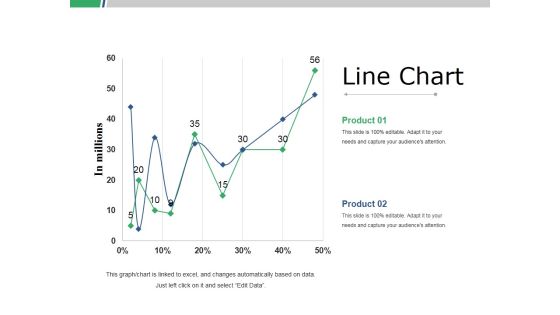
Line Chart Ppt PowerPoint Presentation Slides Graphics Template
This is a line chart ppt powerpoint presentation slides graphics template. This is a two stage process. The stages in this process are business, marketing, strategy, line graph, finance.

Column Chart Ppt PowerPoint Presentation Layouts Graphics Example
This is a column chart ppt powerpoint presentation layouts graphics example. This is a two stage process. The stages in this process are product, year, bar graph, business, finance.
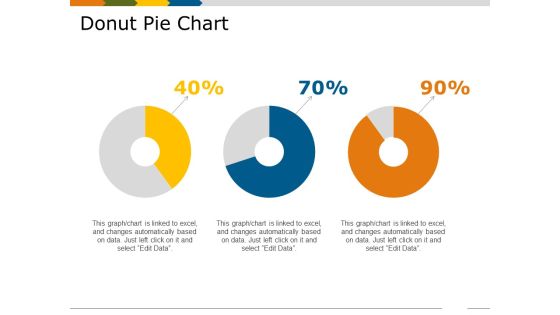
Donut Pie Chart Template 2 Ppt PowerPoint Presentation Show Skills
This is a donut pie chart template 2 ppt powerpoint presentation show skills. This is a three stage process. The stages in this process are percentage, business, marketing, process, finance.

Scatter Bubble Chart Ppt PowerPoint Presentation Infographic Template Examples
This is a scatter bubble chart ppt powerpoint presentation infographic template examples. This is a two stage process. The stages in this process are highest sale, product, in price, finance, business.

Pareto Chart Template 1 Ppt PowerPoint Presentation File Ideas
This is a pareto chart template 1 ppt powerpoint presentation file ideas. This is a eight stage process. The stages in this process are business, finance, marketing, strategy, analysis.
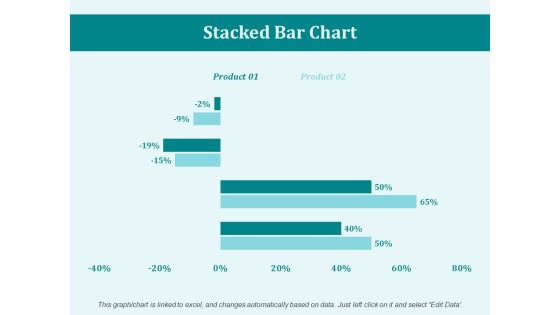
Stacked Bar Chart Percentage Ppt PowerPoint Presentation Portfolio Mockup
This is a stacked bar chart percentage ppt powerpoint presentation portfolio mockup. This is a two stage process. The stages in this process are business, marketing, management, percentage, product.
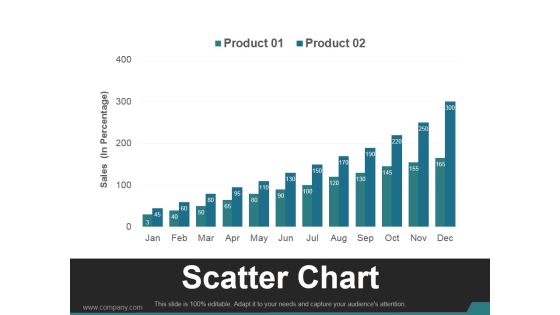
Scatter Chart Template 1 Ppt PowerPoint Presentation Visual Aids
This is a scatter chart template 1 ppt powerpoint presentation visual aids. This is a twelve stage process. The stages in this process are business, marketing, growth, finance, management.
Open High Low Close Chart Ppt PowerPoint Presentation Gallery Icons
This is a open high low close chart ppt powerpoint presentation gallery icons. This is a five stage process. The stages in this process are business, marketing, finance, planning, strategy.
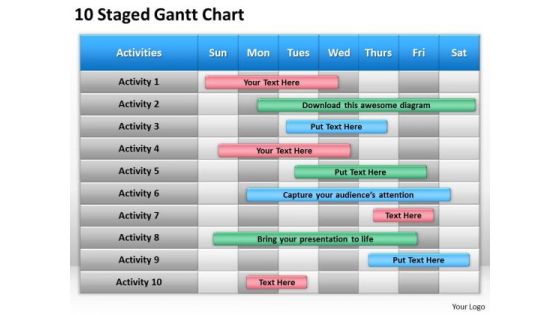
Consulting PowerPoint Template Gantt Chart Ppt Templates Backgrounds For Slides
Our consulting PowerPoint template gantt chart ppt templates backgrounds for slides help to make a draft. They give you a good place to start. Break the deadlock with our Competition PowerPoint Templates. Let the words start to flow. Assert your capability with our Advertising PowerPoint Templates. Give your thoughts that decisive touch.
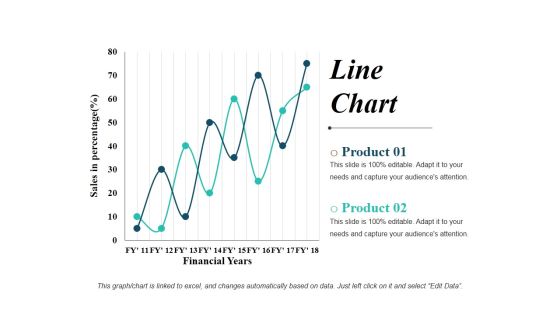
Line Chart Ppt PowerPoint Presentation Show Graphics Design
This is a line chart ppt powerpoint presentation show graphics design. This is a two stage process. The stages in this process are line graph, business, marketing, finance, planning.

Open High Low Close Chart Ppt PowerPoint Presentation Styles Example
This is a open high low close chart ppt powerpoint presentation styles example. This is a four stage process. The stages in this process are business, marketing, finance, strategy, planning.

Clustered Column Line Chart Ppt PowerPoint Presentation Inspiration Graphics Pictures
This is a clustered column line chart ppt powerpoint presentation inspiration graphics pictures. This is a four stage process. The stages in this process are business, marketing, strategy, planning, finance.
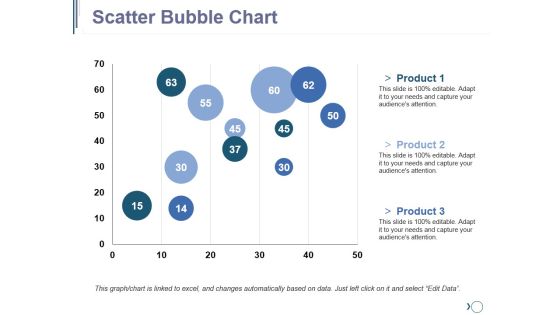
Scatter Bubble Chart Ppt PowerPoint Presentation Outline Graphics Pictures
This is a scatter bubble chart ppt powerpoint presentation outline graphics pictures. This is a three stage process. The stages in this process are finance, planning, business, marketing, strategy.
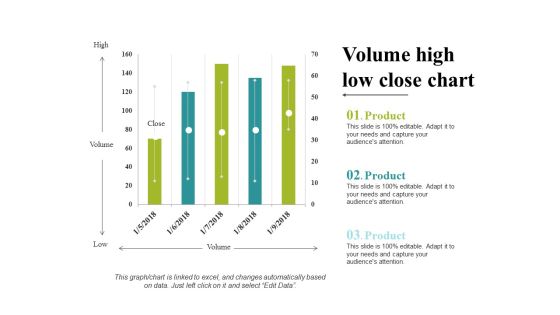
Volume High Low Close Chart Ppt PowerPoint Presentation Portfolio Clipart
This is a volume high low close chart ppt powerpoint presentation portfolio clipart. This is a five stage process. The stages in this process are business, marketing, strategy, planning, finance.
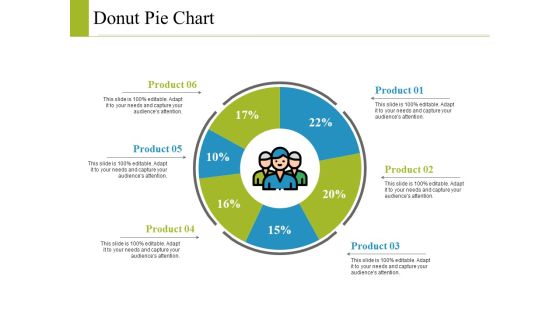
Donut Pie Chart Ppt PowerPoint Presentation Model Graphics Example
This is a donut pie chart ppt powerpoint presentation model graphics example. This is a six stage process. The stages in this process are business, marketing, strategy, planning, finance.
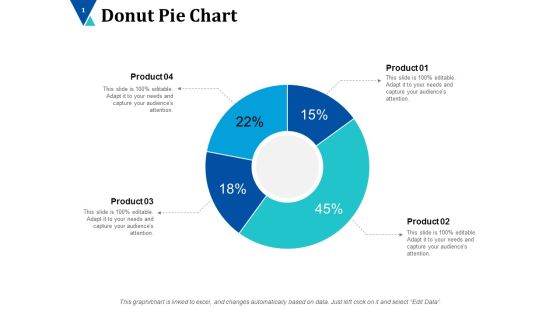
Donut Pie Chart Ppt PowerPoint Presentation Inspiration Designs Download
This is a donut pie chart ppt powerpoint presentation inspiration designs download. This is a four stage process. The stages in this process are donut, business, planning, marketing, finance.
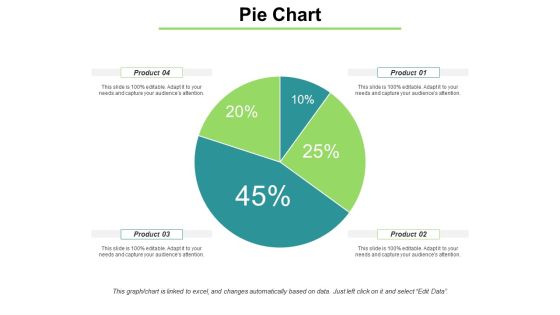
Pie Chart With Distrubation Ppt PowerPoint Presentation Model Ideas
This is a pie chart with distrubation ppt powerpoint presentation model ideas. This is a four stage process. The stages in this process are pie, finance, marketing, strategy, planning.

PowerPoint Theme Data Driven Pie Chart Ppt Design Slides
PowerPoint Theme Data Driven Pie Chart PPT Design Slides-The Circle of Life - a concept emmbedded in our minds and hence easy to comprehend. Life and Business is made up of processes comprising stages that flow from one to another. An excellent graphic to attract the attention of and understanding by your audience to improve earnings.
Donut Pie Chart Ppt PowerPoint Presentation Icon Background Designs
This is a donut pie chart ppt powerpoint presentation icon background designs. This is a four stage process. The stages in this process are product, percentage, finance, donut, business.

High Low Close Chart Ppt PowerPoint Presentation Layouts Guide
This is a high low close chart ppt powerpoint presentation layouts guide. This is a ten stage process. The stages in this process are high, volume, low, business, marketing, finance.

Area Chart Ppt PowerPoint Presentation Inspiration Slide Download
This is a area chart ppt powerpoint presentation inspiration slide download. This is a two stage process. The stages in this process are product, in percentage, business, growth, strategy, finance.

High Low Close Chart Ppt PowerPoint Presentation Ideas Brochure
This is a high low close chart ppt powerpoint presentation ideas brochure. This is a three stage process. The stages in this process are in percentage, product, business, marketing, finance.
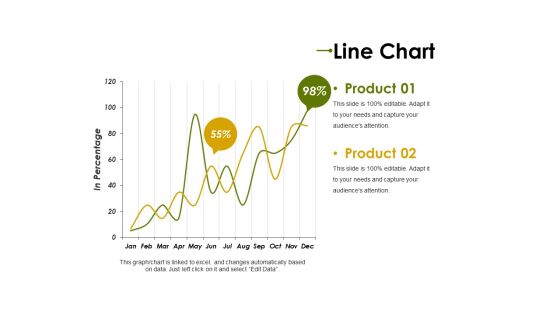
Line Chart Ppt PowerPoint Presentation Professional Clipart Images
This is a line chart ppt powerpoint presentation professional clipart images. This is a two stage process. The stages in this process are product, in percentage, graph, percentage, finance, business.
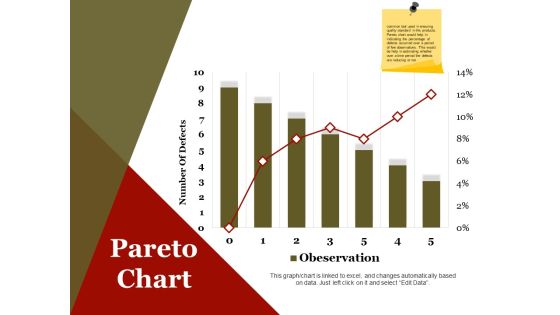
Pareto Chart Ppt PowerPoint Presentation Infographics Design Inspiration
This is a pareto chart ppt powerpoint presentation infographics design inspiration. This is a seven stage process. The stages in this process are number of defects, business, marketing, finance.
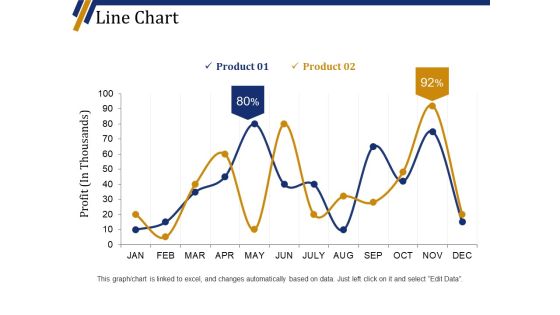
Line Chart Ppt PowerPoint Presentation Portfolio Background Designs
This is a line chart ppt powerpoint presentation portfolio background designs. This is a two stage process. The stages in this process are product, business, finance, marketing, profit in thousands.
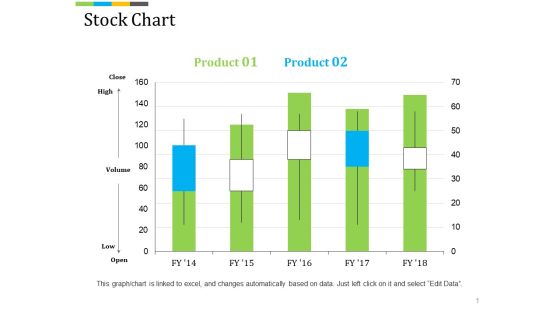
Stock Chart Ppt PowerPoint Presentation Professional Background Image
This is a stock chart ppt powerpoint presentation professional background image. This is a five stage process. The stages in this process are high, volume, low, finance, business, marketing.

Stock Chart Ppt PowerPoint Presentation Summary File Formats
This is a stock chart ppt powerpoint presentation summary file formats. This is a five stage process. The stages in this process are high, volume, low, business, graph, finance.

Column Chart Ppt PowerPoint Presentation Show Master Slide
This is a column chart ppt powerpoint presentation show master slide. This is a six stage process. The stages in this process are financial, years, business, marketing, finance, graph.

Scatter Bubble Chart Ppt PowerPoint Presentation Gallery Example Introduction
This is a scatter bubble chart ppt powerpoint presentation gallery example introduction. This is a eight stage process. The stages in this process are business, marketing, finance, bubble, scatter.

Clustered Column Chart Ppt PowerPoint Presentation Show Slideshow
This is a clustered column chart ppt powerpoint presentation show slideshow. This is a six stage process. The stages in this process are financial year in, sales in percentage, business, marketing, finance.

Scatter Bubble Chart Ppt PowerPoint Presentation Gallery Show
This is a scatter bubble chart ppt powerpoint presentation gallery show. This is a two stage process. The stages in this process are profit, in percentage, finance, marketing, business.

Area Chart Ppt PowerPoint Presentation Portfolio Graphics Design
This is a area chart ppt powerpoint presentation portfolio graphics design. This is a two stage process. The stages in this process are business, marketing, in percentage, graph, finance.

 Home
Home