Budget Chart

Pareto Chart Ppt PowerPoint Presentation Shapes
This is a pareto chart ppt powerpoint presentation shapes. This is a eight stage process. The stages in this process are business, strategy, marketing, success, growth strategy.

Column Chart Ppt PowerPoint Presentation Introduction
This is a column chart ppt powerpoint presentation introduction. This is a nine stage process. The stages in this process are business, marketing, management, growth, timeline.

Combo Chart Ppt PowerPoint Presentation Inspiration
This is a combo chart ppt powerpoint presentation inspiration. This is a eight stage process. The stages in this process are business, marketing, management, growth, timeline.

Combo Chart Ppt PowerPoint Presentation Files
This is a combo chart ppt powerpoint presentation files. This is a eight stage process. The stages in this process are business, marketing, growth, timeline, graph.

Scatter Bubble Chart Ppt PowerPoint Presentation Slides
This is a scatter bubble chart ppt powerpoint presentation slides. This is a eight stage process. The stages in this process are in price, highest sale, business, management.

Mind Map Chart PowerPoint Templates Ppt Slides
Mind map Chart PowerPoint templates PPT Slides-These high quality powerpoint pre-designed slides and powerpoint templates have been carefully created by our professional team to help you impress your audience. All slides have been created and are 100% editable in powerpoint. Each and every property of any graphic - color, size, orientation, shading, outline etc. can be modified to help you build an effective powerpoint presentation. Any text can be entered at any point in the powerpoint template or slide. Simply DOWNLOAD, TYPE and PRESENT!-These slides can be used for presentation themes relating to-Brain, brainstorming, business, clearance, communications, decision, discharging, graphic, leadership, making, management, map, mapping, mind, mind-map, option, problem, problem-solving, process, project, question, red, solutions, solve, solving, technique, think, training, why

Banking Investment Management Chart Powerpoint Slides
This is a banking investment management chart powerpoint slides. This is a nine stage process. The stages in this process are tax planning, estate and trust planning, us banking and credit capabilities, us business owner planning, banking and cash management, financial literacy, credit strategies, philanthropy, investment management, private client, private client, team.

Functional Chart Of Healthcare Company Ideas PDF
The following slide showcases the organizational structure of a hospital. The key stakeholders mentioned in the slide are hospital director, assistant attorney general, human resources, patient advocacy services, special assistant, chief of support services etc. Coming up with a presentation necessitates that the majority of the effort goes into the content and the message you intend to convey. The visuals of a PowerPoint presentation can only be effective if it supplements and supports the story that is being told. Keeping this in mind our experts created Functional Chart Of Healthcare Company Ideas PDF to reduce the time that goes into designing the presentation. This way, you can concentrate on the message while our designers take care of providing you with the right template for the situation.
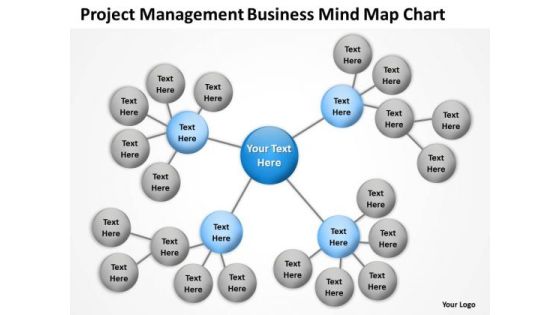
Timeline Project Management Business Mind Map Chart
You have all the ingredients to create the taste of sucess. Garnish your recipe with our Timeline Project Management Business Mind Map Chart and enhance its flavour. Our Timeline Project Management Business Mind Map Chart are created by innovative young minds. Gauranteed to fit presentations of all kinds.

Area Chart Ppt PowerPoint Presentation Layouts Slide
Presenting this set of slides with name area chart ppt powerpoint presentation layouts slide. The topics discussed in these slide is area chart. This is a completely editable PowerPoint presentation and is available for immediate download. Download now and impress your audience.

Business Framework PowerPoint Chart Variations PowerPoint Presentation
This image slide displays comparison chart template. This innovative image slide has been designed with pie charts to represent yearly progress. This image slide is 100% editable. You may change color, size and orientation of any icon to your liking. This image slide may be used in school, business and social presentations. Make your presentations interesting using this image slide.

Percentage Data Growth Chart Powerpoint Slides
This PowerPoint template has been designed with percentage data growth chart. Download this PPT chart to depict financial ratio analysis. This PowerPoint slide is of great help in the business sector to make realistic presentations and provides effective way of presenting your newer thoughts.

Data Maturity Assessment Chart Icon Demonstration PDF
Persuade your audience using this Data Maturity Assessment Chart Icon Demonstration PDF. This PPT design covers three stages, thus making it a great tool to use. It also caters to a variety of topics including Data Maturity, Assessment Chart Icon. Download this PPT design now to present a convincing pitch that not only emphasizes the topic but also showcases your presentation skills.

Banking Operations Management Chart Good Ppt Example
This is a banking operations management chart good ppt example. This is a seven stage process. The stages in this process are results, accountability, focused action, commitment, roles and responsibilities, communication and collaboration, trust.

Financial Marketing Solutions Chart Presentation Ideas
This is a financial marketing solutions chart presentation ideas. This is a eight stage process. The stages in this process are direct deposits, e commerce, prepaid cards, bill payments, money orders, small loans, mobile transaction, international money transfer.

Project Management Implementation Management Chart Microsoft PDF
This slide project management implementation planning chart illustrating project area such as project management, project planning, status update, infrastructure etc that helps in over viewing tasks and estimating a project. Showcasing this set of slides titled Project Management Implementation Management Chart Microsoft PDF. The topics addressed in these templates are Retail, Finance, System. All the content presented in this PPT design is completely editable. Download it and make adjustments in color, background, font etc. as per your unique business setting.

Digital Advertisement Spend Trend Chart By Industries Elements PDF
This slide depicts expenditure trends for digital advertising by top industries. It includes retail, automotive, financial services, telecom, consumer products, travel, healthcare, media, entertainment, etc. Showcasing this set of slides titled Digital Advertisement Spend Trend Chart By Industries Elements PDF. The topics addressed in these templates are Retail Sector, Total Budget, Chart By Industries. All the content presented in this PPT design is completely editable. Download it and make adjustments in color, background, font etc. as per your unique business setting.

Pie Chart Finance Ppt PowerPoint Presentation Deck
This is a pie chart finance ppt powerpoint presentation deck. The topics discussed in this diagram are marketing, business, management, planning, strategy This is a completely editable PowerPoint presentation, and is available for immediate download.

Bar Chart Ppt PowerPoint Presentation Background Designs
This is a bar chart ppt powerpoint presentation background designs. This is a twelve stage process. The stages in this process are bar graph, finance, marketing, strategy, analysis, investment.
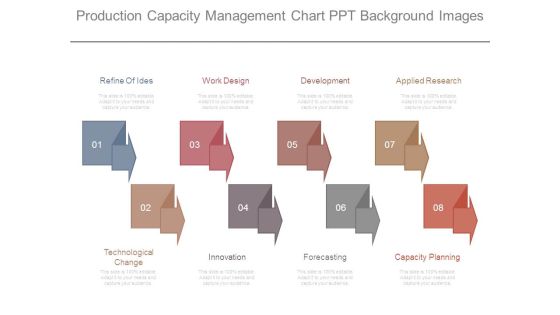
Production Capacity Management Chart Ppt Background Images
This is a production capacity management chart ppt background images. This is a eight stage process. The stages in this process are refine of ides, work design, development, applied research, technological change, innovation, forecasting, capacity planning.

Professional Retail Merchandising Chart Presentation Design
This is a professional retail merchandising chart presentation design. This is a seven stage process. The stages in this process are market trends, product assortment, individual product demand forecasting, product display and advertising, inventory, markdowns, purchase quantity, merchandising.
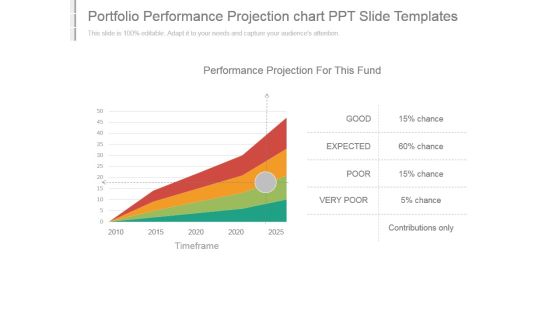
Portfolio Performance Projection Chart Ppt Slide Templates
This is a portfolio performance projection chart ppt slide templates. This is a four stage process. The stages in this process are performance projection for this fund, good, expected, poor, very poor, contributions only, timeframe.

Unconstrained Investment Selection Process Chart Diagram
This is a unconstrained investment selection process chart diagram. This is a six stage process. The stages in this process are portfolio decision making, fundamental financial principles, client centric, economic guidance, optimal investment selection, strategic and tactical, allocation, market trends and cycles.
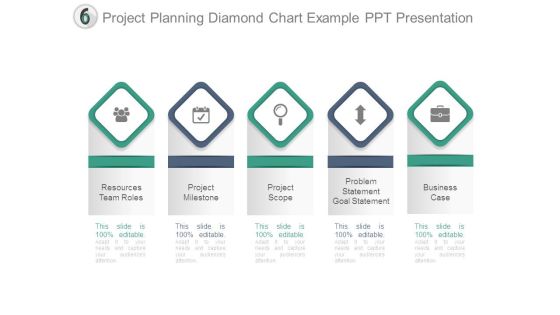
Project Planning Diamond Chart Example Ppt Presentation
This is a project planning diamond chart example ppt presentation. This is a five stage process. The stages in this process are resources team roles, project milestone, project scope, problem statement goal statement, business case.
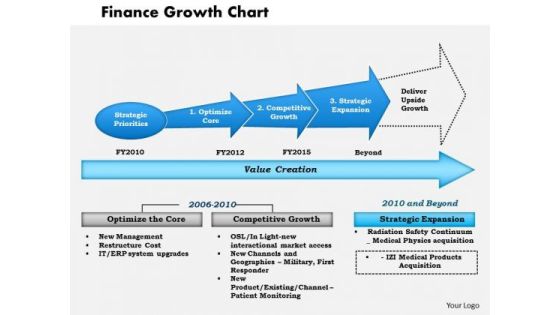
Business Framework Finance Growth Chart PowerPoint Presentation
This business framework PPT diagram has been crafted with graphic of linear arrow diagram. This PPT diagram contains the linear flow chart. This PPT diagram may be used for business strategy and finance transformation.

PowerPoint Backgrounds Process Chart Marketing Ppt Templates
PowerPoint Backgrounds Process Chart Marketing PPT Templates-The Circle of Life - a concept emmbedded in our minds and hence easy to comprehend. Life and Business is made up of processes comprising stages that flow from one to another. An excellent graphic to attract the attention of and understanding by your audience to improve earnings-PowerPoint Backgrounds Process Chart Marketing PPT Templates-This ppt can be used for presentations relating to-Arrow, Bond, Business, Button, Buying, Career, Change, Chart, Children, Circle, College, Death, Diagram, Education, Financial, Future, Graphic, House, Illustration, Investing, Investment, Marriage, Menu, Personal, Plan, Process
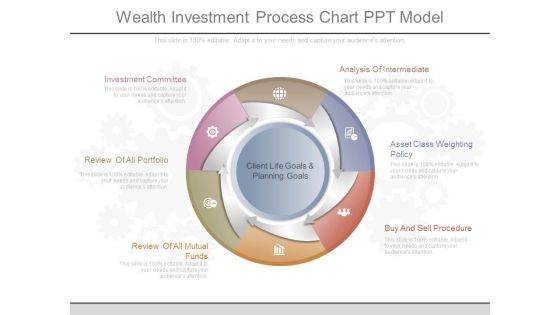
Wealth Investment Process Chart Ppt Model
This is a wealth investment process chart ppt model. This is a six stage process. The stages in this process are investment committee, review of all portfolio, review of all mutual funds, client life goals and planning goals, analysis of intermediate, asset class weighting policy, buy and sell procedure.
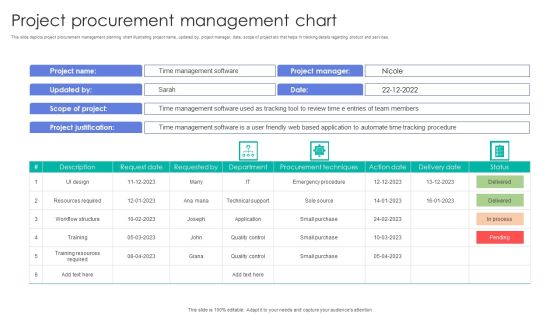
Project Procurement Management Chart Elements PDF
This slide depicts project procurement management planning chart illustrating project name, updated by, project manager, date, scope of project etc that helps in tracking details regarding product and services. Showcasing this set of slides titled Project Procurement Management Chart Elements PDF. The topics addressed in these templates are Design, Resources Required, Quality Control. All the content presented in this PPT design is completely editable. Download it and make adjustments in color, background, font etc. as per your unique business setting.

Project Schedule Planning Flow Chart Themes PDF
This template covers about flow chart which includes identifying prospect clients and determining requirements for developing projects with suitable amendments for finally handing over the project to client after completion. Showcasing this set of slides titled Project Schedule Planning Flow Chart Themes PDF. The topics addressed in these templates are Design, Management, Team. All the content presented in this PPT design is completely editable. Download it and make adjustments in color, background, font etc. as per your unique business setting.

3 Phase Project Timeline Chart Diagrams PDF
This slide depicts 3 phase project scheduling illustrating planning including assessment and project agreement, designing including wireframe, mock up and reviews etc that helps in tracking project progress. Showcasing this set of slides titled 3 phase project timeline chart diagrams pdf. The topics addressed in these templates are 3 phase project timeline chart. All the content presented in this PPT design is completely editable. Download it and make adjustments in color, background, font etc. as per your unique business setting.

Environmental Management Accounting System Chart Ppt Slides
This is a environmental management accounting system chart ppt slides. This is a six stage process. The stages in this process are overheads, environmental cost, direct labour, environmental cost, direct material, environmental cost.

Email Marketing Guide Chart Presentation Diagrams
This is a email marketing guide chart presentation diagrams. This is a eight stage process. The stages in this process are automated actions, return on investment, maximum response, consolation, data collection, delivery optimization, list building, contact development, email marketing.
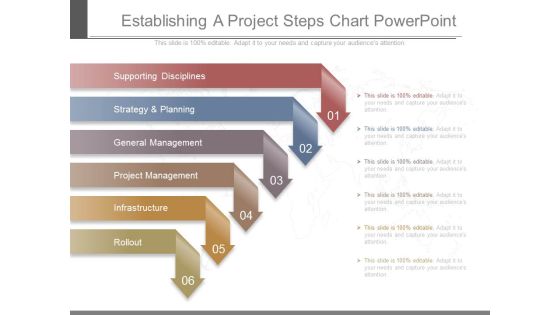
Establishing A Project Steps Chart Powerpoint
This is a establishing a project steps chart powerpoint. This is a six stage process. The stages in this process are supporting disciplines, strategy and planning, general management, project management, infrastructure, rollout.

Revenue And Expenditures Cycle Chart Ppt Design
This is a revenue and expenditures cycle chart ppt design. This is a four stage process. The stages in this process are cash check disbursement, cash check receipt journal, bank account, bank reconciliation.

Project Issues Description Chart Powerpoint Slide Graphics
This is a project issues description chart powerpoint slide graphics. This is a seven stage process. The stages in this process are issue description, reported on, reported by, owner, severity, priority, status.

Project Issues Infogarphic Chart Ppt Examples Slides
This is a project issues infogarphic chart ppt examples slides. This is a seven stage process. The stages in this process are issue description, reported on, reported by, owner, severity, priority, status.
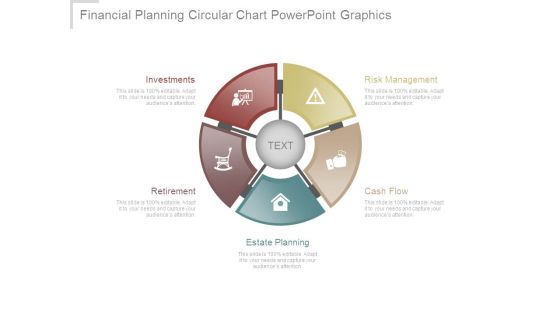
Financial Planning Circular Chart Powerpoint Graphics
This is a financial planning circular chart powerpoint graphics. This is a five stage process. The stages in this process are risk management, cash flow, estate planning, retirement, investments.
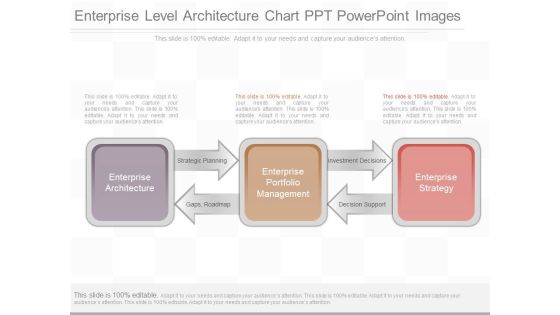
Enterprise Level Architecture Chart Ppt Powerpoint Images
This is a enterprise level architecture chart ppt powerpoint images. This is a three stage process. The stages in this process are enterprise architecture, strategic planning, gaps, roadmap, enterprise portfolio management, investment decisions, decision support, enterprise strategy.
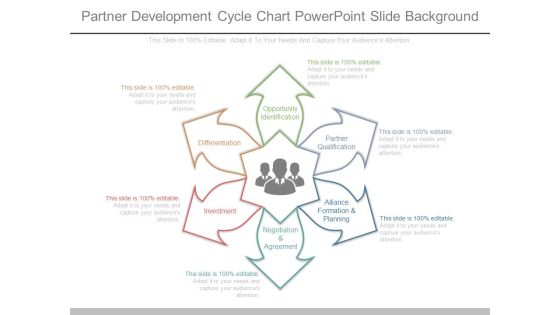
Partner Development Cycle Chart Powerpoint Slide Background
This is a partner development cycle chart powerpoint slide background. This is a six stage process. The stages in this process are opportunity identification, partner qualification, alliance formation and planning, negotiation and agreement, investment, differentiation.

Business Facilitation Skills Chart Presentation Deck
This is a business facilitation skills chart presentation deck. This is a eight stage process. The stages in this process are idea, investment, strategy, find valuable partner, employment, website, marketing, customer service.
Daily Schedule Circular Chart Ppt Powerpoint Guide
This is a daily schedule circular chart ppt powerpoint guide. This is a seven stage process. The stages in this process are develop proposal, submit and negotiate, award setup, manage subawards, execute project, close out project, define opportunity.

Governance Growth System Chart Example Of Ppt
This is a governance growth system chart example of ppt. This is a four stage process. The stages in this process are accountable government, solid institution, political system, socio economic growth, governance.

PowerPoint Slides Pyramid Process Chart Ppt Theme
PowerPoint Slides pyramid Process Chart PPT Theme-This Pyramid Diagram may be defined as representation of data in the form of a triangle separated by horizontal lines. The widest section may contain the general topic while the narrowest section may contain a much more specific topic-business, chart, color, concept, conceptual, construction, corporate, creating, data, design, diagram, direction, focus, graph, group, growth, hierarchy, illustration, information, isolated, layer, layered, level, manage, management, model, object, organization, performance, population, presentation, principal, process, progress, pyramid, rank, resource, shape, stage, structure, support, symbol, top, triangle, vector-PowerPoint Slides pyramid Process Chart PPT Theme

Key Communications Activities Chart Layout Powerpoint Slides
This is a key communications activities chart layout powerpoint slides. This is a five stage process. The stages in this process are start of project, cost effective, equal and inclusive, clearly branded, end of project.

Accounting Receivable Procedure Flow Chart Inspiration PDF
This slide consists of a flow chart depicting the accounting process followed by finance managers. The major steps consist of receipt of invoice, adding reminder, checking invoice status, sending mail to customer with amount due etc. Showcasing this set of slides titled Accounting Receivable Procedure Flow Chart Inspiration PDF. The topics addressed in these templates are Invoice, Chart, Receivable. All the content presented in this PPT design is completely editable. Download it and make adjustments in color, background, font etc. as per your unique business setting.

Business Model Canvas Chart Ppt Images
This is a business model canvas chart ppt images. This is a five stage process. The stages in this process are key partners, key activities, value propositions, customer relationships, customer segments, key resources, channels, cost structure, revenue streams.

Business Model Canvas Chart Example Ppt Presentation
This is a business model canvas chart example ppt presentation. This is a five stage process. The stages in this process are key partners, key activities, value propositions, customer relationships, customer segments, key resources, channels, cost structure, revenue streams.

New Business Model Chart Presentation Powerpoint Example
This is a new business model chart presentation powerpoint example. This is a five stage process. The stages in this process are key partners, key activities, value propositions, customer, relationships, customer segments, key resources, channels, cost structure, revenue streams.
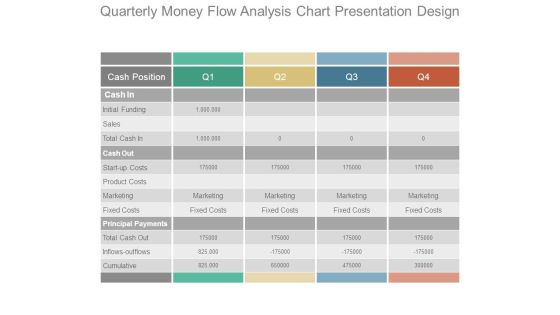
Quarterly Money Flow Analysis Chart Presentation Design
This is a quarterly money flow analysis chart presentation design. This is a four stage process. The stages in this process are cash position, cash in, initial funding, sales, total cash in, cash out, start up costs, product costs, marketing, fixed costs, principal payments, total cash out, inflows outflows, cumulative.
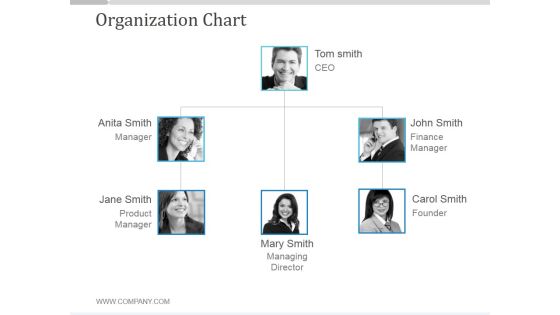
Organization Chart Ppt PowerPoint Presentation Backgrounds
This is a organization chart ppt powerpoint presentation backgrounds. This is a three stage process. The stages in this process are tom smith ceo, john smith finance manager, john smith finance manager, john smit finance manager.
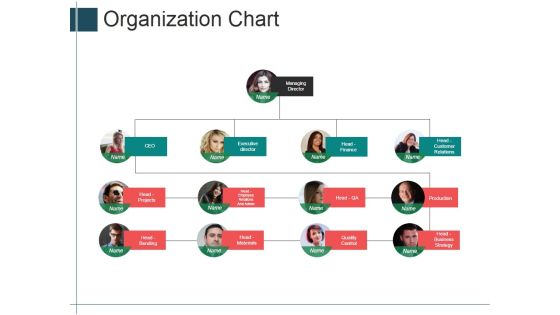
Organization Chart Ppt PowerPoint Presentation Portfolio Shapes
This is a organization chart ppt powerpoint presentation portfolio shapes. This is a four stage process. The stages in this process are managing director, executive director, head finance, head projects.
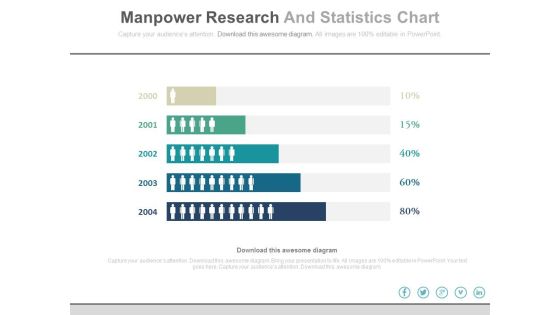
Manpower Research And Statistics Chart Powerpoint Slides
This PowerPoint template has been designed with yearly statistical chart with men icons. This PPT slide may be used for manpower research. Download this slide to build unique presentation.
Graph And Chart Business PowerPoint Template 1110
Graphs and charts with compass. Workplace of businessman

Business Telecommunication Process Flow Chart Powerpoint Slides
This is a business telecommunication process flow chart powerpoint slides. This is a eight stage process. The stages in this process are business opportunity, market analysis, new product development, costing and projection, product support, marketing, sales and distribution, product evaluation.

Bar Chart Ppt PowerPoint Presentation Icon Demonstration
This is a bar chart ppt powerpoint presentation icon demonstration. This is a seven stage process. The stages in this process are product, sales in percentage, financial year, graph.

Bar Chart Ppt PowerPoint Presentation Outline Backgrounds
This is a bar chart ppt powerpoint presentation outline backgrounds. This is a one stage process. The stages in this process are sales in percentage, financial years, product, bar graph, finance.
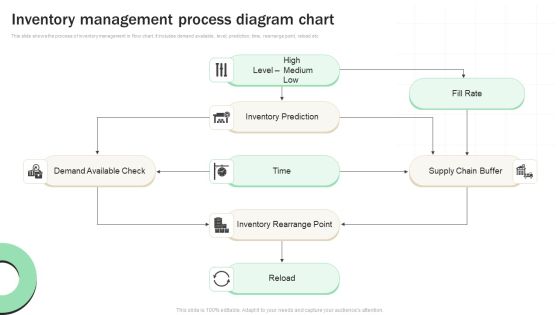
Inventory Management Process Diagram Chart Infographics PDF
This slide shows the process of inventory management in flow chart. It includes demand available, level, prediction, time, rearrange point, reload etc. Pitch your topic with ease and precision using this Inventory Management Process Diagram Chart Infographics PDF. This layout presents information on Demand Available Check, Inventory Rearrange Point, Supply Chain Buffer. It is also available for immediate download and adjustment. So, changes can be made in the color, design, graphics or any other component to create a unique layout.

Graph Chart Business PowerPoint Template 0810
illustration composed by charts word map and globe

Column Chart Ppt PowerPoint Presentation Background Designs
This is a column chart ppt powerpoint presentation background designs. This is a two stage process. The stages in this process are bar graph, finance, marketing, strategy, analysis, business.

Combo Chart Ppt PowerPoint Presentation Infographics Infographics
This is a combo chart ppt powerpoint presentation infographics infographics. This is a three stage process. The stages in this process are bar graph, growth, finance, marketing, strategy, business.

 Home
Home