AI PPT Maker
Templates
PPT Bundles
Design Services
Business PPTs
Business Plan
Management
Strategy
Introduction PPT
Roadmap
Self Introduction
Timelines
Process
Marketing
Agenda
Technology
Medical
Startup Business Plan
Cyber Security
Dashboards
SWOT
Proposals
Education
Pitch Deck
Digital Marketing
KPIs
Project Management
Product Management
Artificial Intelligence
Target Market
Communication
Supply Chain
Google Slides
Research Services
 One Pagers
All Categories
-
Home
- Customer Favorites
- Budget Chart
Budget Chart

Area Chart Ppt PowerPoint Presentation Show Background
This is a area chart ppt powerpoint presentation show background. This is a two stage process. The stages in this process are in percentage, chart, business, marketing, strategy.

Bubble Chart Ppt PowerPoint Presentation File Styles
This is a bubble chart ppt powerpoint presentation file styles. This is a four stage process. The stages in this process are chart, business, marketing, strategy, bubble.

Stock Chart Ppt PowerPoint Presentation Professional Topics
This is a stock chart ppt powerpoint presentation professional topics. This is a two stage process. The stages in this process are high, volume, low, stock chart.

stock chart ppt powerpoint presentation pictures mockup
This is a stock chart ppt powerpoint presentation pictures mockup. This is a one stage process. The stages in this process are stock chart, high, volume, low.
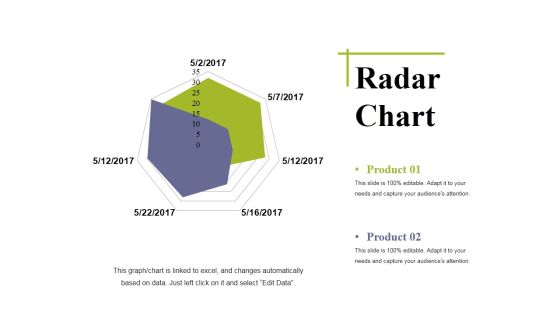
Radar Chart Ppt PowerPoint Presentation Outline Deck
This is a radar chart ppt powerpoint presentation outline deck. This is a two stage process. The stages in this process are radar chart, marketing, strategy, analysis, business.

Line Chart Ppt PowerPoint Presentation Professional Gridlines
This is a line chart ppt powerpoint presentation professional gridlines. This is a two stage process. The stages in this process are business, marketing, growth, success, line chart.

Stock Chart Ppt PowerPoint Presentation Ideas Inspiration
This is a stock chart ppt powerpoint presentation ideas inspiration. This is a two stage process. The stages in this process are high, volume, low, stock chart.

Column Chart Ppt PowerPoint Presentation Portfolio Outline
This is a column chart ppt powerpoint presentation portfolio outline. This is a two stage process. The stages in this process are column chart, business, marketing, graph, strategy.

Stock Chart Ppt PowerPoint Presentation Pictures Model
This is a stock chart ppt powerpoint presentation pictures model. This is a two stage process. The stages in this process are business, high, volume, low, chart.
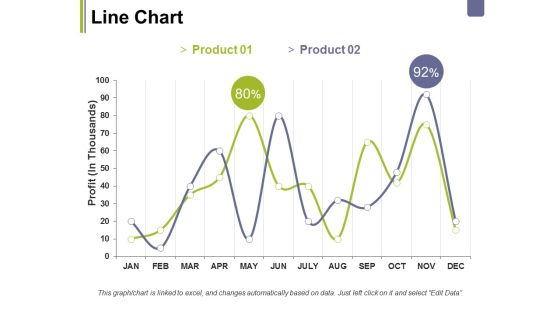
Line Chart Ppt PowerPoint Presentation Layouts Topics
This is a line chart ppt powerpoint presentation layouts topics. This is a two stage process. The stages in this process are business, profit, chart, percentage, graph, marketing.

Stock Chart Ppt PowerPoint Presentation Outline Influencers
This is a stock chart ppt powerpoint presentation outline influencers. This is a two stage process. The stages in this process are business, marketing, high, volume, low, chart.
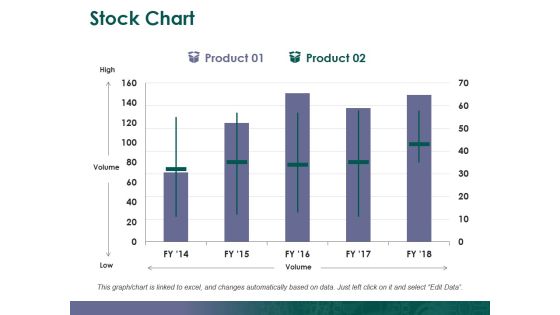
Stock Chart Ppt PowerPoint Presentation Outline Introduction
This is a stock chart ppt powerpoint presentation outline introduction. This is a two stage process. The stages in this process are stock chart, high, volume, low.

Line Chart Ppt PowerPoint Presentation Portfolio Deck
This is a line chart ppt powerpoint presentation portfolio deck. This is a two stage process. The stages in this process are business, marketing, profit, chart, percentage.

Column Chart Ppt PowerPoint Presentation Inspiration Picture
This is a column chart ppt powerpoint presentation inspiration picture. This is a two stage process. The stages in this process are business, marketing, years, expenditure in, chart.
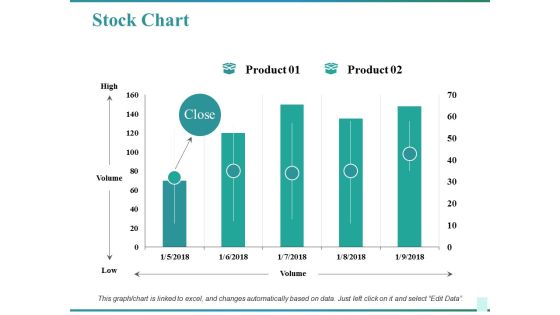
Stock Chart Ppt PowerPoint Presentation Pictures Microsoft
This is a stock chart ppt powerpoint presentation pictures microsoft. This is a two stage process. The stages in this process are business, high, volume, low, chart.
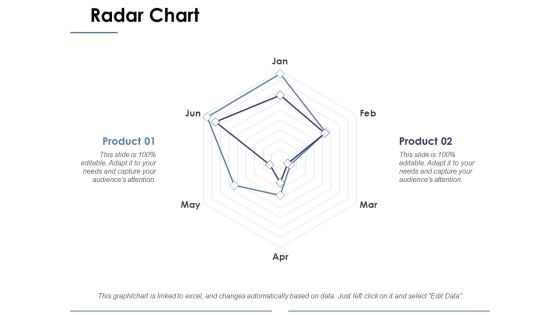
Radar Chart Ppt PowerPoint Presentation Portfolio Portrait
This is a radar chart ppt powerpoint presentation portfolio portrait. This is a two stage process. The stages in this process are business, radar chart, marketing, graph, strategy.

Column Chart Ppt PowerPoint Presentation Inspiration Inspiration
This is a column chart ppt powerpoint presentation inspiration inspiration. This is a two stage process. The stages in this process are column chart, growth, strategy, business, analysis.

Line Chart Ppt PowerPoint Presentation Model Model
This is a line chart ppt powerpoint presentation model model. This is a two stage process. The stages in this process are line chart, growth, strategy, business, analysis.
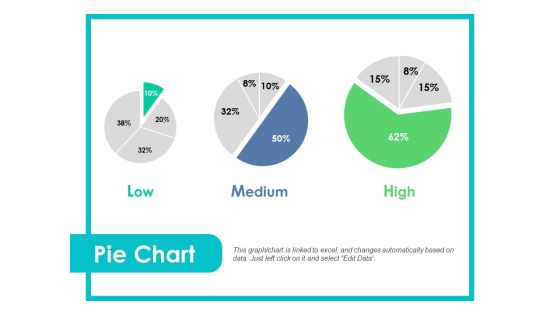
Pie Chart Ppt PowerPoint Presentation Gallery Brochure
This is a pie chart ppt powerpoint presentation gallery brochure. This is a three stages process. The stages in this process are low, medium, high, pie chart.

Scatter Chart Ppt PowerPoint Presentation Styles Guidelines
This is a scatter chart ppt powerpoint presentation styles guidelines. This is a two stage process. The stages in this process are scatter chart, percentage, product.

Radar Chart Ppt PowerPoint Presentation Professional Ideas
This is a radar chart ppt powerpoint presentation professional ideas. This is a two stage process. The stages in this process are product, percentage, management, marketing, chart.

Yearly Selling Forecasts Revenue Chart Summary PDF
This slide covers projections for yearly revenue generation from product sales. It includes forecasted revenue for different years and a graph depicting the projected sales revenue growth. Showcasing this set of slides titled Yearly Selling Forecasts Revenue Chart Summary PDF. The topics addressed in these templates are Project Sales Revenue, Forecasts Revenue Chart. All the content presented in this PPT design is completely editable. Download it and make adjustments in color, background, font etc. as per your unique business setting.

Company Product Sales Forecast Chart Guidelines PDF
This slide shows the Product sales forecast table with Product names along with price per unit and total units sold for the current as well as the projected period till the year 2023 Deliver an awe inspiring pitch with this creative company product sales forecast chart guidelines pdf bundle. Topics like company product sales forecast chart can be discussed with this completely editable template. It is available for immediate download depending on the needs and requirements of the user.
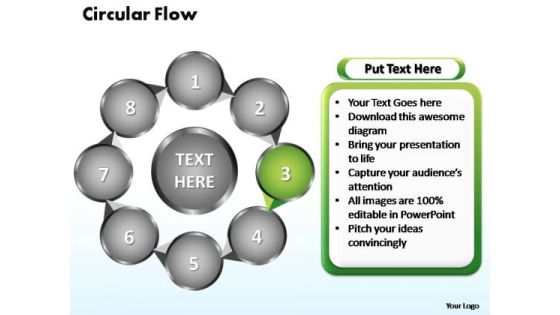
PowerPoint Slides Circular Flow Chart Ppt Theme
PowerPoint Slides Circular Flow Chart PPT Theme-Flowchart is a simple mapping tool that shows the sequence of actions within a process. Flowchart is widely used in business, education and economic presentations to help the audience visualize the content better, or to find flaws in a process.-PowerPoint Slides Circular Flow Chart PPT Theme
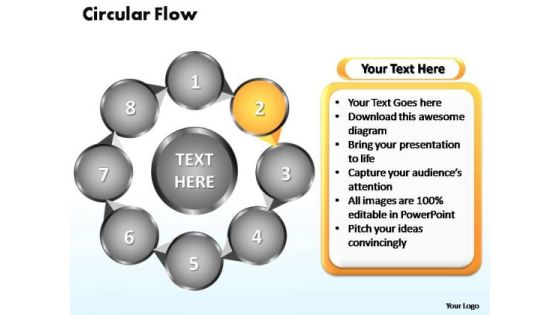
PowerPoint Slides Circular Flow Chart Ppt Themes
PowerPoint Slides Circular Flow Chart PPT Themes-Flowchart is a simple mapping tool that shows the sequence of actions within a process. Flowchart is widely used in business, education and economic presentations to help the audience visualize the content better, or to find flaws in a process.-PowerPoint Slides Circular Flow Chart PPT Themes

PowerPoint Slides Circular Flow Chart Ppt Template
PowerPoint Slides Circular Flow Chart PPT Template-Flowchart is a simple mapping tool that shows the sequence of actions within a process. Flowchart is widely used in business, education and economic presentations to help the audience visualize the content better, or to find flaws in a process.-PowerPoint Slides Circular Flow Chart PPT Template
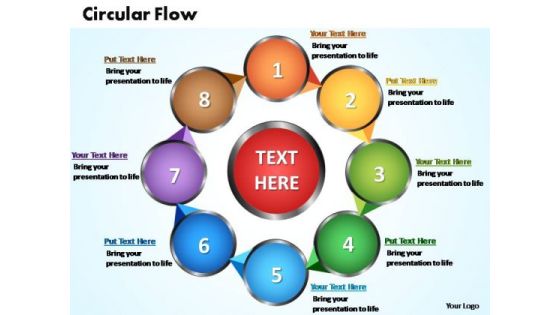
PowerPoint Slides Circular Flow Chart Ppt Templates
PowerPoint Slides Circular Flow Chart PPT Templates-Flowchart is a simple mapping tool that shows the sequence of actions within a process. Flowchart is widely used in business, education and economic presentations to help the audience visualize the content better, or to find flaws in a process.-PowerPoint Slides Circular Flow Chart PPT Templates
Pie Chart Ppt PowerPoint Presentation Outline Icons
This is a pie chart ppt powerpoint presentation outline icons. This is a three stage process. The stages in this process are pie chart, finance, marketing, strategy, business.
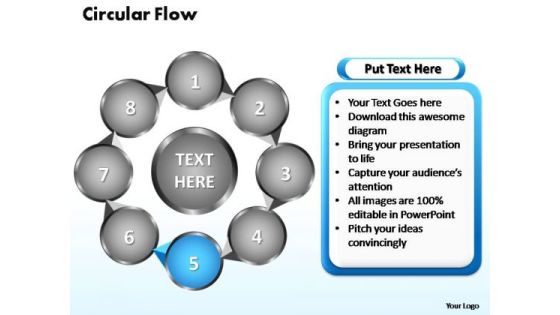
PowerPoint Slides Circular Flow Chart Ppt Design
PowerPoint Slides Circular Flow Chart PPT Design-Flowchart is a simple mapping tool that shows the sequence of actions within a process. Flowchart is widely used in business, education and economic presentations to help the audience visualize the content better, or to find flaws in a process.-PowerPoint Slides Circular Flow Chart PPT Design
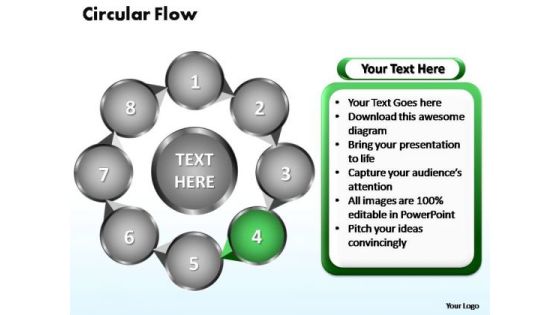
PowerPoint Slides Circular Flow Chart Ppt Designs
PowerPoint Slides Circular Flow Chart PPT Designs-Flowchart is a simple mapping tool that shows the sequence of actions within a process. Flowchart is widely used in business, education and economic presentations to help the audience visualize the content better, or to find flaws in a process.-PowerPoint Slides Circular Flow Chart PPT Designs
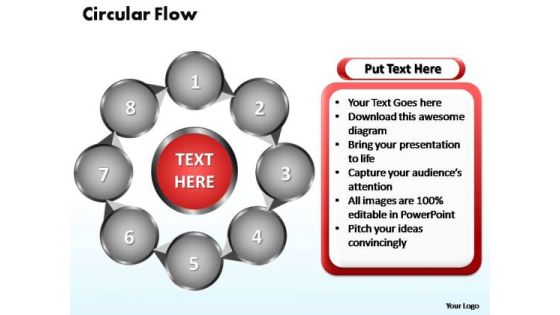
PowerPoint Slides Circular Flow Chart Ppt Layout
PowerPoint Slides Circular Flow Chart PPT Layout-Flowchart is a simple mapping tool that shows the sequence of actions within a process. Flowchart is widely used in business, education and economic presentations to help the audience visualize the content better, or to find flaws in a process.-PowerPoint Slides Circular Flow Chart PPT Layout

PowerPoint Slides Circular Flow Chart Ppt Layouts
PowerPoint Slides Circular Flow Chart PPT Layouts-Flowchart is a simple mapping tool that shows the sequence of actions within a process. Flowchart is widely used in business, education and economic presentations to help the audience visualize the content better, or to find flaws in a process.-PowerPoint Slides Circular Flow Chart PPT Layouts

PowerPoint Slides Circular Flow Chart Ppt Slide
PowerPoint Slides Circular Flow Chart PPT Slide-Flowchart is a simple mapping tool that shows the sequence of actions within a process. Flowchart is widely used in business, education and economic presentations to help the audience visualize the content better, or to find flaws in a process.-PowerPoint Slides Circular Flow Chart PPT Slide

PowerPoint Slides Circular Flow Chart Ppt Slides
PowerPoint Slides Circular Flow Chart PPT Slides-Flowchart is a simple mapping tool that shows the sequence of actions within a process. Flowchart is widely used in business, education and economic presentations to help the audience visualize the content better, or to find flaws in a process.-PowerPoint Slides Circular Flow Chart PPT Slides

Bubble Chart Ppt PowerPoint Presentation Slide
This is a bubble chart ppt powerpoint presentation slide. This is a eight stage process. The stages in this process are business, marketing, finance, chart, management.

Column Chart Ppt PowerPoint Presentation Influencers
This is a column chart ppt powerpoint presentation influencers. This is a two stage process. The stages in this process are column chart, finance, marketing, strategy, analysis, business.

Pie Chart Ppt PowerPoint Presentation Ideas Microsoft
This is a pie chart ppt powerpoint presentation ideas microsoft. This is a four stage process. The stages in this process are pie chart, finance, marketing, strategy, business.

Column Chart Ppt PowerPoint Presentation File Graphics
This is a column chart ppt powerpoint presentation file graphics. This is a two stage process. The stages in this process are column chart, finance, analysis, marketing, business.

Pie Chart Ppt PowerPoint Presentation Outline Gallery
This is a pie chart ppt powerpoint presentation outline gallery. This is a five stage process. The stages in this process are pie chart, finance, marketing, strategy, analysis.
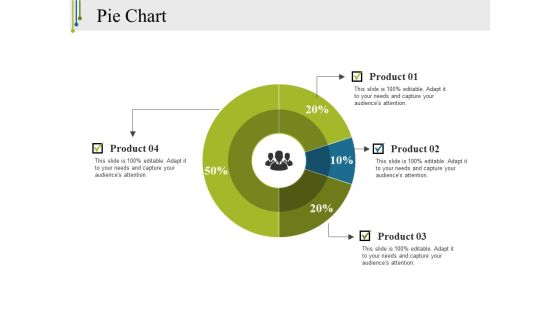
Pie Chart Ppt PowerPoint Presentation Infographics Clipart
This is a pie chart ppt powerpoint presentation infographics clipart. This is a four stage process. The stages in this process are pie chart, finance, marketing, strategy, business.

Area Chart Ppt PowerPoint Presentation Icon Microsoft
This is a area chart ppt powerpoint presentation icon microsoft. This is a two stage process. The stages in this process are business, strategy, analysis, planning, area chart.

Bubble Chart Ppt PowerPoint Presentation Portfolio Files
This is a bubble chart ppt powerpoint presentation portfolio files. This is a five stage process. The stages in this process are profit, bubble chart, in percentage.

Stock Chart Ppt PowerPoint Presentation Slides Guidelines
This is a stock chart ppt powerpoint presentation slides guidelines. This is a five stage process. The stages in this process are stock chart, volume, low, close, open.
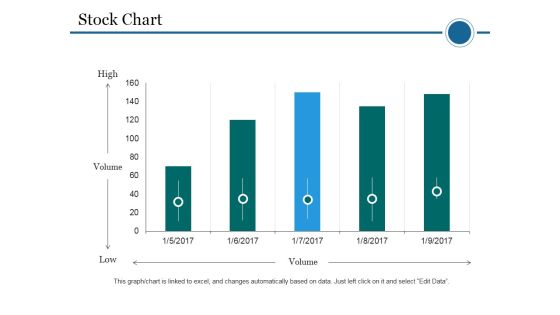
Stock Chart Ppt PowerPoint Presentation Professional Vector
This is a stock chart ppt powerpoint presentation professional vector. This is a five stage process. The stages in this process are stock chart, volume, high, low.

Area Chart Ppt PowerPoint Presentation Inspiration Images
This is a area chart ppt powerpoint presentation inspiration images. This is a two stage process. The stages in this process are area chart, product, sales in percentage.
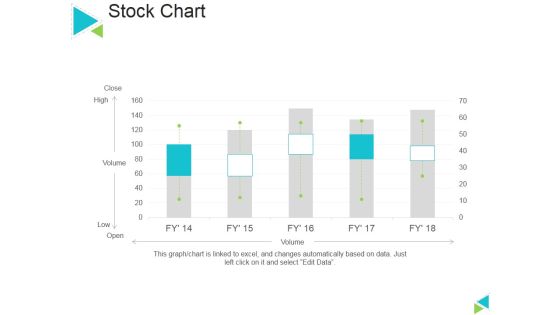
Stock Chart Ppt PowerPoint Presentation Ideas Slideshow
This is a stock chart ppt powerpoint presentation ideas slideshow. This is a five stage process. The stages in this process are stock chart, close, volume, open.
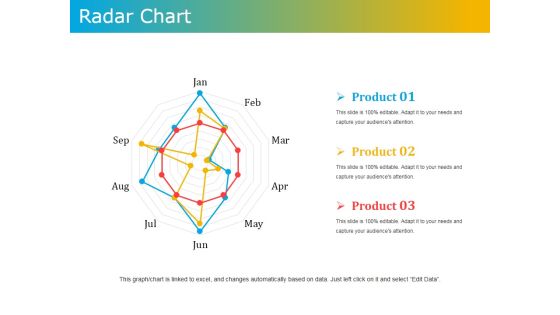
Radar Chart Ppt PowerPoint Presentation Outline Model
This is a radar chart ppt powerpoint presentation outline model. This is a three stage process. The stages in this process are radar chart, product, business, marketing, management.

Combo Chart Ppt PowerPoint Presentation Slides Smartart
This is a combo chart ppt powerpoint presentation slides smartart. This is a four stage process. The stages in this process are business, strategy, analysis, planning, combo chart.

Table Chart For Project Status Presentation Template
This pre-designed slide displays table chart. This slide has been carefully designed with graphics of table chart. Use this chart to display projects status.
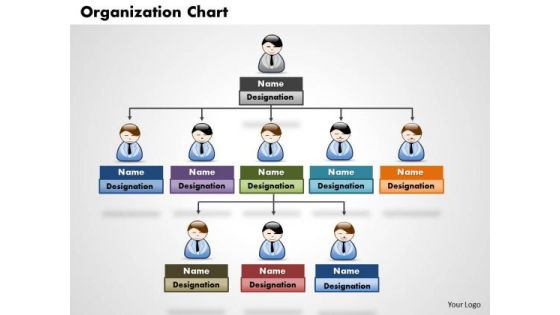
Business Diagram Organization Chart PowerPoint Ppt Presentation
Open Up Doors That Lead To Success. Our Business Diagram Organization chart PowerPoint PPT Presentation PowerPoint Templates Provide The Handles.
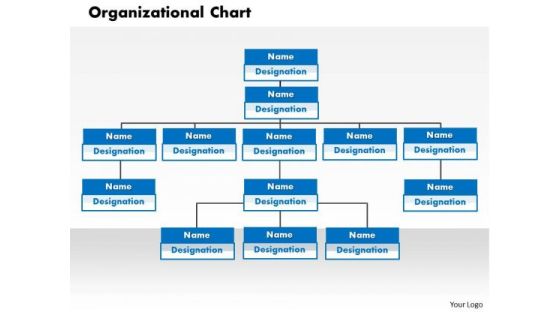
Business Diagram Organizational Chart PowerPoint Ppt Presentation
Our Business Diagram Organizational Chart PowerPoint PPT Presentation PowerPoint Templates Abhor Doodling. They Never Let The Interest Flag.
Pie Chart Business PowerPoint Presentation Slides C
Microsoft PowerPoint Slides and Backgrounds with render illustration of equal partnership pie chart

Pie Chart Business PowerPoint Presentation Slides Cc
Microsoft PowerPoint Slides and Backgrounds with render illustration of equal partnership pie chart
Pie Chart Business PowerPoint Presentation Slides F
Microsoft PowerPoint Slides and Backgrounds with render illustration of equal partnership pie chart

Pie Chart Business PowerPoint Presentation Slides R
Microsoft PowerPoint Slides and Backgrounds with render illustration of equal partnership pie chart

Pie Chart Business PowerPoint Presentation Slides S
Microsoft PowerPoint Slides and Backgrounds with render illustration of equal partnership pie chart

Combo Chart Ppt PowerPoint Presentation Icon Portrait
This is a combo chart ppt powerpoint presentation icon portrait. This is a three stage process. The stages in this process are combo chart, finance, marketing, strategy, analysis.

Area Chart Ppt PowerPoint Presentation Outline Deck
This is a area chart ppt powerpoint presentation outline deck. This is a two stage process. The stages in this process are area chart, finance, marketing, analysis, business.

Combo Chart Ppt PowerPoint Presentation Portfolio Template
This is a combo chart ppt powerpoint presentation portfolio template. This is a three stage process. The stages in this process are product, business, marketing, combo chart, percentage.

Area Chart Ppt PowerPoint Presentation Professional Infographics
This is a area chart ppt powerpoint presentation professional infographics. This is a two stage process. The stages in this process are business, strategy, analysis, planning, area chart.

PowerPoint Themes Circular Flow Chart Ppt Template
PowerPoint Themes Circular Flow Chart PPT Template-Flowchart is a simple mapping tool that shows the sequence of actions within a process. Flowchart is widely used in business, education and economic presentations to help the audience visualize the content better, or to find flaws in a process.-PowerPoint Themes Circular Flow Chart PPT Template
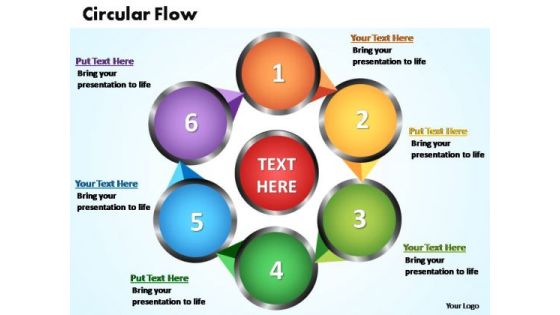
PowerPoint Themes Circular Flow Chart Ppt Templates
PowerPoint Themes Circular Flow Chart PPT Templates-Flowchart is a simple mapping tool that shows the sequence of actions within a process. Flowchart is widely used in business, education and economic presentations to help the audience visualize the content better, or to find flaws in a process.-PowerPoint Themes Circular Flow Chart PPT Templates

PowerPoint Themes Circular Flow Chart Ppt Theme
PowerPoint Themes Circular Flow Chart PPT Theme-Flowchart is a simple mapping tool that shows the sequence of actions within a process. Flowchart is widely used in business, education and economic presentations to help the audience visualize the content better, or to find flaws in a process.-PowerPoint Themes Circular Flow Chart PPT Theme

PowerPoint Themes Circular Flow Chart Ppt Design
PowerPoint Themes Circular Flow Chart PPT Design-Flowchart is a simple mapping tool that shows the sequence of actions within a process. Flowchart is widely used in business, education and economic presentations to help the audience visualize the content better, or to find flaws in a process.-PowerPoint Themes Circular Flow Chart PPT Design

PowerPoint Themes Circular Flow Chart Ppt Designs
PowerPoint Themes Circular Flow Chart PPT Designs-Flowchart is a simple mapping tool that shows the sequence of actions within a process. Flowchart is widely used in business, education and economic presentations to help the audience visualize the content better, or to find flaws in a process.-PowerPoint Themes Circular Flow Chart PPT Designs
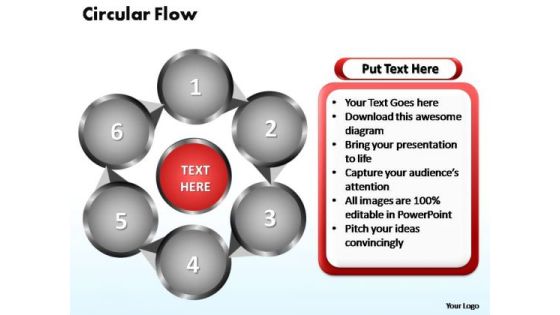
PowerPoint Themes Circular Flow Chart Ppt Layouts
PowerPoint Themes Circular Flow Chart PPT Layouts-Flowchart is a simple mapping tool that shows the sequence of actions within a process. Flowchart is widely used in business, education and economic presentations to help the audience visualize the content better, or to find flaws in a process.-PowerPoint Themes Circular Flow Chart PPT Layouts
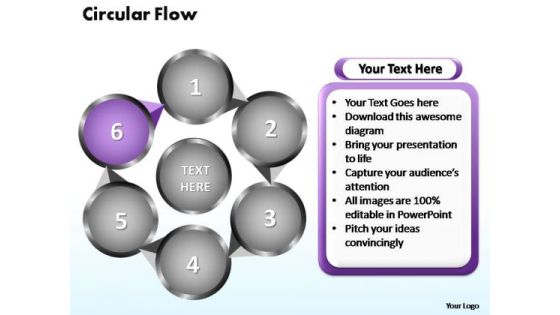
PowerPoint Themes Circular Flow Chart Ppt Slide
PowerPoint Themes Circular Flow Chart PPT Slide-Flowchart is a simple mapping tool that shows the sequence of actions within a process. Flowchart is widely used in business, education and economic presentations to help the audience visualize the content better, or to find flaws in a process.-PowerPoint Themes Circular Flow Chart PPT Slide

PowerPoint Themes Circular Flow Chart Ppt Slides
PowerPoint Themes Circular Flow Chart PPT Slides-Flowchart is a simple mapping tool that shows the sequence of actions within a process. Flowchart is widely used in business, education and economic presentations to help the audience visualize the content better, or to find flaws in a process.-PowerPoint Themes Circular Flow Chart PPT Slides
Golden Graph Chart PowerPoint Icon C
Golden graph chart good better best on white background
Golden Graph Chart PowerPoint Icon S
Golden graph chart good better best on white background
Bar Arrow Chart PowerPoint Icon C
business bar chart with arrows isolated on a white background.
Bar Arrow Chart PowerPoint Icon Cc
business bar chart with arrows isolated on a white background.
Bar Arrow Chart PowerPoint Icon S
business bar chart with arrows isolated on a white background.

Chart Growth Business PowerPoint Template 0910
Arrow pointing to the higher financial chart bar 3d illustration

Combo Chart Ppt PowerPoint Presentation Gallery Themes
This is a combo chart ppt powerpoint presentation gallery themes. This is a three stage process. The stages in this process are combo chart, finance, marketing, strategy, investment, business.
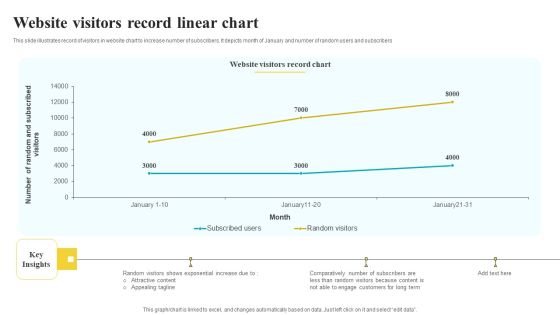
Website Visitors Record Linear Chart Summary PDF
This slide illustrates record of visitors in website chart to increase number of subscribers. It depicts month of January and number of random users and subscribers Showcasing this set of slides titled Website Visitors Record Linear Chart Summary PDF. The topics addressed in these templates are Key Insights, Record Chart, Long Term. All the content presented in this PPT design is completely editable. Download it and make adjustments in color, background, font etc. as per your unique business setting.

Clustered Combo Chart Ppt PowerPoint Presentation Show
This is a clustered combo chart ppt powerpoint presentation show. This is a eigth stage process. The stages in this process are clustered combo chart, finance, marketing, strategy, investment, business.

Area Chart Ppt PowerPoint Presentation Pictures Show
This is a area chart ppt powerpoint presentation pictures show. This is a two stage process. The stages in this process are area chart, finance, marketing, management, investment, analysis.
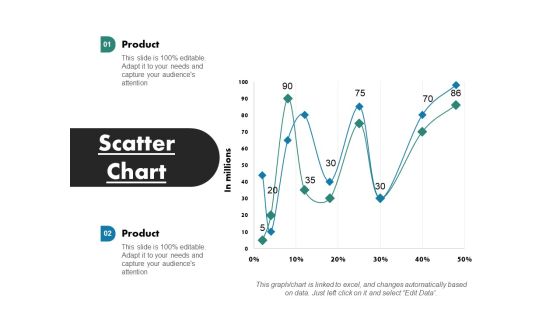
Scatter Chart Ppt PowerPoint Presentation Infographics Designs
This is a scatter chart ppt powerpoint presentation infographics designs. This is a two stage process. The stages in this process are scatter chart, finance, marketing, management, investment, analysis.
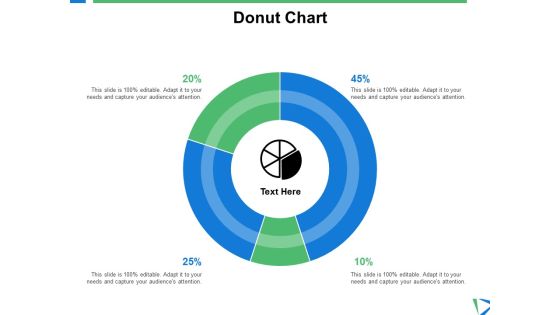
Donut Chart Investment Ppt PowerPoint Presentation Shapes
This is a donut chart investment ppt powerpoint presentation shapes. This is a four stage process. The stages in this process are finance, analysis, business, investment, marketing.
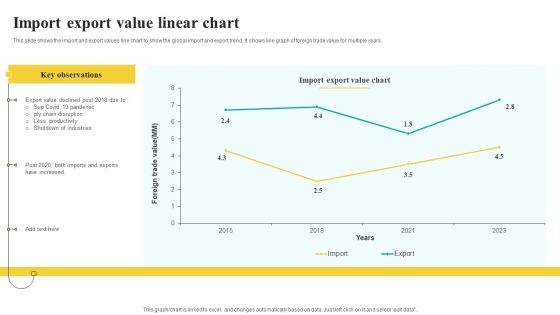
Import Export Value Linear Chart Summary PDF
This slide shows the import and export values line chart to show the global import and export trend. It shows line graph of foreign trade value for multiple years Showcasing this set of slides titled Import Export Value Linear Chart Summary PDF. The topics addressed in these templates are Key Observations, Value Chart, Industries. All the content presented in this PPT design is completely editable. Download it and make adjustments in color, background, font etc. as per your unique business setting.

Software Sales Distribution Circle Chart Demonstration PDF
This slide shows sales distribution of software chart to determine market leader in IT industry. It shows quarterly software sales distribution in percentage. Pitch your topic with ease and precision using this Software Sales Distribution Circle Chart Demonstration PDF. This layout presents information on Software Sales Distribution, Circle Chart. It is also available for immediate download and adjustment. So, changes can be made in the color, design, graphics or any other component to create a unique layout.
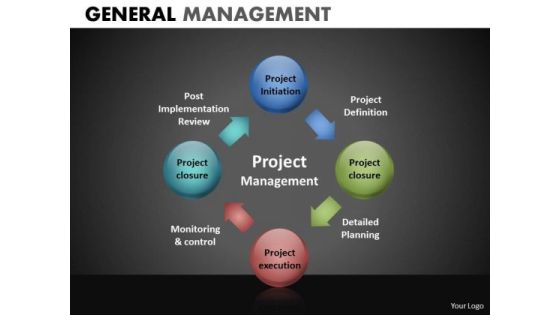
Project Management Process Circle Chart PowerPoint Templates
Project Management Process Circle Chart PowerPoint Templates-These high quality powerpoint pre-designed slides and powerpoint templates have been carefully created by our professional team to help you impress your audience. All slides have been created and are 100% editable in powerpoint. Each and every property of any graphic - color, size, orientation, shading, outline etc. can be modified to help you build an effective powerpoint presentation. Any text can be entered at any point in the powerpoint template or slide. Simply DOWNLOAD, TYPE and PRESENT!-These PowerPoint presentation slides can be used to represent concepts relating to--Abstract, action, analysis, blank, business, chart, clipart, commerce, concept, conceptual, design, diagram, direction, flow, generic, goals, guide, guidelines, heirarchy, icon, idea, illustration, lingakes, links, manage, management, mba, model, organization, performance, plan, process, project, relationship, representation, resource, steps, strategy, success, tactics, theoretical, theory, tool, workflow-Project Management Process Circle Chart PowerPoint Templates
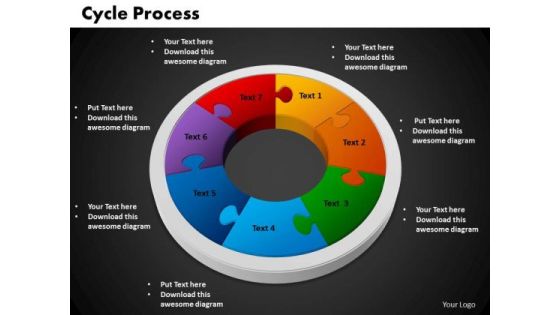
PowerPoint Theme Cycle Process Chart Ppt Slide
PowerPoint Theme Cycle Process Chart PPT Slide-Cycle Diagrams are a type of graphics that shows how items are related to one another in a repeating cycle. In a cycle diagram, you can explain the main events in the cycle, how they interact, and how the cycle repeats. -PowerPoint Theme Cycle Process Chart PPT Slide-Business, Chart, Circle, Cycle, Marketing, Manage, Investment, Information, Growth, Graph, Flow, Process, Progress, Recycle, Rotation, Sequence, Sphere, Plan, Diagram, Direction
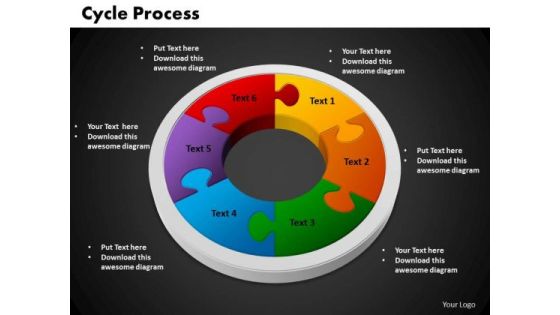
PowerPoint Backgrounds Cycle Process Chart Ppt Themes
PowerPoint Backgrounds Cycle Process Chart PPT Themes-This Cycle Diagram is a type of graphics that shows how items are related to one another in a repeating cycle. In a cycle diagram, you can explain the main events in the cycle, how they interact, and how the cycle repeats. -PowerPoint Backgrounds Cycle Process Chart PPT Themes-Business, Chart, Circle, Cycle, Marketing, Manage, Investment, Information, Growth, Graph, Flow, Process, Progress, Recycle, Rotation, Sequence, Sphere, Plan, Diagram, Direction

PowerPoint Backgrounds Cycle Process Chart Ppt Designs
PowerPoint Backgrounds Cycle Process Chart PPT Designs-This Cycle Diagram is a type of graphics that shows how items are related to one another in a repeating cycle. In a cycle diagram, you can explain the main events in the cycle, how they interact, and how the cycle repeats. -PowerPoint Backgrounds Cycle Process Chart PPT Designs-Business, Chart, Circle, Cycle, Marketing, Manage, Investment, Information, Growth, Graph, Flow, Process, Progress, Recycle, Rotation, Sequence, Sphere, Plan, Diagram, Direction

Bar Chart Ppt PowerPoint Presentation Icon Layout
This is a bar chart ppt powerpoint presentation icon layout. This is a one stage process. The stages in this process are sales in percentage, financial years, bar chart, finance, marketing.

Bar Chart Ppt PowerPoint Presentation Icon Inspiration
This is a bar chart ppt powerpoint presentation icon inspiration. This is a three stage process. The stages in this process are bar chart, finance, marketing, strategy, analysis, business.

Bar Chart Ppt PowerPoint Presentation Styles Smartart
This is a bar chart ppt powerpoint presentation styles smartart. This is a two stage process. The stages in this process are bar chart, growth, finance, marketing, strategy, analysis.

Bar Chart Ppt PowerPoint Presentation Slides Model
This is a bar chart ppt powerpoint presentation slides model. This is a two stage process. The stages in this process are bar chart, analysis, business, marketing, strategy, finance.

Bar Chart Ppt PowerPoint Presentation Slide Download
This is a bar chart ppt powerpoint presentation slide download. This is a three stage process. The stages in this process are chart, in years, unit count, business, marketing.

Column Chart Ppt PowerPoint Presentation Layouts Vector
This is a column chart ppt powerpoint presentation layouts vector. This is a two stage process. The stages in this process are product, column chart, bar graph, percentage, finance.

Area Chart Ppt PowerPoint Presentation Portfolio Templates
This is a area chart ppt powerpoint presentation portfolio templates. This is a two stage process. The stages in this process are sales in percentage, chart, business, marketing, finance.

Area Chart Ppt PowerPoint Presentation Styles Templates
This is a area chart ppt powerpoint presentation styles templates. This is a two stage process. The stages in this process are area chart, growth, finance, marketing, strategy, analysis.
Scatter Chart Ppt PowerPoint Presentation Icon Smartart
This is a scatter chart ppt powerpoint presentation icon smartart. This is a one stage process. The stages in this process are scatter chart, finance, business, planning, marketing, management.

Area Chart Ppt PowerPoint Presentation Summary Format
This is a area chart ppt powerpoint presentation summary format. This is a two stage process. The stages in this process are area chart, planning, marketing, strategy, finance, business.

Stock Chart Ppt PowerPoint Presentation Infographics Smartart
This is a stock chart ppt powerpoint presentation infographics smartart. This is a two stages process. The stages in this process are stock chart, finance, business, planning, marketing, management.

Column Chart Ppt PowerPoint Presentation File Show
This is a column chart ppt powerpoint presentation file show. This is a two stage process. The stages in this process are column chart, finance, marketing, growth, strategy, business.

Area Chart Ppt PowerPoint Presentation Pictures Slideshow
This is a area chart ppt powerpoint presentation pictures slideshow. This is a two stage process. The stages in this process are area chart, finance, analysis, marketing, strategy, business.

Area Chart Ppt PowerPoint Presentation Model Layout
This is a area chart ppt powerpoint presentation model layout. This is a two stage process. The stages in this process are area chart, finance, marketing, strategy, analysis, business.
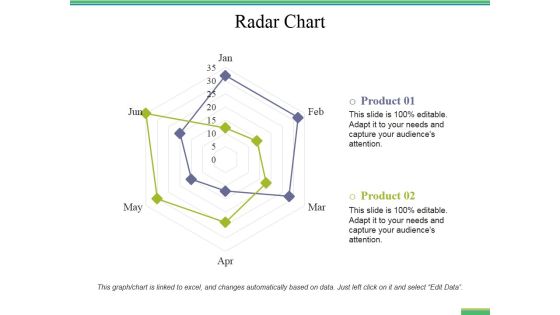
Radar Chart Ppt PowerPoint Presentation Ideas Slides
This is a radar chart ppt powerpoint presentation ideas slides. This is a two stage process. The stages in this process are radar chart, management, finance, marketing, strategy, business.

Column Chart Ppt PowerPoint Presentation Pictures Outfit
This is a column chart ppt powerpoint presentation pictures outfit. This is a two stage process. The stages in this process are column chart, finance, marketing, strategy, analysis, business.

Bubble Chart Ppt PowerPoint Presentation Inspiration Picture
This is a bubble chart ppt powerpoint presentation inspiration picture. This is a two stage process. The stages in this process are bubble chart, growth, finance, marketing, strategy, analysis.

Radar Chart Ppt PowerPoint Presentation Professional Brochure
This is a radar chart ppt powerpoint presentation professional brochure. This is a two stage process. The stages in this process are radar chart, finance, marketing, strategy, analysis, business.

Combo Chart Ppt PowerPoint Presentation Inspiration Vector
This is a combo chart ppt powerpoint presentation inspiration vector. This is a three stage process. The stages in this process are combo chart, finance, marketing, strategy, analysis, business.

Area Chart Ppt PowerPoint Presentation Inspiration Professional
This is a area chart ppt powerpoint presentation inspiration professional. This is a two stage process. The stages in this process are financial year, in percentage, area chart, finance, business, marketing.

Column Chart Ppt PowerPoint Presentation Inspiration Good
This is a column chart ppt powerpoint presentation inspiration good. This is a two stage process. The stages in this process are column chart, finance, marketing, strategy, analysis, business.

Area Chart Ppt PowerPoint Presentation Model Slides
This is a area chart ppt powerpoint presentation model slides. This is a two stage process. The stages in this process are business, marketing, sales in percentage, chart, percentage, finance.
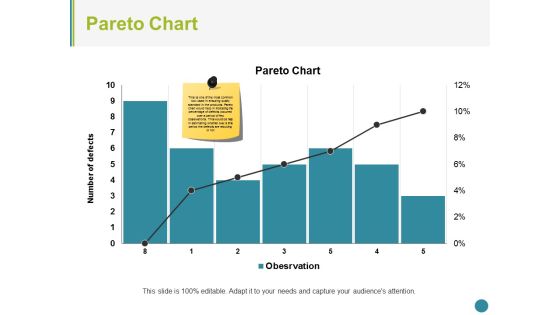
Pareto Chart Ppt PowerPoint Presentation Summary Structure
This is a pareto chart ppt powerpoint presentation summary structure. This is a seven stage process. The stages in this process are pareto chart, finance, marketing, strategy, analysis, business.

Area Chart Ppt PowerPoint Presentation Ideas Professional
This is a area chart ppt powerpoint presentation ideas professional. This is a two stage process. The stages in this process are business, sales in percentage, area chart, marketing, finance.

Combo Chart Ppt PowerPoint Presentation Infographics Sample
This is a combo chart ppt powerpoint presentation infographics sample. This is a three stage process. The stages in this process are combo chart, finance, analysis, marketing, strategy, business.

Area Chart Ppt PowerPoint Presentation Infographics Images
This is a area chart ppt powerpoint presentation infographics images. This is a two stage process. The stages in this process are area chart, finance, marketing, analysis, strategy, business.

Area Chart Ppt PowerPoint Presentation Infographics Guide
This is a area chart ppt powerpoint presentation infographics guide. This is a two stage process. The stages in this process are area chart, product, sales in percentage, finance, business.

Area Chart Ppt PowerPoint Presentation Layouts Images
This is a area chart ppt powerpoint presentation layouts images. This is a two stage process. The stages in this process are product, sales in percentage, area chart, percentage, finance.

Area Chart Ppt PowerPoint Presentation Pictures Template
This is a area chart ppt powerpoint presentation pictures template. This is a two stage process. The stages in this process are sales in percentage, chart, business, marketing, strategy.

Column Chart Ppt PowerPoint Presentation Background Images
This is a column chart ppt powerpoint presentation background images. This is a two stage process. The stages in this process are column chart, financial, business, marketing, planning, strategy.

Area Chart Ppt PowerPoint Presentation Inspiration Demonstration
This is a area chart ppt powerpoint presentation inspiration demonstration. This is a two stage process. The stages in this process are sales in percentage, chart, percentage, business, marketing.

Area Chart Ppt PowerPoint Presentation Model Introduction
This is a area chart ppt powerpoint presentation model introduction. This is a two stage process. The stages in this process are sales in percentage, area chart, percentage, business, marketing.

Area Chart Ppt PowerPoint Presentation Styles Show
This is a area chart ppt powerpoint presentation styles show. This is a two stage process. The stages in this process are business, marketing, area chart, sales in percentage, percentage.

Bubble Chart Ppt PowerPoint Presentation Outline Deck
This is a bubble chart ppt powerpoint presentation outline deck. This is a two stage process. The stages in this process are in percentage, profit, bubble chart, business, marketing.
