Brick

3D Bar Chart To Display Data Ppt PowerPoint Presentation Icon Design Inspiration
This is a 3d bar chart to display data ppt powerpoint presentation icon design inspiration. This is a four stage process. The stages in this process are art, colouring, paint brush.

100 Percent Stacked Bar Strategy Approaches Ppt PowerPoint Presentation Gallery Visual Aids
This is a 100 percent stacked bar strategy approaches ppt powerpoint presentation gallery visual aids. This is a three stage process. The stages in this process are business, management, strategy, analysis, marketing.

Clustered Bar Chart Yearly Operating Plan Ppt PowerPoint Presentation Styles Icon
This is a clustered bar chart yearly operating plan ppt powerpoint presentation styles icon. This is a four stage process. The stages in this process are business, management, strategy, analysis, marketing.

Bar Charts For Business Performance Analysis Ppt PowerPoint Presentation Show Slideshow
This is a bar charts for business performance analysis ppt powerpoint presentation show slideshow. This is a two stage process. The stages in this process are compare, comparison of two, competitive analysis.

Demonstration Icon Man Showing Bar Chart Ppt Powerpoint Presentation Styles Ideas
This is a demonstration icon man showing bar chart ppt powerpoint presentation styles ideas. This is a three stage process. The stages in this process are illustration, show, demo.

Cost Reduction Analysis Bar Chart Ppt Powerpoint Presentation File Graphics Design
This is a cost reduction analysis bar chart ppt powerpoint presentation file graphics design. This is a five stage process. The stages in this process are data analysis, data science, information science.
Stock Market Trend Dollar Sign On Bar Graph Ppt Powerpoint Presentation Show Deck
This is a stock market trend dollar sign on bar graph ppt powerpoint presentation show deck. This is a four stage process. The stages in this process are stock market, financial market, bull market.

Staked Bar Planning Business Ppt PowerPoint Presentation Infographic Template Infographic Template
This is a staked bar planning business ppt powerpoint presentation infographic template infographic template. This is a three stage process. The stages in this process are finance, marketing, analysis, business, investment.
Growth Arrow On Bar Graph Icon Ppt Powerpoint Presentation Infographic Template Clipart
This is a growth arrow on bar graph icon ppt powerpoint presentation infographic template clipart. This is a three stage process. The stages in this process are financial statements icon, accounting ratio icon, balance sheet icon.
Bar Graph Icon Showing Operating Rhythm Ppt Powerpoint Presentation Ideas Templates
This is a bar graph icon showing operating rhythm ppt powerpoint presentation ideas templates. This is a three stage process. The stages in this process are six sigma, operating rhythm, business rhythm.

Bar Chart With Growth Arrow For Business Expansion Ppt Powerpoint Presentation File Vector
This is a bar chart with growth arrow for business expansion ppt powerpoint presentation file vector. This is a two stage process. The stages in this process are expanding, business development, business expansion.

Bar Chart With Magnifying Glass For Financial Analysis Ppt Powerpoint Presentation Infographics Designs Download
This is a bar chart with magnifying glass for financial analysis ppt powerpoint presentation infographics designs download. This is a three stage process. The stages in this process are business metrics, business kpi, business dashboard.

Business Outcomes Vector Icons Showing Pie And Bar Graph Ppt Powerpoint Presentation File Graphic Images
This is a business outcomes vector icons showing pie and bar graph ppt powerpoint presentation file graphic images. This is a three stage process. The stages in this process are business outcomes, business results, business output.

Bar Graph To Present Financial Information Ppt PowerPoint Presentation Show Tips
This is a bar graph to present financial information ppt powerpoint presentation show tips. This is a four stage process. The stages in this process are stock market, financial markets, bull market.

Bar Graph Icon For Data Analysis Ppt PowerPoint Presentation Pictures Ideas
This is a bar graph icon for data analysis ppt powerpoint presentation pictures ideas. This is a four stage process. The stages in this process are financial analysis, quantitative, statistical modelling.

Quantitative Bar Chart For Data Analysis Ppt PowerPoint Presentation Model Graphic Tips
This is a quantitative bar chart for data analysis ppt powerpoint presentation model graphic tips. This is a two stage process. The stages in this process are financial analysis, quantitative, statistical modelling.

Financial Analysis Vector Bar Graph With Magnifying Glass Ppt PowerPoint Presentation Gallery Design Ideas
This is a financial analysis vector bar graph with magnifying glass ppt powerpoint presentation gallery design ideas. This is a four stage process. The stages in this process are marketing analytics, marketing performance, marketing discovery.

Worldwide Market Trends Mobile With Bar Graph And Globe Ppt PowerPoint Presentation Styles Demonstration
This is a worldwide market trends mobile with bar graph and globe ppt powerpoint presentation styles demonstration. This is a four stage process. The stages in this process are marketing analytics, marketing performance, marketing discovery.

Bar Graph With Downward Arrow For Business Failure Ppt PowerPoint Presentation Inspiration Graphics
This is a bar graph with downward arrow for business failure ppt powerpoint presentation inspiration graphics. This is a four stage process. The stages in this process are business failure, unsuccessful business, business non success.

Downward Arrow On Bar Graph For Financial Loss Ppt PowerPoint Presentation Infographics Sample
This is a downward arrow on bar graph for financial loss ppt powerpoint presentation infographics sample. This is a three stage process. The stages in this process are business failure, unsuccessful business, business non success.
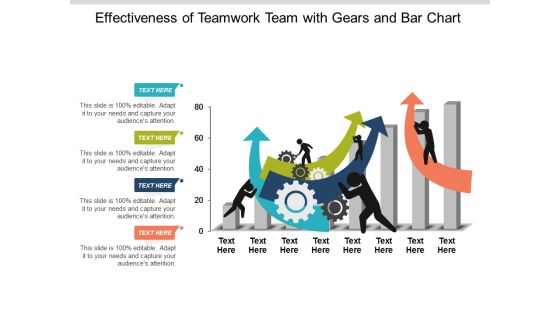
Effectiveness Of Teamwork Team With Gears And Bar Chart Ppt Powerpoint Presentation Ideas Information
This is a effectiveness of teamwork team with gears and bar chart ppt powerpoint presentation ideas information. This is a four stage process. The stages in this process are team performance, member performance, group performance.

Clustered Bar Chart Percentage Product Ppt PowerPoint Presentation Portfolio Example Introduction
This is a clustered bar chart percentage product ppt powerpoint presentation portfolio example introduction. This is a three stage process. The stages in this process are area chart, finance, marketing, management, investment.
Financial And Income Growth Bar Graph Dollar Sign Ppt PowerPoint Presentation Professional Shapes
This is a financial and income growth bar graph dollar sign ppt powerpoint presentation professional shapes. This is a four stage process. The stages in this process are growth, increase sales, increase revenue.
Financial Growth Strategy Arrow Up On Bar Graph Ppt PowerPoint Presentation Gallery Example
This is a financial growth strategy arrow up on bar graph ppt powerpoint presentation gallery example. This is a four stage process. The stages in this process are growth, increase sales, increase revenue.
Profit Growth Bar Graph With Rising Arrow And Dollar Sign Ppt PowerPoint Presentation Icon Designs
This is a profit growth bar graph with rising arrow and dollar sign ppt powerpoint presentation icon designs. This is a five stage process. The stages in this process are growth, increase sales, increase revenue.

Visual Data Presentation With Bar Chart Ppt PowerPoint Presentation Portfolio Brochure
This is a visual data presentation with bar chart ppt powerpoint presentation portfolio brochure. This is a four stage process. The stages in this process are visual aids, communication, business.

Growth Arrow On Bar Graph Vector Ppt Powerpoint Presentation Layouts Master Slide
This is a growth arrow on bar graph vector ppt powerpoint presentation layouts master slide. This is a three stage process. The stages in this process are increasing arrows, improving arrows, growing arrows.
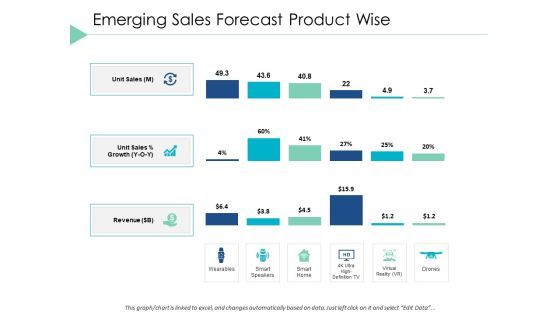
Emerging Sales Forecast Product Wise Bar Ppt PowerPoint Presentation Portfolio Slide Portrait
This is a emerging sales forecast product wise bar ppt powerpoint presentation portfolio slide portrait. This is a four stage process. The stages in this process are finance, marketing, analysis, investment, million.

Bar Graph With Upward Arrow For Financial Success Ppt PowerPoint Presentation Infographic Template Model
This is a bar graph with upward arrow for financial success ppt powerpoint presentation infographic template model. This is a five stage process. The stages in this process are rising arrow, growing arrow, increasing arrow.

Economic Growth Arrow With Bar Graph On Human Hand Ppt PowerPoint Presentation Infographics Ideas
This is a economic growth arrow with bar graph on human hand ppt powerpoint presentation infographics ideas. This is a four stage process. The stages in this process are rising arrow, growing arrow, increasing arrow.

Financial Success Arrow On Bar Chart Ppt PowerPoint Presentation Ideas Display
This is a financial success arrow on bar chart ppt powerpoint presentation ideas display. This is a four stage process. The stages in this process are rising arrow, growing arrow, increasing arrow.

Bar Graph Finance Planning Ppt PowerPoint Presentation Infographic Template Master Slide
This is a bar graph finance planning ppt powerpoint presentation infographic template master slide. This is a two stage process. The stages in this process are finance, analysis, business, investment, marketing.

Bar Chart Showing Consumer Adoption Patterns Ppt Powerpoint Presentation Outline Professional
This is a bar chart showing consumer adoption patterns ppt powerpoint presentation outline professional. The topics discussed in this diagram are customer service, customer success, customer adoption. This is a completely editable PowerPoint presentation, and is available for immediate download.
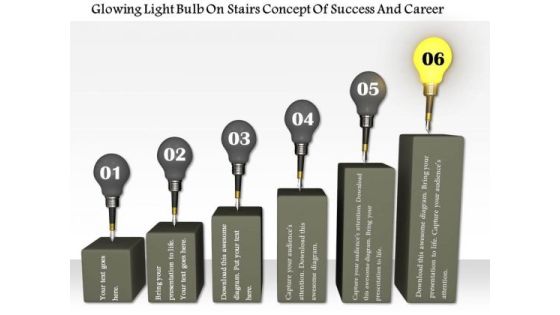
Stock Photo Glowing Bulb On Top Of Bar Graph PowerPoint Slide
This conceptual image slide displays bulbs on bar graph. This image slide has been crafted with graphic of bar graph and bulbs and individual glowing bulb. This image slide depicts success and carrier. Use this image slide to express views on leadership, teamwork, success, achievements and growth in your presentations. This image slide may also be used to represent different business strategies. Create beautiful presentations using this image slide.
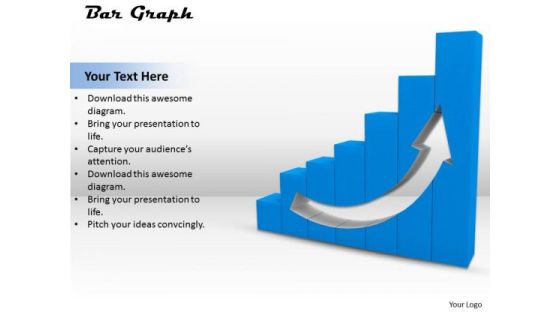
Stock Photo Blue Bar Graph With Growth Arrow For Business PowerPoint Slide
This image slide displays bar graph with growth arrow. This image has been designed with graphic of blue colored bar graph embedded with growth arrow . Use this image slide, in your presentations to express views on finance, growth and achievements. This image slide may also be used to exhibit any information which requires visual presentation in your presentations. This image slide will enhance the quality of your presentations.

Stock Photo Colorful Bar Graph For Business Result Display PowerPoint Slide
This image slide displays bar graph. This image has been designed with graphic of 3d multicolor bar graph of solid cylinder shape. Use this image slide, in your presentations to express views on finance, growth and success. This image slide may also be used to exhibit any information which requires visual presentation in your presentations. This image slide will enhance the quality of your presentations.

Cocktail Bar Business Plan Ppt PowerPoint Presentation Icon Background Designs Cpb Pdf
Presenting this set of slides with name cocktail bar business plan ppt powerpoint presentation icon background designs cpb pdf. This is an editable Powerpoint two stages graphic that deals with topics like cocktail bar business plan to help convey your message better graphically. This product is a premium product available for immediate download and is 100 percent editable in Powerpoint. Download this now and use it in your presentations to impress your audience.
Downturn Graph Icon With Bar Chart And Arrow Ppt PowerPoint Presentation Slides Design Templates PDF
Pitch your topic with ease and precision using this downturn graph icon with bar chart and arrow ppt powerpoint presentation slides design templates pdf. This layout presents information on downturn graph icon with bar chart and arrow. It is also available for immediate download and adjustment. So, changes can be made in the color, design, graphics or any other component to create a unique layout.

Bar Chart With Person Standing On Right Side Ppt PowerPoint Presentation File Portrait PDF
Persuade your audience using this bar chart with person standing on right side ppt powerpoint presentation file portrait pdf. This PPT design covers three stages, thus making it a great tool to use. It also caters to a variety of topics including bar chart with person standing on right side. Download this PPT design now to present a convincing pitch that not only emphasizes the topic but also showcases your presentation skills.

Bar Graph With Eye For Future Planning Ppt PowerPoint Presentation Icon Outline PDF
Persuade your audience using this bar graph with eye for future planning ppt powerpoint presentation icon outline pdf. This PPT design covers three stages, thus making it a great tool to use. It also caters to a variety of topics including bar graph with eye for future planning. Download this PPT design now to present a convincing pitch that not only emphasizes the topic but also showcases your presentation skills.

Business Trends Bar Chart Vector Icon Ppt PowerPoint Presentation Inspiration Graphic Images PDF
Persuade your audience using this business trends bar chart vector icon ppt powerpoint presentation inspiration graphic images pdf. This PPT design covers three stages, thus making it a great tool to use. It also caters to a variety of topics including business trends bar chart vector icon. Download this PPT design now to present a convincing pitch that not only emphasizes the topic but also showcases your presentation skills.

Businessman With Bar Graph Vector Icon Ppt PowerPoint Presentation File Deck PDF
Persuade your audience using this businessman with bar graph vector icon ppt powerpoint presentation file deck pdf. This PPT design covers three stages, thus making it a great tool to use. It also caters to a variety of topics including businessman with bar graph vector icon. Download this PPT design now to present a convincing pitch that not only emphasizes the topic but also showcases your presentation skills.
Handshake With Bar Graph Vector Icon Ppt PowerPoint Presentation File Clipart PDF
Persuade your audience using this handshake with bar graph vector icon ppt powerpoint presentation file clipart pdf. This PPT design covers two stages, thus making it a great tool to use. It also caters to a variety of topics including handshake with bar graph vector icon. Download this PPT design now to present a convincing pitch that not only emphasizes the topic but also showcases your presentation skills.
Three Bars With Stars For Product Ranking Vector Icon Ppt PowerPoint Presentation Gallery Guide PDF
Presenting three bars with stars for product ranking vector icon ppt powerpoint presentation gallery guide pdf to dispense important information. This template comprises three stages. It also presents valuable insights into the topics including three bars with stars for product ranking vector icon. This is a completely customizable PowerPoint theme that can be put to use immediately. So, download it and address the topic impactfully.
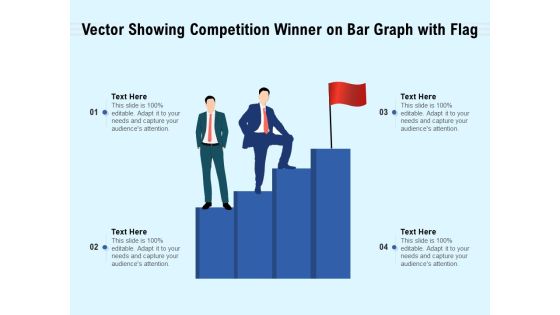
Vector Showing Competition Winner On Bar Graph With Flag Ppt PowerPoint Presentation File Sample PDF
Presenting vector showing competition winner on bar graph with flag ppt powerpoint presentation file sample pdf to dispense important information. This template comprises four stages. It also presents valuable insights into the topics including vector showing competition winner on bar graph with flag. This is a completely customizable PowerPoint theme that can be put to use immediately. So, download it and address the topic impactfully.

Bar Chart With Business Man For Career Growth Vector Icon Ppt PowerPoint Presentation Layouts Samples PDF
Persuade your audience using this bar chart with business man for career growth vector icon ppt powerpoint presentation layouts samples pdf. This PPT design covers one stages, thus making it a great tool to use. It also caters to a variety of topics including bar chart with business man for career growth vector icon. Download this PPT design now to present a convincing pitch that not only emphasizes the topic but also showcases your presentation skills.

Business Financial Growth Bar Graph With Dollar Symbol Icon Ppt PowerPoint Presentation File Ideas PDF
Persuade your audience using this business financial growth bar graph with dollar symbol icon ppt powerpoint presentation file ideas pdf. This PPT design covers one stages, thus making it a great tool to use. It also caters to a variety of topics including business financial growth bar graph with dollar symbol icon. Download this PPT design now to present a convincing pitch that not only emphasizes the topic but also showcases your presentation skills.
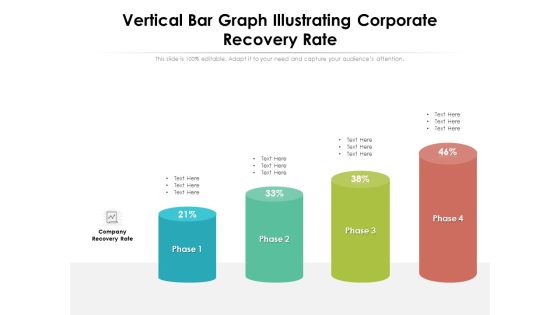
Vertical Bar Graph Illustrating Corporate Recovery Rate Ppt PowerPoint Presentation File Design Inspiration PDF
Persuade your audience using this vertical bar graph illustrating corporate recovery rate ppt powerpoint presentation file design inspiration pdf. This PPT design covers four stages, thus making it a great tool to use. It also caters to a variety of topics including vertical bar graph illustrating corporate recovery rate. Download this PPT design now to present a convincing pitch that not only emphasizes the topic but also showcases your presentation skills.
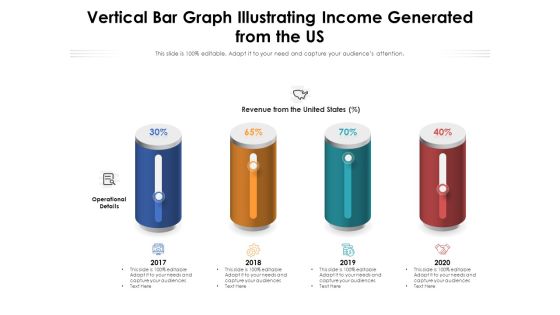
Vertical Bar Graph Illustrating Income Generated From The US Ppt PowerPoint Presentation Gallery Structure PDF
Persuade your audience using this vertical bar graph illustrating income generated from the us ppt powerpoint presentation gallery structure pdf. This PPT design covers four stages, thus making it a great tool to use. It also caters to a variety of topics including vertical bar graph illustrating income generated from the us. Download this PPT design now to present a convincing pitch that not only emphasizes the topic but also showcases your presentation skills.
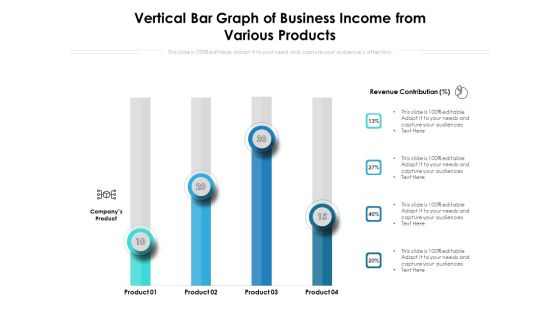
Vertical Bar Graph Of Business Income From Various Products Ppt PowerPoint Presentation File Introduction PDF
Persuade your audience using this vertical bar graph of business income from various products ppt powerpoint presentation file introduction pdf. This PPT design covers four stages, thus making it a great tool to use. It also caters to a variety of topics including vertical bar graph of business income from various products. Download this PPT design now to present a convincing pitch that not only emphasizes the topic but also showcases your presentation skills.
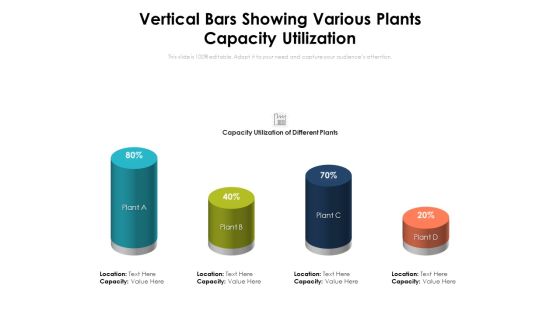
Vertical Bars Showing Various Plants Capacity Utilization Ppt PowerPoint Presentation Gallery Templates PDF
Persuade your audience using this vertical bars showing various plants capacity utilization ppt powerpoint presentation gallery templates pdf. This PPT design covers four stages, thus making it a great tool to use. It also caters to a variety of topics including vertical bars showing various plants capacity utilization. Download this PPT design now to present a convincing pitch that not only emphasizes the topic but also showcases your presentation skills.
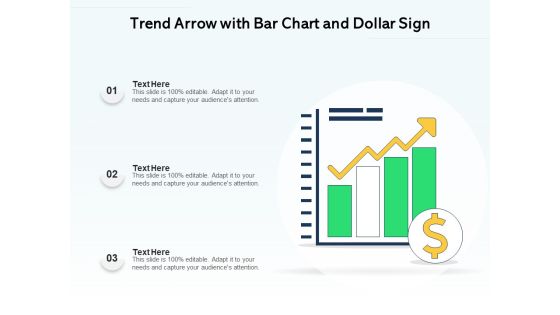
Trend Arrow With Bar Chart And Dollar Sign Ppt PowerPoint Presentation Influencers PDF
Persuade your audience using this trend arrow with bar chart and dollar sign ppt powerpoint presentation influencers pdf. This PPT design covers three stages, thus making it a great tool to use. It also caters to a variety of topics including trend arrow with bar chart and dollar sign. Download this PPT design now to present a convincing pitch that not only emphasizes the topic but also showcases your presentation skills.
Progress Bar On Computer Monitor Vector Icon Ppt PowerPoint Presentation Pictures Design Inspiration PDF
Persuade your audience using this progress bar on computer monitor vector icon ppt powerpoint presentation pictures design inspiration pdf. This PPT design covers three stages, thus making it a great tool to use. It also caters to a variety of topics including progress bar on computer monitor vector icon. Download this PPT design now to present a convincing pitch that not only emphasizes the topic but also showcases your presentation skills.
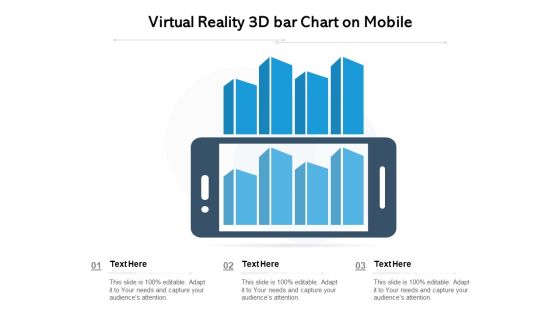
Virtual Reality 3D Bar Chart On Mobile Ppt PowerPoint Presentation Outline Rules PDF
Persuade your audience using this virtual reality 3d bar chart on mobile ppt powerpoint presentation outline rules pdf. This PPT design covers three stages, thus making it a great tool to use. It also caters to a variety of topics including virtual reality 3d bar chart on mobile. Download this PPT design now to present a convincing pitch that not only emphasizes the topic but also showcases your presentation skills.

Bar Chart With Magnifying Glass For Product Performance Analysis Ppt PowerPoint Presentation Gallery Example File PDF
Presenting bar chart with magnifying glass for product performance analysis ppt powerpoint presentation gallery example file pdf to dispense important information. This template comprises three stages. It also presents valuable insights into the topics including bar chart with magnifying glass for product performance analysis. This is a completely customizable PowerPoint theme that can be put to use immediately. So, download it and address the topic impactfully.

Bar Graph Showing Increase In Business Profit Ppt PowerPoint Presentation Infographic Template Show PDF
Persuade your audience using this bar graph showing increase in business profit ppt powerpoint presentation infographic template show pdf. This PPT design covers two stages, thus making it a great tool to use. It also caters to a variety of topics including bar graph showing increase in business profit. Download this PPT design now to present a convincing pitch that not only emphasizes the topic but also showcases your presentation skills.

Bar Graph With Arrows For Data Representation Vector Icon Ppt PowerPoint Presentation Summary Picture PDF
Presenting bar graph with arrows for data representation vector icon ppt powerpoint presentation summary picture pdf to dispense important information. This template comprises three stages. It also presents valuable insights into the topics including bar graph with arrows for data representation vector icon. This is a completely customizable PowerPoint theme that can be put to use immediately. So, download it and address the topic impactfully.

Vector Showing Statistics Comparison Bar Chart Ppt Visual Aids Styles PDF
Persuade your audience using this Vector Showing Statistics Comparison Bar Chart Ppt Visual Aids Styles PDF. This PPT design covers three stages, thus making it a great tool to use. It also caters to a variety of topics including vector showing statistics comparison bar chart. Download this PPT design now to present a convincing pitch that not only emphasizes the topic but also showcases your presentation skills.

Business Goal With Bar Graph Vector Icon Ppt Inspiration Rules PDF
Persuade your audience using this business goal with bar graph vector icon ppt inspiration rules pdf. This PPT design covers three stages, thus making it a great tool to use. It also caters to a variety of topics including business goal with bar graph vector icon. Download this PPT design now to present a convincing pitch that not only emphasizes the topic but also showcases your presentation skills.
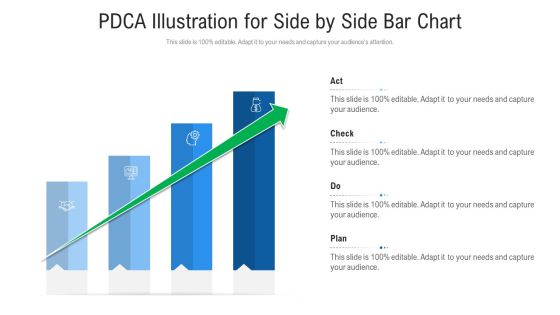
Pdca Illustration For Side By Side Bar Chart Ppt PowerPoint Presentation Gallery Maker PDF
Presenting pdca illustration for side by side bar chart ppt powerpoint presentation gallery maker pdf to provide visual cues and insights. Share and navigate important information on four stages that need your due attention. This template can be used to pitch topics like pdca illustration for side by side bar chart. In addtion, this PPT design contains high resolution images, graphics, etc, that are easily editable and available for immediate download.
 Home
Home