Brick

Stock Photo Twisted Arrows Around Bars PowerPoint Slide
This conceptual image displays graphics of bar graph. This image of bar graph can be used to show growth in sales or profit. Pass your ideas through this image slide in relation to profit growth.
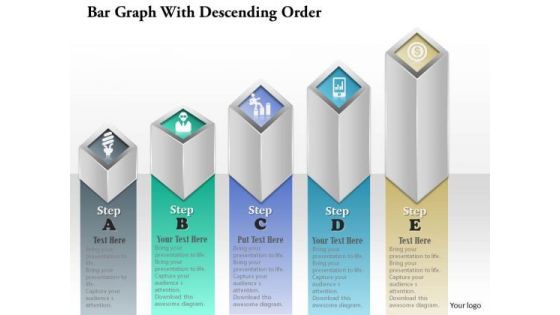
Business Diagram Bar Graph With Ascending Order Presentation Template
Our above diagram displays bar graph in ascending order. It contains bar graph with business icons. Use this amazing diagram for business communication or to present business reports. Download this diagram as a tool for business presentations.
Five Options Bar Graph With Icons Powerpoint Template
This PowerPoint slide has been designed with five options bar graph and icons. This slide of bar graph is suitable for statistical analysis. This professional slide helps in making an instant impact on viewers.

Profit Growth Bar Graph Over The Years Powerpoint Slide Graphics
This is a profit growth bar graph over the years powerpoint slide graphics. This is a four stage process. The stages in this process are bar graph, arrows, years, business, growth, marketing.

Revenue Growth For Bar Graph Ppt Examples Slides
This is a revenue growth for bar graph ppt examples slides. This is a five stage process. The stages in this process are bar graph, years, business, growth, marketing.

Money Raised With Growth Bar Chart Powerpoint Shapes
This is a money raised with growth bar chart powerpoint shapes. This is a nine stage process. The stages in this process are bar chart, growth, business, success, management.

Annual Hiring Plan Bar Chart Example Of Ppt
This is a annual hiring plan bar chart example of ppt. This is a five stage process. The stages in this process are bar graph, business, marketing, growth, success.

Bar Graph With Total Profit Analysis Ppt Images
This is a bar graph with total profit analysis ppt images. This is a nine stage process. The stages in this process are bar graph, business, marketing, growth, success.
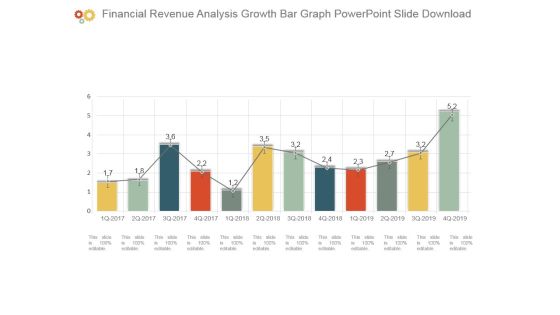
Financial Revenue Analysis Growth Bar Graph Powerpoint Slide Download
This is a financial revenue analysis growth bar graph powerpoint slide download. This is a twelve stage process. The stages in this process are bar graph, business, marketing, growth, success.

Gross Margin Analysis Bar Chart Powerpoint Slide Backgrounds
This is a gross margin analysis bar chart powerpoint slide backgrounds. This is a two stage process. The stages in this process are bar graph, business, marketing, growth, success.
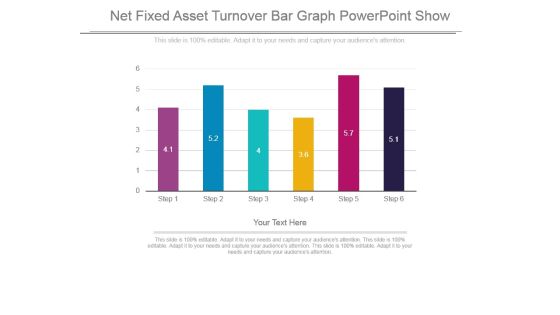
Net Fixed Asset Turnover Bar Graph Powerpoint Show
This is a net fixed asset turnover bar graph powerpoint show. This is a six stage process. The stages in this process are bar graph, presentation, strategy, business, management.

Dividend Per Share Bar Chart Powerpoint Slide Background Designs
This is a dividend per share bar chart powerpoint slide background designs. This is a five stage process. The stages in this process are business, marketing, success, growth, bar graph.
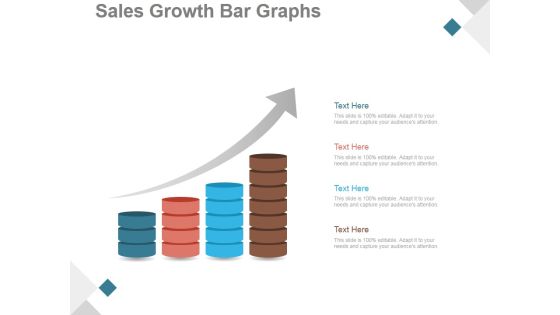
Sales Growth Bar Graphs Ppt PowerPoint Presentation Images
This is a sales growth bar graphs ppt powerpoint presentation images. This is a four stage process. The stages in this process are business, strategy, marketing, growth, bar graph, sales management.

Bar Graph For Analyzing Corporate Growth Ppt PowerPoint Presentation Ideas
This is a bar graph for analyzing corporate growth ppt powerpoint presentation ideas. This is a five stage process. The stages in this process are bar graph, analyzing, corporate, growth, presentation, strategy.

Bar Graph Template 1 Ppt PowerPoint Presentation Deck
This is a bar graph template 1 ppt powerpoint presentation deck. This is a five stage process. The stages in this process are bar graph, business, marketing, success, management.
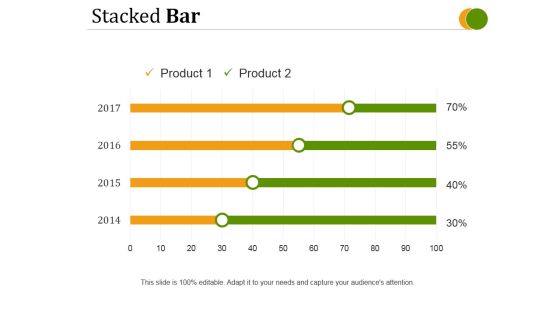
Stacked Bar Template 1 Ppt PowerPoint Presentation Examples
This is a stacked bar template 1 ppt powerpoint presentation examples. This is a four stage process. The stages in this process are stacked bar, business, management, marketing, strategy.
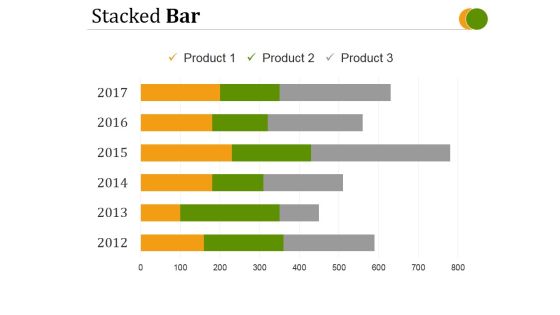
Stacked Bar Template 3 Ppt PowerPoint Presentation Design Ideas
This is a stacked bar template 3 ppt powerpoint presentation design ideas. This is a six stage process. The stages in this process are stacked bar, business, management, marketing, strategy.

Bar Chart Template 1 Ppt PowerPoint Presentation Background Images
This is a bar chart template 1 ppt powerpoint presentation background images. This is a twelve stage process. The stages in this process are product, bar chart, dollars, year.

Bar Graph Template 2 Ppt PowerPoint Presentation Introduction
This is a bar graph template 2 ppt powerpoint presentation introduction. This is a four stage process. The stages in this process are bar graph, presentation, year, planning, marketing.

Stacked Bar Template 1 Ppt PowerPoint Presentation Infographic Template
This is a stacked bar template 1 ppt powerpoint presentation infographic template. This is a two stage process. The stages in this process are business, marketing, product, stacked bar, timeline.
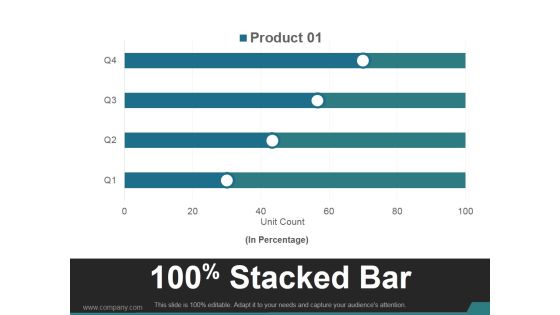
Stacked Bar Template 2 Ppt PowerPoint Presentation Visuals
This is a stacked bar template 2 ppt powerpoint presentation visuals. This is a two stage process. The stages in this process are business, marketing, product, stacked bar, management.

Bar Graph Ppt PowerPoint Presentation Gallery Example Topics
This is a bar graph ppt powerpoint presentation gallery example topics. This is a four stage process. The stages in this process are business, strategy, marketing, analysis, finance, bar graph.

Bar Graph Ppt Powerpoint Presentation Infographic Template Smartart
This is a bar graph ppt powerpoint presentation infographic template smartart. This is a four stage process. The stages in this process are bar graph, business, management, strategy, planning.

Bar Graph Ppt PowerPoint Presentation Gallery Infographic Template
This is a bar graph ppt powerpoint presentation gallery infographic template. This is a five stage process. The stages in this process are business, marketing, analysis, strategy, bar graph.

Bar Graph Ppt PowerPoint Presentation Infographic Template Pictures
This is a bar graph ppt powerpoint presentation infographic template pictures. This is a five stage process. The stages in this process are growth, bar graph, process, success, strategy.

Bar Graph Ppt PowerPoint Presentation Slides File Formats
This is a bar graph ppt powerpoint presentation slides file formats. This is a five stage process. The stages in this process are business, marketing, bar graph, timeline, analysis, planning.

Bar Graph Ppt PowerPoint Presentation Infographic Template Deck
This is a bar graph ppt powerpoint presentation infographic template deck. This is a five stage process. The stages in this process are bar chart, business, marketing, strategy, planning.

Bar Graph Ppt PowerPoint Presentation Model Graphic Tips
This is a bar graph ppt powerpoint presentation model graphic tips. This is a two stage process. The stages in this process are we are dollars in millions, financials years, bar graph, product, business.

Bar Graph Ppt PowerPoint Presentation Icon Clipart Images
This is a bar graph ppt powerpoint presentation icon clipart images. This is a three stage process. The stages in this process are bar graph, finance, marketing, strategy, analysis.

Bar Graph Ppt PowerPoint Presentation Slides Background Image
This is a bar graph ppt powerpoint presentation slides background image. This is a six stage process. The stages in this process are bar graph, finance, marketing, analysis, business.

Bar Chart Ppt PowerPoint Presentation Icon Design Templates
This is a bar chart ppt powerpoint presentation icon design templates. This is a nine stage process. The stages in this process are sales in percentage, bar graph, business, marketing, growth.

Bar Graph Ppt PowerPoint Presentation Outline File Formats
This is a bar graph ppt powerpoint presentation outline file formats. This is a nine stage process. The stages in this process are bar graph, business, management, success, strategy.

Bar Graph Ppt PowerPoint Presentation Layouts Design Templates
This is a bar graph ppt powerpoint presentation layouts design templates. This is a four stage process. The stages in this process are bar graph, planning, business, management, strategy.

Bar Chart Ppt PowerPoint Presentation Infographics Designs Download
This is a bar chart ppt powerpoint presentation infographics designs download. This is a twelve stage process. The stages in this process are bar chart, business, marketing, strategy, success.

Stacked Bar Ppt PowerPoint Presentation Layouts Graphic Tips
This is a stacked bar ppt powerpoint presentation layouts graphic tips. This is a two stage process. The stages in this process are business, strategy, analysis, pretention, stacked bar, finance.

Bar Chart Ppt PowerPoint Presentation Ideas Graphic Tips
This is a bar chart ppt powerpoint presentation ideas graphic tips. This is a seven stage process. The stages in this process are sales in percentage, bar chart, growth, business, marketing.

Bar Graph Ppt PowerPoint Presentation Infographics Slide Download
This is a bar graph ppt powerpoint presentation infographics slide download. This is a four stage process. The stages in this process are bar graph, finance, marketing, strategy, analysis.

Stacked Bar Chart Ppt PowerPoint Presentation Inspiration Ideas
This is a stacked bar chart ppt powerpoint presentation inspiration ideas. This is a four stage process. The stages in this process are product, highest, business, marketing, bar graph.
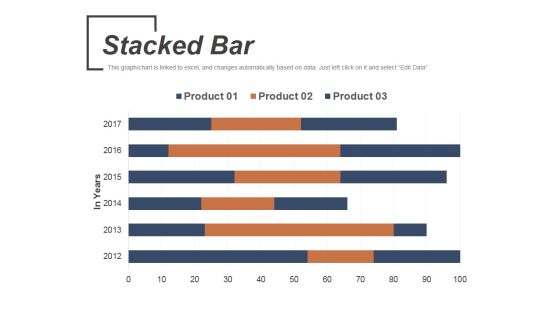
Stacked Bar Template 2 Ppt PowerPoint Presentation Slides Introduction
This is a stacked bar template 2 ppt powerpoint presentation slides introduction. This is a six stage process. The stages in this process are product, stacked bar, business, marketing, in years.

Bar Graph Ppt PowerPoint Presentation Outline Design Templates
This is a bar graph ppt powerpoint presentation outline design templates. This is a nine stage process. The stages in this process are bar graph, management, planning, strategy, marketing.

Bar Chart Ppt PowerPoint Presentation Slides Design Ideas
This is a bar chart ppt powerpoint presentation slides design ideas. This is a six stage process. The stages in this process are product, bar chart, sales in percentage.

Clustered Bar Ppt PowerPoint Presentation Summary Design Inspiration
This is a clustered bar ppt powerpoint presentation summary design inspiration. This is a two stage process. The stages in this process are product, clustered bar, profit, business, marketing.
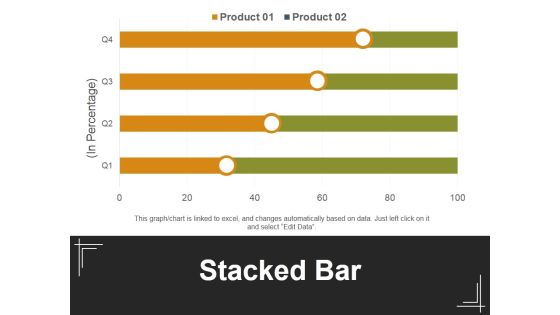
Stacked Bar Template 1 Ppt PowerPoint Presentation Inspiration Background Designs
This is a stacked bar template 1 ppt powerpoint presentation inspiration background designs. This is a four stage process. The stages in this process are in percentage, stacked bar, product, business, marketing.
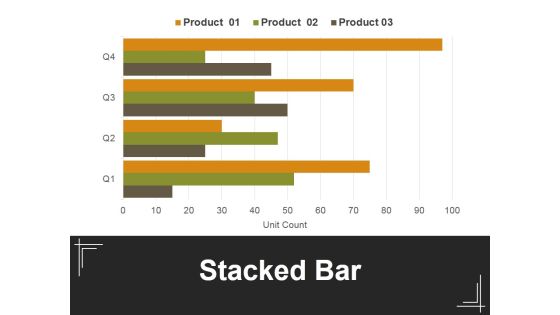
Stacked Bar Template 2 Ppt PowerPoint Presentation Professional Example
This is a stacked bar template 2 ppt powerpoint presentation professional example. This is a four stage process. The stages in this process are in percentage, stacked bar, product, business, marketing.

Bar Graph Ppt PowerPoint Presentation Infographic Template Template
This is a bar graph ppt powerpoint presentation infographic template template. This is a three stage process. The stages in this process are bar graph, sales in percentage, product, planning, business.

Bar Chart Ppt PowerPoint Presentation Infographic Template Brochure
This is a bar chart ppt powerpoint presentation infographic template brochure. This is a seven stage process. The stages in this process are bar graph, finance, marketing, strategy, analysis, business.

Bar Graph Ppt PowerPoint Presentation Slides Visual Aids
This is a bar graph ppt powerpoint presentation slides visual aids. This is a three stage process. The stages in this process are sales in percentage, bar graph, business, marketing, success.

Bar Graph Ppt PowerPoint Presentation Pictures Slide Portrait
This is a bar graph ppt powerpoint presentation pictures slide portrait. This is a four stage process. The stages in this process are bar graph, growth, success, business, marketing.

Bar Graph Ppt PowerPoint Presentation Infographic Template Graphics
This is a bar graph ppt powerpoint presentation infographic template graphics. This is a five stage process. The stages in this process are bar graph, finance, marketing, strategy, analysis, business.

Clustered Bar Graph Ppt PowerPoint Presentation Gallery Graphics Example
This is a clustered bar graph ppt powerpoint presentation gallery graphics example. This is a three stage process. The stages in this process are clustered bar graph, finance, marketing, strategy, business.

Bar Graph Ppt PowerPoint Presentation Inspiration Format Ideas
This is a bar graph ppt powerpoint presentation inspiration format ideas. This is a four stage process. The stages in this process are bar graph, growth, success, business, marketing.

Bar Graph Ppt PowerPoint Presentation File Graphic Tips
This is a bar graph ppt powerpoint presentation file graphic tips. This is a two stage process. The stages in this process are bar graph, finance, marketing, strategy, sales, business.

Bar Graph Ppt PowerPoint Presentation Gallery Example File
This is a bar graph ppt powerpoint presentation gallery example file. This is a two stage process. The stages in this process are column, bar graph, business, marketing, management.

Bar Graph Ppt PowerPoint Presentation Ideas Graphic Tips
This is a bar graph ppt powerpoint presentation ideas graphic tips. This is a three stage process. The stages in this process are financial year, sales in percentage, product, bar graph, growth.

Bar Graph Ppt PowerPoint Presentation Model Graphics Design
This is a bar graph ppt powerpoint presentation model graphics design. This is a four stage process. The stages in this process are bar graph, growth, success, business, marketing.

Bar Graph Template 1 Ppt PowerPoint Presentation Slides Format Ideas
This is a bar graph template 1 ppt powerpoint presentation slides format ideas. This is a three stage process. The stages in this process are product, years, bar graph, business, marketing.

Bar Graph Ppt PowerPoint Presentation Infographics Graphics Design
This is a bar graph ppt powerpoint presentation infographics graphics design. This is a five stage process. The stages in this process are bar graph, business, years, marketing, management.

Stacked Bar Ppt PowerPoint Presentation Infographic Template Infographic Template
This is a stacked bar ppt powerpoint presentation infographic template infographic template. This is a four stage process. The stages in this process are business, marketing, finance, slide bar, graph.
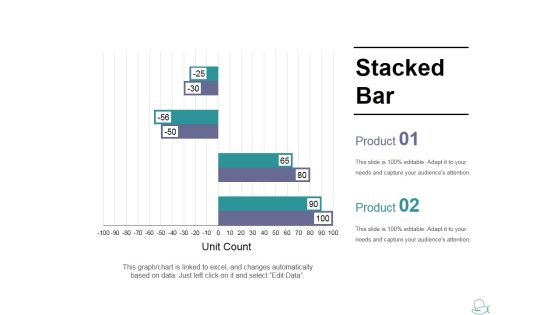
Stacked Bar Ppt PowerPoint Presentation Infographic Template Graphics Download
This is a stacked bar ppt powerpoint presentation infographic template graphics download. This is a two stage process. The stages in this process are product, stacked bar, business, unit count, marketing.

Bar Diagram Ppt PowerPoint Presentation Pictures Background Image
This is a bar diagram ppt powerpoint presentation pictures background image. This is a three stage process. The stages in this process are financial in years, sales in percentage, bar graph, growth, success.

 Home
Home