Brand Plan
Stacked Bar Ppt PowerPoint Presentation Icon Background Image
This is a stacked bar ppt powerpoint presentation icon background image. This is a four stage process. The stages in this process are product, percentage, finance, business, marketing.

Stacked Line Ppt PowerPoint Presentation Portfolio Deck
This is a stacked line ppt powerpoint presentation portfolio deck. This is a three stage process. The stages in this process are in percentage, product, business, marketing, finance.

Clustered Bar Ppt PowerPoint Presentation File Maker
This is a clustered bar ppt powerpoint presentation file maker. This is a five stage process. The stages in this process are product, business, marketing, graph, finance.
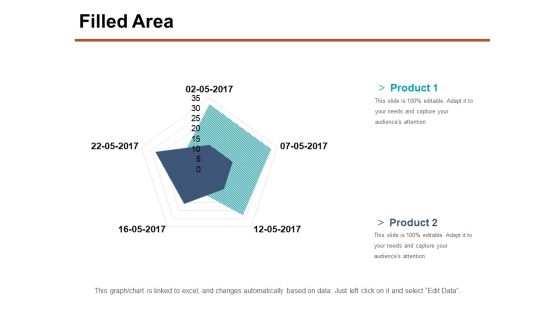
Filled Area Ppt PowerPoint Presentation File Inspiration
This is a filled area ppt powerpoint presentation file inspiration. This is a two stage process. The stages in this process are product, finance, marketing, graph, business.
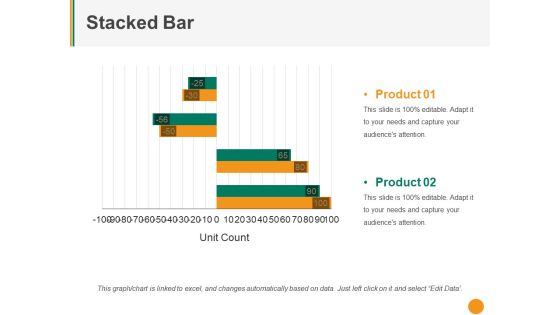
Stacked Bar Ppt PowerPoint Presentation Templates
This is a stacked bar ppt powerpoint presentation templates. This is a two stage process. The stages in this process are product, unit count, graph, business, marketing.

Bar Diagram Ppt PowerPoint Presentation File Graphics
This is a bar diagram ppt powerpoint presentation file graphics. This is a five stage process. The stages in this process are bar diagram, business, years, marketing, management.
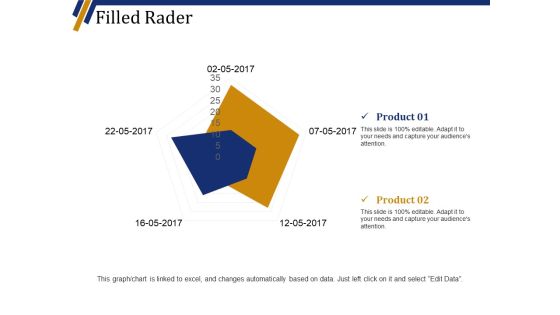
Filled Rader Ppt PowerPoint Presentation Show Brochure
This is a filled rader ppt powerpoint presentation show brochure. This is a two stage process. The stages in this process are product, finance, marketing, graph, business.

Clustered Bar Ppt PowerPoint Presentation Background Designs
This is a clustered bar ppt powerpoint presentation background designs. This is a four stage process. The stages in this process are unit count, business, marketing, graph, finance.

Stacked Bar Ppt PowerPoint Presentation Layouts Inspiration
This is a stacked bar ppt powerpoint presentation layouts inspiration. This is a four stage process. The stages in this process are finance, business, marketing, percentage, graph.

Clustered Column Ppt PowerPoint Presentation File Guidelines
This is a clustered column ppt powerpoint presentation file guidelines. This is a two stage process. The stages in this process are profit, business, marketing, graph, finance.

Clustered Column Ppt PowerPoint Presentation Pictures Objects
This is a clustered column ppt powerpoint presentation pictures objects. This is a two stage process. The stages in this process are profit, business, marketing, finance graph.
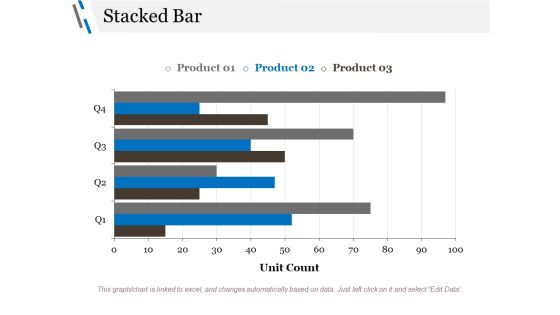
Stacked Bar Ppt PowerPoint Presentation File Backgrounds
This is a stacked bar ppt powerpoint presentation file backgrounds. This is a three stage process. The stages in this process are unit count, finance, business, marketing, graph.

Clustered Bar Ppt PowerPoint Presentation Layouts Layout
This is a clustered bar ppt powerpoint presentation layouts layout. This is a two stage process. The stages in this process are profit, graph, business, marketing, finance.

Channel KPIS Ppt PowerPoint Presentation Ideas Topics
This is a channel kpis ppt powerpoint presentation ideas topics. This is a four stage process. The stages in this process are years, business, marketing, finance, graph.

Competitor Analysis Ppt PowerPoint Presentation Infographic Template Elements
This is a competitor analysis ppt powerpoint presentation infographic template elements. This is a four stage process. The stages in this process are revenue, sales, business, marketing, finance.

Stacked Column Ppt PowerPoint Presentation Gallery Gridlines
This is a stacked column ppt powerpoint presentation gallery gridlines. This is a two stage process. The stages in this process are stacked column, finance, marketing, analysis, business.

Bar Graph Ppt PowerPoint Presentation Styles Show
This is a bar graph ppt powerpoint presentation styles show. This is a one stage process. The stages in this process are bar graph, finance, marketing, investment, business.

Stacked Bar Ppt PowerPoint Presentation Professional Guidelines
This is a stacked bar ppt powerpoint presentation professional guidelines. This is a two stage process. The stages in this process are stacked bar, finance, analysis, business, marketing.

Bar Graph Ppt PowerPoint Presentation Model Vector
This is a bar graph ppt powerpoint presentation model vector. This is a two stage process. The stages in this process are graph, financial, year, business, marketing.

Filled Area Ppt PowerPoint Presentation Layouts Templates
This is a filled area ppt powerpoint presentation layouts templates. This is a two stage process. The stages in this process are filled area, finance, analysis, business, marketing.

Clustered Bar Ppt PowerPoint Presentation Icon Images
This is a clustered bar ppt powerpoint presentation icon images. This is a three stage process. The stages in this process are unit count, finance, marketing, graph, business.

Stacked Bar Ppt PowerPoint Presentation Infographics Clipart
This is a stacked bar ppt powerpoint presentation infographics clipart. This is a two stage process. The stages in this process are finance, marketing, business, unit count, graph.

Stacked Bar Ppt PowerPoint Presentation Ideas Inspiration
This is a stacked bar ppt powerpoint presentation ideas inspiration. This is a two stage process. The stages in this process are stacked bar, finance, marketing, analysis, business.
Financial Ppt PowerPoint Presentation Model Icons
This is a financial ppt powerpoint presentation model icons. This is a three stage process. The stages in this process are dollar, business, finance, marketing, management.

Competitors Average Price Product Ppt PowerPoint Presentation Summary Display
This is a competitors average price product ppt powerpoint presentation summary display. This is a five stage process. The stages in this process are business, marketing, graph, finance.

Clustered Bar Ppt PowerPoint Presentation Icon Background
This is a clustered bar ppt powerpoint presentation icon background. This is a three stage process. The stages in this process are business, unit count, marketing, graph, finance.

Clustered Column Ppt PowerPoint Presentation Styles Diagrams
This is a clustered column ppt powerpoint presentation styles diagrams. This is a two stage process. The stages in this process are business, marketing, graph, finance, clustered column.

Traction Ppt PowerPoint Presentation Infographic Template Background Designs
This is a traction ppt powerpoint presentation infographic template background designs. This is a six stage process. The stages in this process are business, icons, traction, marketing, finance.
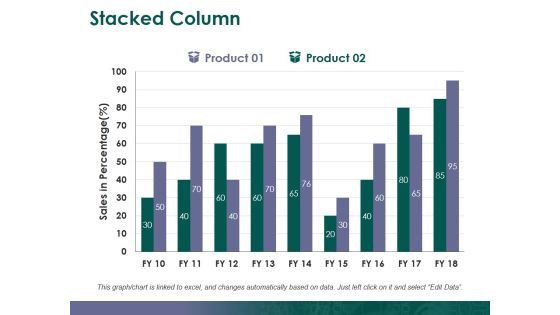
Stacked Column Ppt PowerPoint Presentation Gallery Graphics
This is a stacked column ppt powerpoint presentation gallery graphics. This is a two stage process. The stages in this process are stacked column, finance, analysis, business, marketing.

Stacked Bar Ppt PowerPoint Presentation Gallery Summary
This is a stacked bar ppt powerpoint presentation gallery summary. This is a two stage process. The stages in this process are business, marketing, graph, unit count, finance.

Data Collection Histograms Ppt PowerPoint Presentation Show Topics
This is a data collection histograms ppt powerpoint presentation show topics. This is a seven stage process. The stages in this process are business, marketing, histogram, finance, graph.

Balance Sheet Kpis Ppt PowerPoint Presentation File Picture
This is a balance sheet kpis ppt powerpoint presentation file picture. This is a four stage process. The stages in this process are business, marketing, finance, graph, cagr.

Competitive Analysis Ppt PowerPoint Presentation Summary Picture
This is a competitive analysis ppt powerpoint presentation summary picture. This is a one stage process. The stages in this process are business, marketing, competitive analysis, finance, graph.

Demand Statistics Ppt PowerPoint Presentation Pictures Format Ideas
This is a demand statistics ppt powerpoint presentation pictures format ideas. This is a four stage process. The stages in this process are business, marketing, finance, graph, years.

Financial Ppt PowerPoint Presentation Layouts Example
This is a financial ppt powerpoint presentation layouts example. This is a three stage process. The stages in this process are business, marketing, maximum, medium, minimum, financial.

Clustered Bar Ppt PowerPoint Presentation Layouts Tips
This is a clustered bar ppt powerpoint presentation layouts tips. This is a three stage process. The stages in this process are clustered bar, finance, marketing, management, analysis.
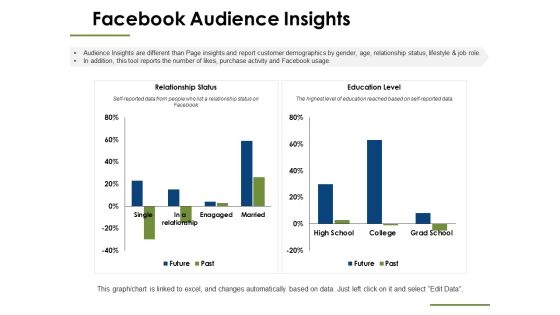
Facebook Audience Insights Ppt PowerPoint Presentation Professional Slide
This is a facebook audience insights ppt powerpoint presentation professional slide. This is a two stage process. The stages in this process are finance, business, marketing, management, investment.
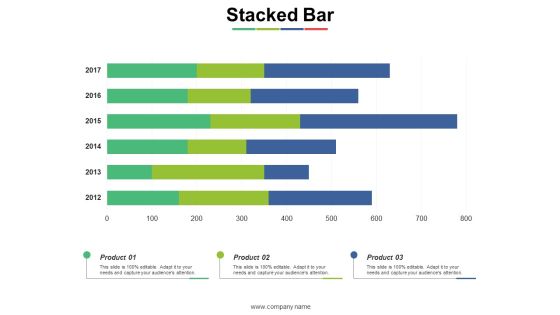
Stacked Bar Ppt PowerPoint Presentation File Guidelines
This is a stacked bar ppt powerpoint presentation file guidelines. This is a three stage process. The stages in this process are stacked bar, product, year, business, marketing.

Clustered Bar Ppt PowerPoint Presentation Inspiration Backgrounds
This is a clustered bar ppt powerpoint presentation inspiration backgrounds. This is a three stage process. The stages in this process are product, percentage, marketing, business.
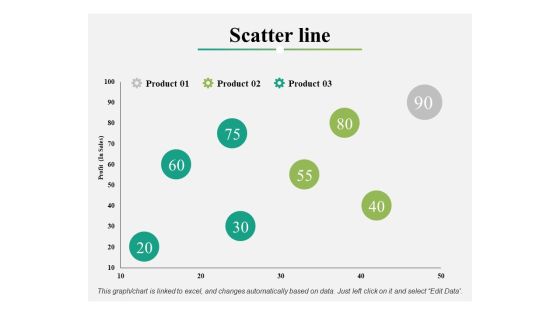
Scatter Line Ppt PowerPoint Presentation Show Designs Download
This is a scatter line ppt powerpoint presentation show designs download. This is a three stage process. The stages in this process are percentage, product, business, marketing.

Clustered Column Ppt PowerPoint Presentation Professional Slides
This is a clustered column ppt powerpoint presentation professional slides. This is a two stage process. The stages in this process are percentage, product, management, marketing.

Stacked Area Clustered Column Ppt PowerPoint Presentation Ideas Outfit
This is a stacked area clustered column ppt powerpoint presentation ideas outfit. This is a three stage process. The stages in this process are percentage, product, business, marketing.

Clustered Column Financial Ppt PowerPoint Presentation Summary Information
This is a clustered column financial ppt powerpoint presentation summary information. This is a three stage process. The stages in this process are business, management, marketing, percentage, product.

Clustered Column Product Ppt PowerPoint Presentation Show Guidelines
This is a clustered column product ppt powerpoint presentation show guidelines. This is a four stage process. The stages in this process are business, management, marketing, percentage, product.

Competitor Positioning Ppt Powerpoint Presentation Pictures Gridlines
This is a competitor positioning ppt powerpoint presentation pictures gridlines. This is a two stage process. The stages in this process are finance, marketing, management, investment, analysis.

Clustered Column Line Ppt PowerPoint Presentation Summary Guidelines
This is a clustered column line ppt powerpoint presentation summary guidelines. This is a three stage process. The stages in this process are business, management, percentage, product, marketing.

Clustered Bar Finance Ppt PowerPoint Presentation Model Grid
This is a clustered bar finance ppt powerpoint presentation model grid. This is a three stage process. The stages in this process are finance, marketing, management, investment.

Project Management Dashboard Ppt PowerPoint Presentation Slides Files
This is a project management dashboard ppt powerpoint presentation slides files. This is a four stage process. The stages in this process are finance, marketing, management, investment, product.
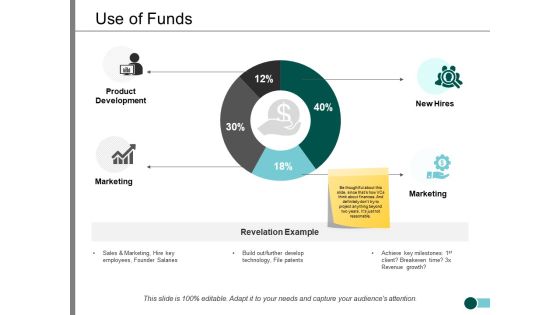
Use Of Funds Ppt PowerPoint Presentation Model Slide
This is a use of funds ppt powerpoint presentation model slide. This is a four stage process. The stages in this process are finance, marketing, management, investment, analysis.

Quality Management Dashboard Ppt PowerPoint Presentation File Diagrams
This is a quality management dashboard ppt powerpoint presentation file diagrams. This is a four stage process. The stages in this process are finance, marketing, management, investment, analysis.

Financial Growth Investment Returns PowerPoint Templates And Editable Ppt Slides
Financial Growth Investment returns PowerPoint templates and Editable PPT Slides-These high quality powerpoint pre-designed slides and powerpoint templates have been carefully created by our professional team to help you impress your audience. All slides have been created and are 100% editable in powerpoint. Each and every property of any graphic - color, size, orientation, shading, outline etc. can be modified to help you build an effective powerpoint presentation. Any text can be entered at any point in the powerpoint template or slide. Simply DOWNLOAD, TYPE and PRESENT!-These PowerPoint designs and slide layouts can be used to in presentations relating to --Abstract, arrows, background, circle, shape, reflection, glossy, shine, shiny, shadow, images, icons, business, success, concept, team, teamwork, music, symbol, photos, communication, network, people, businesspeople, computer, industry, medical, unity, flag, america, law, dollar, currency, nature, text-Financial Growth Investment returns PowerPoint templates and Editable PPT Slides

Prevention Of Information Statistics Highlighting Lack Of Cyber Security Awareness Information PDF
The purpose of this slide is to outline various statistics showing the lack of security awareness amongst the employees. The statistics covered in the slide is related to malware infection, using personal cloud server, malicious attachment etc. Do you have to make sure that everyone on your team knows about any specific topic I yes, then you should give Prevention Of Information Statistics Highlighting Lack Of Cyber Security Awareness Information PDF a try. Our experts have put a lot of knowledge and effort into creating this impeccable Prevention Of Information Statistics Highlighting Lack Of Cyber Security Awareness Information PDF. You can use this template for your upcoming presentations, as the slides are perfect to represent even the tiniest detail. You can download these templates from the Slidegeeks website and these are easy to edit. So grab these today

Enterprise Pitch Deck Our Company Traction Ppt PowerPoint Presentation File Example Topics PDF
This slide provides the glimpse about our business traction which measures how our startup business is growing in terms of customers, annual revenue, user growth, etc. Get a simple yet stunning designed Enterprise Pitch Deck Our Company Traction Ppt PowerPoint Presentation File Example Topics PDF. It is the best one to establish the tone in your meetings. It is an excellent way to make your presentations highly effective. So, download this PPT today from Slidegeeks and see the positive impacts. Our easy-to-edit Firm Pitch Deck Our Company Traction Ppt PowerPoint Presentation Icon Outline PDF can be your go-to option for all upcoming conferences and meetings. So, what are you waiting for Grab this template today.

Various Ways To Improve Mobile Website Speed Demonstration PDF
The following slide outlines different tactics which can be used to optimize site speed and reduce bounce rate. The slide also provides information about major statistics related to mobile website bounce rate. Slidegeeks is here to make your presentations a breeze with Various Ways To Improve Mobile Website Speed Demonstration PDF With our easy-to-use and customizable templates, you can focus on delivering your ideas rather than worrying about formatting. With a variety of designs to choose from, you are sure to find one that suits your needs. And with animations and unique photos, illustrations, and fonts, you can make your presentation pop. So whether you are giving a sales pitch or presenting to the board, make sure to check out Slidegeeks first

Bar Graph To Show Company Sales Budget Ppt PowerPoint Presentation Sample
This is a bar graph to show company sales budget ppt powerpoint presentation sample. This is a four stage process. The stages in this process are business, finance, growth, success, marketing, arrow.

Bar Graph Ppt PowerPoint Presentation Introduction
This is a bar graph ppt powerpoint presentation introduction. This is a eleven stage process. The stages in this process are management, marketing, business, fy, graph, sales in percentage.
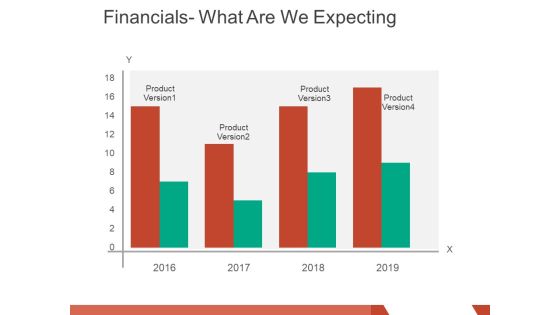
financials what are we expecting ppt powerpoint presentation layouts graphics pictures
This is a financials what are we expecting ppt powerpoint presentation layouts graphics pictures. This is a four stage process. The stages in this process are product version, business, marketing, finance, graph.
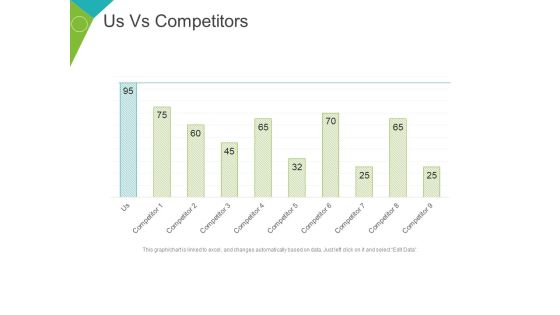
Us Vs Competitors Template 2 Ppt PowerPoint Presentation File Show
This is a us vs competitors template 2 ppt powerpoint presentation file show. This is a nine stage process. The stages in this process are competitor, graph, business, marketing, finance.

Area Stacked Ppt PowerPoint Presentation Diagram Images
This is a area stacked ppt powerpoint presentation diagram images. This is a two stage process. The stages in this process are sales in percentage, product, business, marketing, finance.

Clustered Column Line Ppt PowerPoint Presentation Infographics Templates
This is a clustered column line ppt powerpoint presentation infographics templates. This is a three stage process. The stages in this process are in percentage, business, marketing, product, finance, graph.

Clustered Column Ppt PowerPoint Presentation Slides Ideas
This is a clustered column ppt powerpoint presentation slides ideas. This is a two stage process. The stages in this process are sales in percentage, business, marketing, finance, graph.
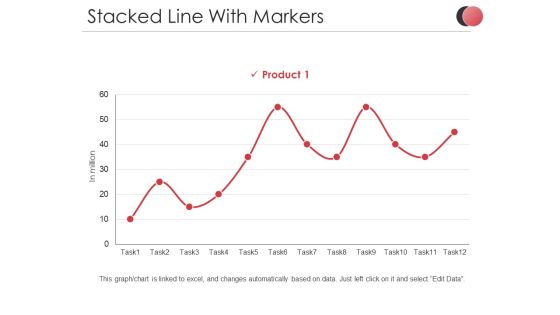
Stacked Line With Markers Ppt PowerPoint Presentation Slides Demonstration
This is a stacked line with markers ppt powerpoint presentation slides demonstration. This is a one stage process. The stages in this process are in million, product, percentage, business, marketing, finance.

Stacked Column Ppt PowerPoint Presentation Infographics Samples
This is a stacked column ppt powerpoint presentation infographics samples. This is a two stage process. The stages in this process are product, sales in percentage, business, marketing, graph.

Sales Forecasting Template 2 Ppt PowerPoint Presentation Infographic Template Examples
This is a sales forecasting template 2 ppt powerpoint presentation infographic template examples. This is a two stage process. The stages in this process are forecasting, business, marketing, finance, graph.

Bar Graph Template 2 Ppt PowerPoint Presentation Ideas Files
This is a bar graph template 2 ppt powerpoint presentation ideas files. This is a five stage process. The stages in this process are in percentage, business, marketing, finance, graph.
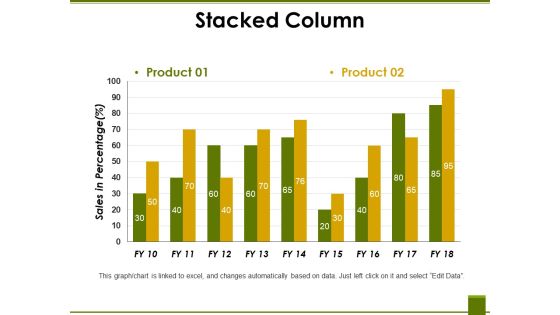
Stacked Column Ppt PowerPoint Presentation Professional Vector
This is a stacked column ppt powerpoint presentation professional vector. This is a two stage process. The stages in this process are product, sales in percentage, business, marketing, graph.

Stacked Line Ppt PowerPoint Presentation Infographic Template Graphics Template
This is a stacked line ppt powerpoint presentation infographic template graphics template. This is a three stage process. The stages in this process are product, in percentage, business, marketing, finance.

Bar Graph Ppt PowerPoint Presentation Infographics Graphics Design
This is a bar graph ppt powerpoint presentation infographics graphics design. This is a five stage process. The stages in this process are bar graph, business, years, marketing, management.

Clustered Bar Ppt PowerPoint Presentation Show Slide Portrait
This is a clustered bar ppt powerpoint presentation show slide portrait. This is a four stage process. The stages in this process are product, unit count, graph, business, marketing.

Clustered Column Ppt PowerPoint Presentation Professional Graphic Tips
This is a clustered column ppt powerpoint presentation professional graphic tips. This is a two stage process. The stages in this process are product, profit in percentage, graph, business, marketing.

Clustered Column Ppt PowerPoint Presentation Inspiration Shapes
This is a clustered column ppt powerpoint presentation inspiration shapes. This is a two stage process. The stages in this process are profit in percentage, business, marketing, graph, finance.

Stacked Area Clustered Column Ppt PowerPoint Presentation Ideas Show
This is a stacked area clustered column ppt powerpoint presentation ideas show. This is a three stage process. The stages in this process are in percentage, business, marketing, finance, graph.
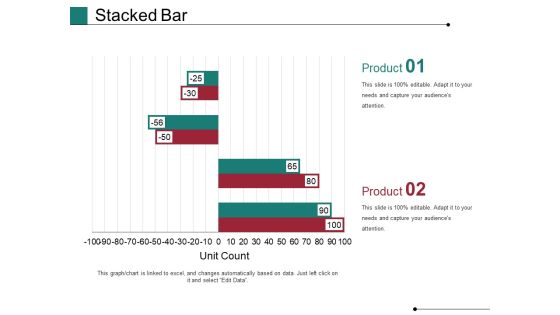
Stacked Bar Template 1 Ppt PowerPoint Presentation Show Slides
This is a stacked bar template 1 ppt powerpoint presentation show slides. This is a two stage process. The stages in this process are Unit Count, Business, Marketing, Graph, Finance.
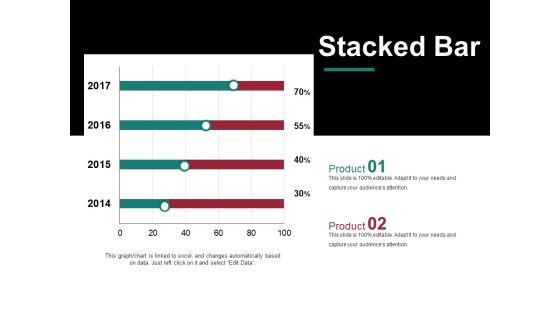
Stacked Bar Template 2 Ppt PowerPoint Presentation Model Graphic Images
This is a stacked bar template 2 ppt powerpoint presentation model graphic images. This is a two stage process. The stages in this process are business, years, marketing, percentage, finance.
Stacked Area Clustered Column Ppt PowerPoint Presentation Icon Aids
This is a stacked area clustered column ppt powerpoint presentation icon aids. This is a three stage process. The stages in this process are business, marketing, finance, bar, graph.
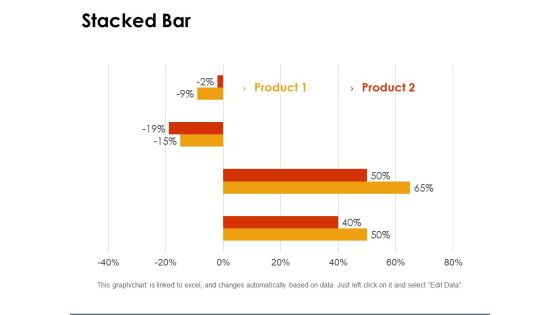
Stacked Bar Template 1 Ppt PowerPoint Presentation Gallery Clipart
This is a stacked bar template 1 ppt powerpoint presentation gallery clipart. This is a two stage process. The stages in this process are percentage, graph, business, marketing, finance.
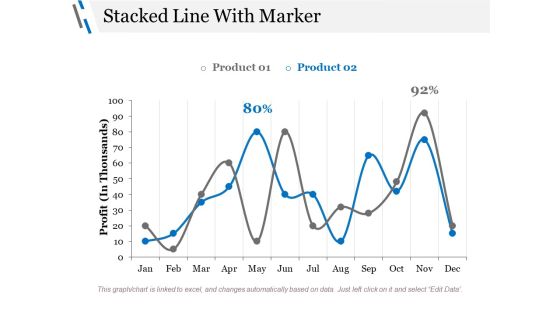
Stacked Line With Marker Ppt PowerPoint Presentation Styles Graphics Design
This is a stacked line with marker ppt powerpoint presentation styles graphics design. This is a three stage process. The stages in this process are profit, business, marketing, finance, percentage.

Stacked Bar Template Ppt PowerPoint Presentation Summary Visual Aids
This is a stacked bar template ppt powerpoint presentation summary visual aids. This is a three stage process. The stages in this process are unit count, business, marketing, finance, graph.

clustered column line ppt powerpoint presentation ideas example
This is a clustered column line ppt powerpoint presentation ideas example. This is a three stage process. The stages in this process are sales in percentage, business, marketing, finance, graph.
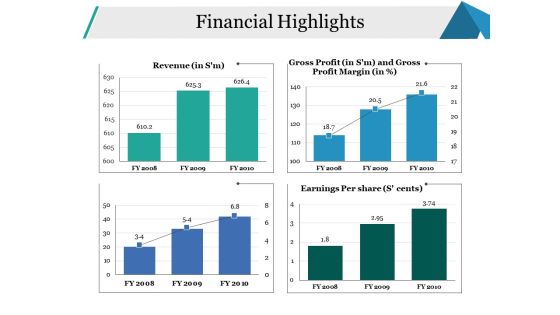
Financial Highlights Ppt PowerPoint Presentation File Background Designs
This is a financial highlights ppt powerpoint presentation file background designs. This is a four stage process. The stages in this process are revenue, earnings per share, financial, business, marketing.
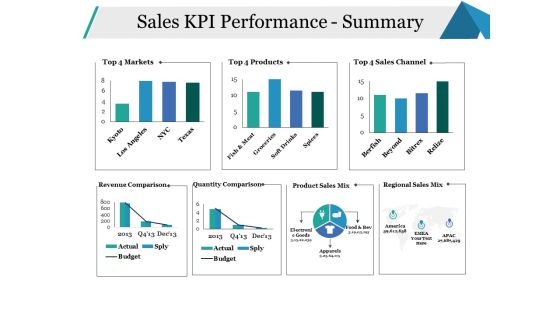
Sales KPI Performance Summary Ppt PowerPoint Presentation Infographics Model
This is a sales kpi performance summary ppt powerpoint presentation infographics model. This is a seven stage process. The stages in this process are sales channel, revenue comparison, quantity comparison, business, marketing.
Sales KPI Tracker Ppt PowerPoint Presentation Icon Themes
This is a sales kpi tracker ppt powerpoint presentation icon themes. This is a six stage process. The stages in this process are business, marketing, opportunities won, top products in revenue, leads created.

Sales Performance Of Competitors Ppt PowerPoint Presentation Portfolio Sample
This is a sales performance of competitors ppt powerpoint presentation portfolio sample. This is a three stage process. The stages in this process are business, marketing, finance, graph, years.

Clustered Column Ppt PowerPoint Presentation Show Graphics
This is a clustered column ppt powerpoint presentation show graphics. This is a two stage process. The stages in this process are financial year, sales in percentage, business, marketing, graph.

Cash Flow Statement Kpis Tabular Form Ppt PowerPoint Presentation Styles Design Inspiration
This is a cash flow statement kpis tabular form ppt powerpoint presentation styles design inspiration. This is a four stage process. The stages in this process are finance, analysis, management, business, marketing.

Clustered Bar Ppt PowerPoint Presentation Show Background Designs
This is a clustered bar ppt powerpoint presentation show background designs. This is a three stage process. The stages in this process are clustered bar, finance, analysis, business, marketing.

Capex Summary Template 1 Ppt PowerPoint Presentation Layouts Examples
This is a capex summary template 1 ppt powerpoint presentation layouts examples. This is a four stage process. The stages in this process are business, finance, marketing, analysis, investment.

Capex Summary Template 2 Ppt PowerPoint Presentation Slides Template
This is a capex summary template 2 ppt powerpoint presentation slides template. This is a four stage process. The stages in this process are business, finance, marketing, analysis, investment.

quality cost report ppt powerpoint presentation inspiration images
This is a quality cost report ppt powerpoint presentation inspiration images. This is a five stage process. The stages in this process are business, finance, marketing, analysis, quality cost.

Competitor Revenue And Profit Template 1 Ppt PowerPoint Presentation Layouts Display
This is a competitor revenue and profit template 1 ppt powerpoint presentation layouts display. This is a five stage process. The stages in this process are business, bar graph, finance, marketing, analysis.

Competitors Average Price Product Ppt PowerPoint Presentation Ideas Layouts
This is a competitors average price product ppt powerpoint presentation ideas layouts. This is a five stage process. The stages in this process are business, bar graph, finance, marketing, analysis.

Competitor Analysis Template 1 Ppt PowerPoint Presentation File Grid
This is a competitor analysis template 1 ppt powerpoint presentation file grid. This is a four stage process. The stages in this process are finance, marketing, business, graph, analysis, revenue.

Competitor Analysis Template 3 Ppt PowerPoint Presentation Inspiration Visuals
This is a competitor analysis template 3 ppt powerpoint presentation inspiration visuals. This is a four stage process. The stages in this process are business, marketing, cost of goods sold, analysis, graph.

Competitor Analysis Template 4 Ppt PowerPoint Presentation Gallery Design Templates
This is a competitor analysis template 4 ppt powerpoint presentation gallery design templates. This is a four stage process. The stages in this process are business, marketing, analysis, graph, net profit margin.

Clustered Column Line Ppt PowerPoint Presentation Infographics Background Images
This is a clustered column line ppt powerpoint presentation infographics background images. This is a three stage process. The stages in this process are clustered column line, finance, analysis, marketing, business.

Revenue Split By Quarter And Geography Ppt PowerPoint Presentation Gallery Deck
This is a revenue split by quarter and geography ppt powerpoint presentation gallery deck. This is a two stage process. The stages in this process are business, marketing, graph, revenue split by quarter, revenue split by geography.

Stacked Area Clustered Column Ppt PowerPoint Presentation Slides Information
This is a stacked area clustered column ppt powerpoint presentation slides information. This is a three stage process. The stages in this process are stacked area, clustered column, growth, finance, marketing, business.
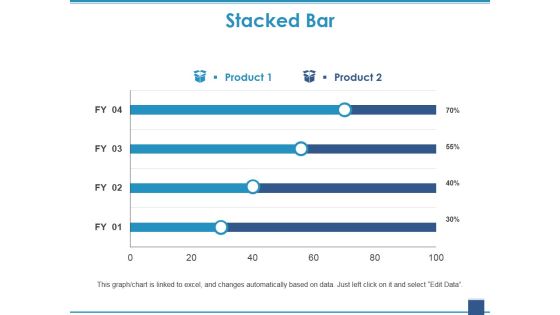
Stacked Bar Template 1 Ppt PowerPoint Presentation Gallery Deck
This is a stacked bar template 1 ppt powerpoint presentation gallery deck. This is a two stage process. The stages in this process are stacked bar, growth, finance, marketing, business.

Stacked Bar Template 2 Ppt PowerPoint Presentation Show Clipart
This is a stacked bar template 2 ppt powerpoint presentation show clipart. This is a two stage process. The stages in this process are stacked bar, growth, finance, marketing, business, investment.
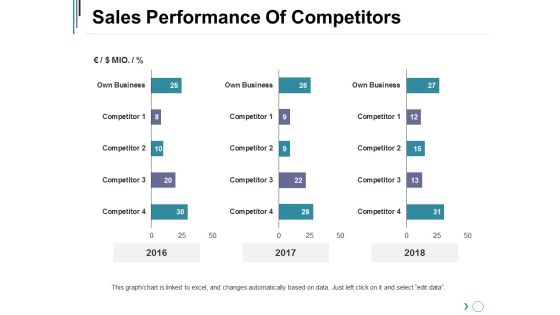
Sales Performance Of Competitors Ppt PowerPoint Presentation Inspiration Slideshow
This is a sales performance of competitors ppt powerpoint presentation inspiration slideshow. This is a three stage process. The stages in this process are business, marketing, graph, finance, years.

Competitor Revenue And Profit Ppt PowerPoint Presentation Slides Objects
This is a competitor revenue and profit ppt powerpoint presentation slides objects. This is a five stage process. The stages in this process are business, marketing, graph, finance, revenue.

Sales Performance Of Competitors Ppt PowerPoint Presentation Portfolio Templates
This is a sales performance of competitors ppt powerpoint presentation portfolio templates. This is a three stage process. The stages in this process are business, marketing, percentage, graph, finance.

Clustered Column Line Ppt PowerPoint Presentation Pictures Objects
This is a clustered column line ppt powerpoint presentation pictures objects. This is a three stage process. The stages in this process are in percentage, business, marketing, graph, finance.

Clustered Column Ppt PowerPoint Presentation Gallery Format
This is a clustered column ppt powerpoint presentation gallery format. This is a two stage process. The stages in this process are business, marketing, graph, financial year, sales in percentage.

Clustered Bar Ppt PowerPoint Presentation Portfolio Graphic Images
This is a clustered bar ppt powerpoint presentation portfolio graphic images. This is a three stage process. The stages in this process are business, unit count, finance, marketing, graph.

Cycle Time By Month Ppt PowerPoint Presentation Slides Ideas
This is a cycle time by month ppt powerpoint presentation slides ideas. This is a two stage process. The stages in this process are business, marketing, cycle time by month, finance, graph.

Liquidity Ratios Template 2 Ppt PowerPoint Presentation Ideas Microsoft
This is a liquidity ratios template 2 ppt powerpoint presentation ideas microsoft. This is a two stage process. The stages in this process are business, marketing, graph, year, current ratio, quick ratio.

Profitability Ratios Template 1 Ppt PowerPoint Presentation Ideas Master Slide
This is a profitability ratios template 1 ppt powerpoint presentation ideas master slide. This is a two stage process. The stages in this process are business, net profit ratio, gross profit ratio, marketing, graph.

Profitability Ratios Template 2 Ppt PowerPoint Presentation Show Portfolio
This is a profitability ratios template 2 ppt powerpoint presentation show portfolio. This is a two stage process. The stages in this process are business, marketing, graph, net profit ratio, gross profit ratio, year.
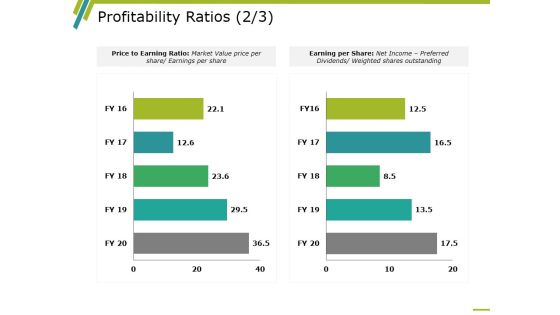
Profitability Ratios Template 3 Ppt PowerPoint Presentation Inspiration Backgrounds
This is a profitability ratios template 3 ppt powerpoint presentation inspiration backgrounds. This is a two stage process. The stages in this process are business, marketing, graph, price to earning ratio, earning per share.
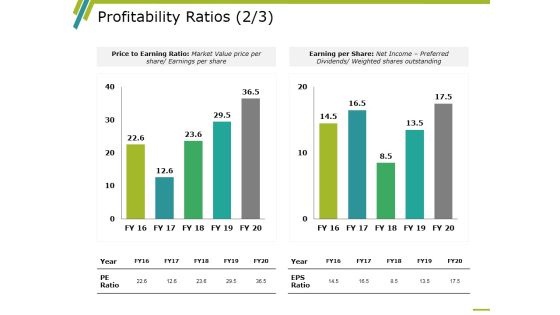
Profitability Ratios Template 4 Ppt PowerPoint Presentation Infographics Rules
This is a profitability ratios template 4 ppt powerpoint presentation infographics rules. This is a two stage process. The stages in this process are business, marketing, graph, price to earning ratio, earning per share.

Profitability Ratios Template 5 Ppt PowerPoint Presentation Infographic Template Clipart Images
This is a profitability ratios template 5 ppt powerpoint presentation infographic template clipart images. This is a two stage process. The stages in this process are business, marketing, graph, roce, roa.
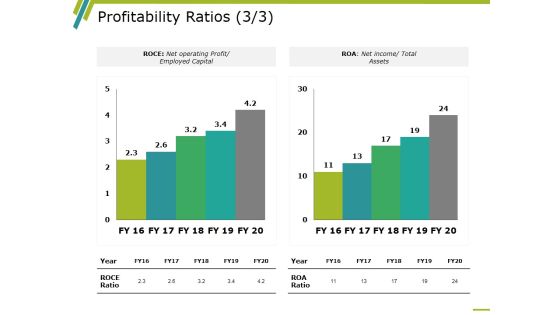
Profitability Ratios Template 6 Ppt PowerPoint Presentation Design Ideas
This is a profitability ratios template 6 ppt powerpoint presentation design ideas. This is a two stage process. The stages in this process are business, marketing, graph, roce, roa.
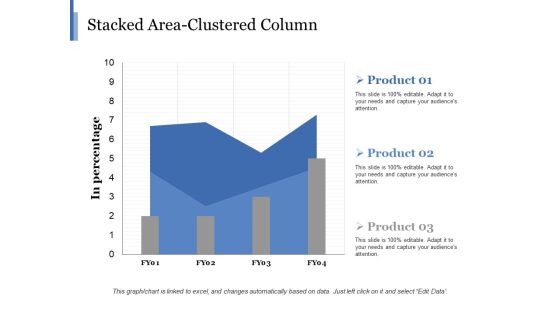
Stacked Area Clustered Column Ppt PowerPoint Presentation Show Elements
This is a stacked area clustered column ppt powerpoint presentation show elements. This is a three stage process. The stages in this process are business, in percentage, marketing, finance, graph.
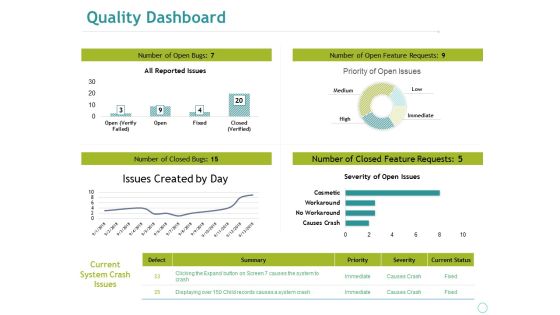
Quality Dashboard Ppt PowerPoint Presentation File Guide
This is a quality dashboard ppt powerpoint presentation file guide. This is a four stage process. The stages in this process are business, marketing, all reported issues, issues created by day, severity of open issues.

Stacked Line Ppt PowerPoint Presentation Professional Graphics Pictures
This is a stacked line ppt powerpoint presentation professional graphics pictures. This is a two stage process. The stages in this process are revenue in percentage, business, marketing, graph, finance.

Activity Ratios Ppt PowerPoint Presentation Gallery Slide Portrait
This is a activity ratios ppt powerpoint presentation gallery slide portrait. This is a two stage process. The stages in this process are business, inventory turnover, receivables turnover, marketing, finance.
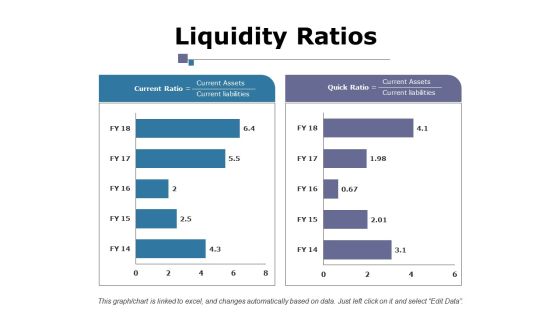
Liquidity Ratios Ppt PowerPoint Presentation Layouts Example File
This is a liquidity ratios ppt powerpoint presentation layouts example file. This is a two stage process. The stages in this process are business, current ratio, quick ratio, marketing, finance, graph.
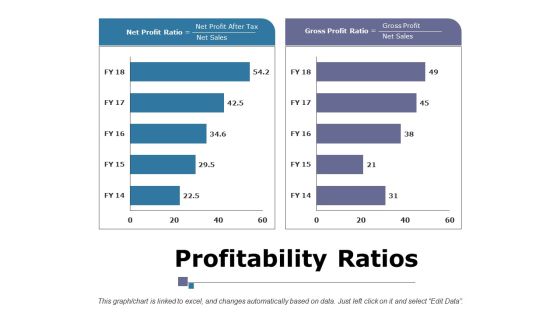
Profitability Ratios Ppt PowerPoint Presentation Infographic Template Portrait
This is a profitability ratios ppt powerpoint presentation infographic template portrait. This is a two stage process. The stages in this process are business, marketing, finance, net profit ratio, gross profit ratio.

Activity Ratios Ppt PowerPoint Presentation Summary Mockup
This is a activity ratios ppt powerpoint presentation summary mockup. This is a two stage process. The stages in this process are business, inventory turnover, receivables turnover, marketing, finance.

Liquidity Ratios Ppt PowerPoint Presentation Layouts Gridlines
This is a liquidity ratios ppt powerpoint presentation layouts gridlines. This is a two stage process. The stages in this process are business, marketing, current ratio, quick ratio, finance.
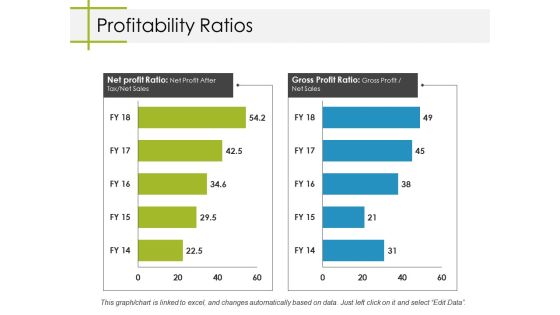
Profitability Ratios Ppt PowerPoint Presentation Inspiration Information
This is a profitability ratios ppt powerpoint presentation inspiration information. This is a two stage process. The stages in this process are business, net profit ratio, gross profit ratio, marketing, graph.
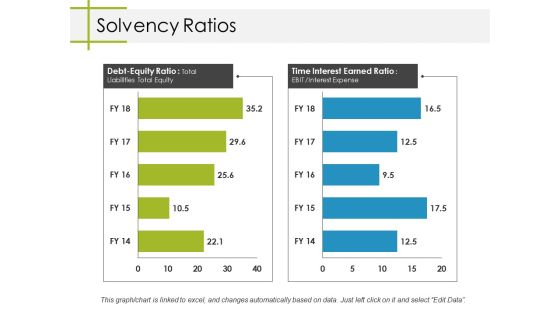
Solvency Ratios Ppt PowerPoint Presentation Professional Rules
This is a solvency ratios ppt powerpoint presentation professional rules. This is a two stage process. The stages in this process are business, marketing, debt equity ratio, time interest earned ratio, graph.

Activity Ratios Ppt PowerPoint Presentation Styles Infographic Template
This is a activity ratios ppt powerpoint presentation styles infographic template. This is a two stage process. The stages in this process are inventory turnover, receivables turnover, business, marketing, finance.
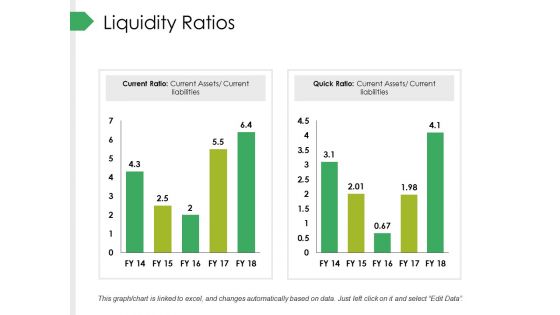
Liquidity Ratios Ppt PowerPoint Presentation Infographic Template Ideas
This is a liquidity ratios ppt powerpoint presentation infographic template ideas. This is a two stage process. The stages in this process are business, marketing, current ratio, quick ratio, finance.

Stacked Line With Markers Ppt PowerPoint Presentation Pictures Design Templates
This is a stacked line with markers ppt powerpoint presentation pictures design templates. This is a one stage process. The stages in this process are business, marketing, finance, in million, graph.

Balance Sheet Kpis Template 1 Ppt PowerPoint Presentation Show Inspiration
This is a balance sheet kpis template 1 ppt powerpoint presentation show inspiration. This is a four stage process. The stages in this process are business, marketing, graph, current liabilities, total liabilities.

Balance Sheet Kpis Template 2 Ppt PowerPoint Presentation Gallery Example
This is a balance sheet kpis template 2 ppt powerpoint presentation gallery example. This is a four stage process. The stages in this process are business, marketing, graph, current liabilities, total liabilities.
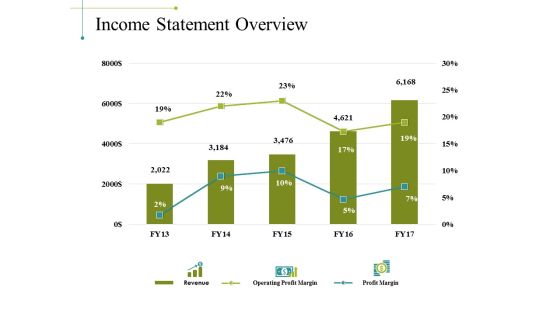
Income Statement Overview Ppt PowerPoint Presentation File Objects
This is a income statement overview ppt powerpoint presentation file objects. This is a three stage process. The stages in this process are business, market revenue, operating profit margin, profit margin.
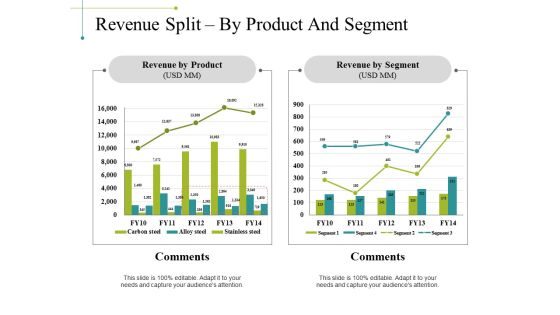
Revenue Split By Product And Segment Ppt PowerPoint Presentation Model Format Ideas
This is a revenue split by product and segment ppt powerpoint presentation model format ideas. This is a two stage process. The stages in this process are business, revenue by product, revenue by segment, comments, marketing.

Revenue Split By Quarter And Geography Ppt PowerPoint Presentation Slides Picture
This is a revenue split by quarter and geography ppt powerpoint presentation slides picture. This is a two stage process. The stages in this process are business, marketing, revenue split by quarter, revenue split by geography, comments.
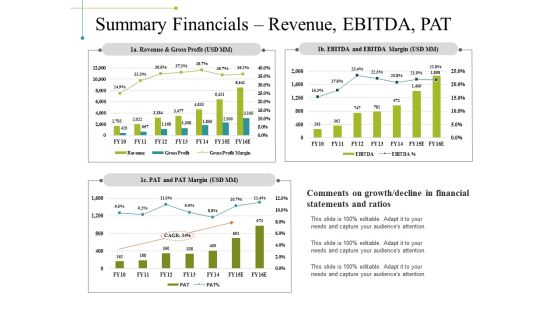
Summary Financials Revenue Ebitda Pat Ppt PowerPoint Presentation Inspiration Templates
This is a summary financials revenue ebitda pat ppt powerpoint presentation inspiration templates. This is a three stage process. The stages in this process are revenue and gross profit, pat and pat margin, ebitda and ebitda margin, business, marketing.

Summary Financials Wc Analysis Roce Roe Ppt PowerPoint Presentation Design Templates
This is a summary financials wc analysis roce roe ppt powerpoint presentation design templates. This is a two stage process. The stages in this process are business, marketing, working capital analysis, roce and roe, finance.

Bar Graph Ppt PowerPoint Presentation Summary Format
This is a bar graph ppt powerpoint presentation summary format. This is a three stage process. The stages in this process are bar graph, business, marketing, years, percentage, finance.
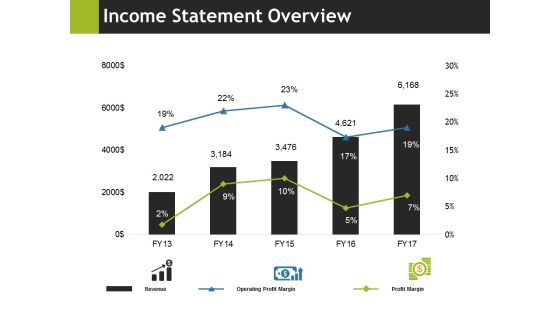
Income Statement Overview Ppt PowerPoint Presentation Professional Portfolio
This is a income statement overview ppt powerpoint presentation professional portfolio. This is a five stage process. The stages in this process are business, marketing, revenue, operating profit margin, profit margin.
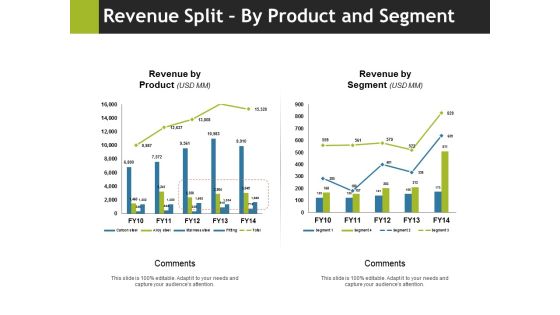
Revenue Split By Product And Segment Ppt PowerPoint Presentation Gallery Example
This is a revenue split by product and segment ppt powerpoint presentation gallery example. This is a two stage process. The stages in this process are comments, revenue by product, revenue by segment, business, marketing.
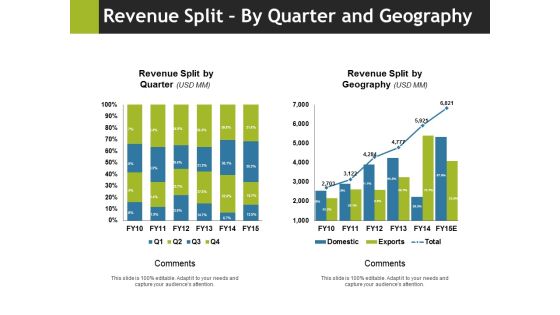
Revenue Split By Quarter And Geography Ppt PowerPoint Presentation Slides Vector
This is a revenue split by quarter and geography ppt powerpoint presentation slides vector. This is a two stage process. The stages in this process are revenue split by quarter, comments, revenue split by geography, business, marketing.

Summary Financials Wc Analysis Roce Roe Ppt PowerPoint Presentation Ideas Rules
This is a summary financials wc analysis roce roe ppt powerpoint presentation ideas rules. This is a two stage process. The stages in this process are business, marketing, working capital analysis, roce and roe, graph.

Revenue Split By Product Segment Template 2 Ppt PowerPoint Presentation Gallery Example File
This is a revenue split by product segment template 2 ppt powerpoint presentation gallery example file. This is a four stage process. The stages in this process are business, marketing, graph, finance, revenue split.

Bar Graph Ppt PowerPoint Presentation Infographics Icon
This is a bar graph ppt powerpoint presentation infographics icon. This is a two stage process. The stages in this process are business, marketing, financial year, in percentage, graph.

Bar Graph Ppt PowerPoint Presentation Layouts Influencers
This is a bar graph ppt powerpoint presentation layouts influencers. This is a two stage process. The stages in this process are business, marketing, in bar graph, sales in percentage, finance.
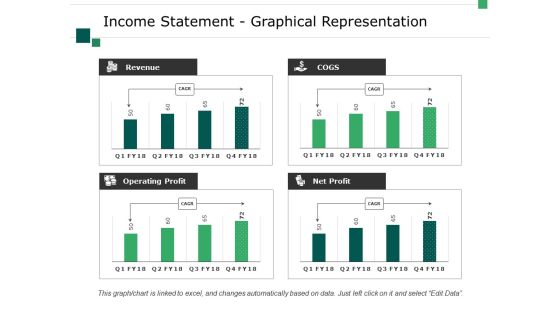
Income Statement Graphical Representation Ppt PowerPoint Presentation Visual Aids Layouts
This is a income statement graphical representation ppt powerpoint presentation visual aids layouts. This is a four stage process. The stages in this process are business, marketing, revenue, operating profit, net profit, cogs.
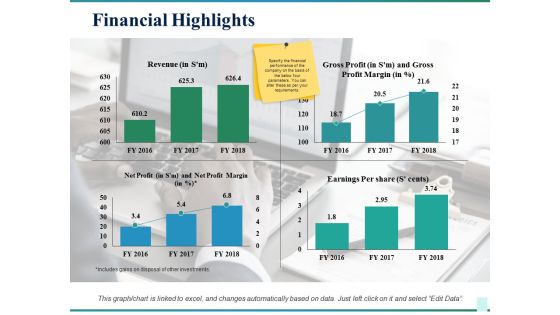
Financial Highlights Ppt PowerPoint Presentation Infographic Template Slide Download
This is a financial highlights ppt powerpoint presentation infographic template slide download. This is a four stage process. The stages in this process are business, revenue, gross profit, earnings per share, net profit, marketing.
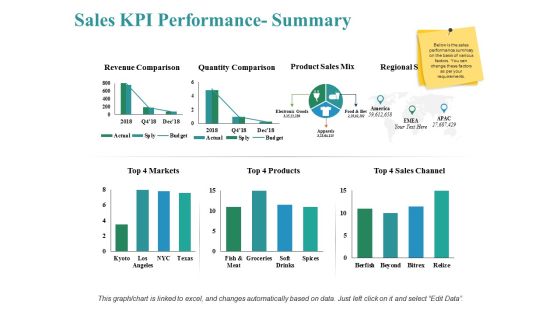
Sales Kpi Performance Summary Ppt PowerPoint Presentation Show Themes
This is a sales kpi performance summary ppt powerpoint presentation show themes. This is a three stage process. The stages in this process are revenue comparison, quantity comparison, product sales mix, markets, sales channel.

Clustered Column Line Ppt PowerPoint Presentation Model Graphics Tutorials
This is a clustered column line ppt powerpoint presentation model graphics tutorials. This is a three stage process. The stages in this process are business, marketing, in percentage, finance, graph.
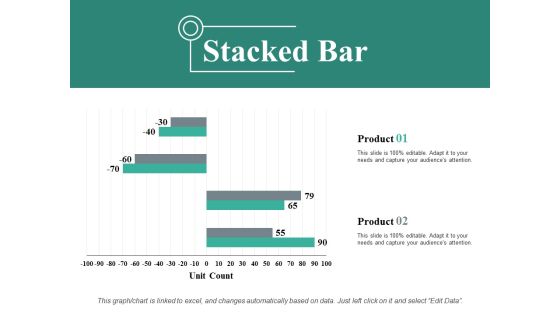
Stacked Bar Ppt PowerPoint Presentation Show Background Designs
This is a stacked bar ppt powerpoint presentation show background designs. This is a two stage process. The stages in this process are stacked bar, business, marketing, finance, unit count.

Company Sales And Performance Dashboard Ppt PowerPoint Presentation Pictures Infographic Template
This is a company sales and performance dashboard ppt powerpoint presentation pictures infographic template. This is a four stage process. The stages in this process are business, finance, analysis, management, marketing.

Clustered Bar Ppt PowerPoint Presentation Slides Example Topics
This is a clustered bar ppt powerpoint presentation slides example topics. This is a two stage process. The stages in this process are clustered bar, product, unit count, business, marketing.

Bar Graph 7 QC Tools Ppt PowerPoint Presentation Styles Structure
This is a bar graph 7 qc tools ppt powerpoint presentation styles structure. This is a three stage process. The stages in this process are bar graph, finance, marketing, analysis, investment.
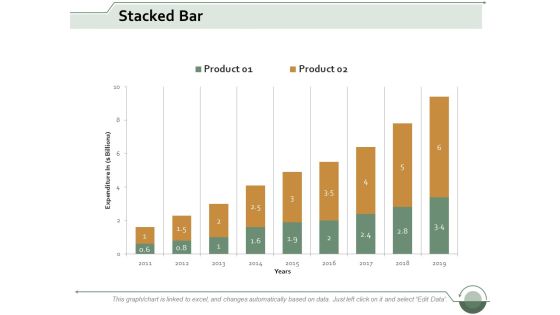
Stacked Bar Finance Ppt Powerpoint Presentation Inspiration Guide
This is a stacked bar finance ppt powerpoint presentation inspiration guide. This is a two stage process. The stages in this process are stacked bar, finance, marketing, management, analysis.
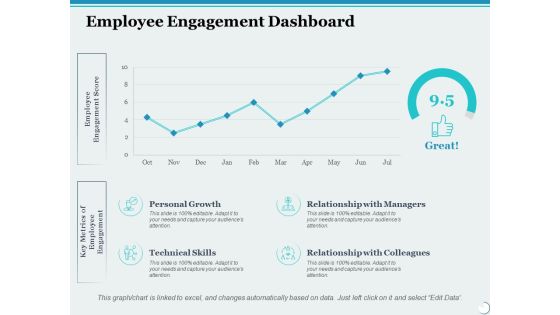
Employee Engagement Dashboard Ppt PowerPoint Presentation Inspiration Format
This is a employee engagement dashboard ppt powerpoint presentation inspiration format. This is a four stage process. The stages in this process are personal growth, relationship with managers, business, management, marketing.

Employee Weekly Efficiency Dashboard Ppt PowerPoint Presentation Infographic Template Graphic Images
This is a employee weekly efficiency dashboard ppt powerpoint presentation infographic template graphic images. This is a six stage process. The stages in this process are percentage, product, business, management, marketing.

Bar Graph Percentage Product Ppt PowerPoint Presentation Layouts Microsoft
This is a bar graph percentage product ppt powerpoint presentation layouts microsoft. This is a three stage process. The stages in this process are business, management, marketing, percentage, product.

Cost Performance Index Ppt PowerPoint Presentation Inspiration Graphics Example
This is a cost performance index ppt powerpoint presentation inspiration graphics example. This is a three stage process. The stages in this process are business, management, marketing, percentage, product.

Project Health Card Resourcing Ppt PowerPoint Presentation Summary Graphics Download
This is a project health card resourcing ppt powerpoint presentation summary graphics download. This is a six stage process. The stages in this process are business, management, marketing, percentage, product.
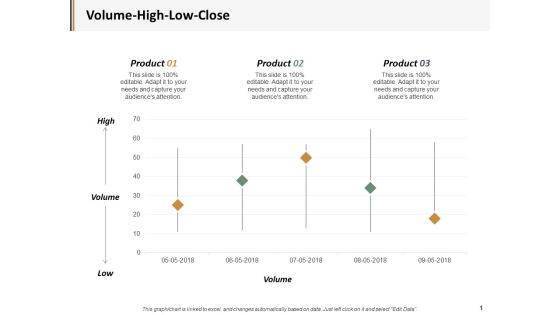
Volume High Low Close Ppt PowerPoint Presentation Ideas Example Introduction
This is a volume high low close ppt powerpoint presentation ideas example introduction. This is a three stage process. The stages in this process are business, management, marketing, percentage, product.

Clustered Bar Investment Ppt Powerpoint Presentation Gallery Clipart
This is a clustered bar investment ppt powerpoint presentation gallery clipart. This is a three stage process. The stages in this process are clustered bar, finance, marketing, management, analysis.

Stacked Area Clustered Column Ppt PowerPoint Presentation Model Slides
This is a stacked area clustered column ppt powerpoint presentation model slides. This is a three stage process. The stages in this process are business, management, percentage, product, marketing.

Cost Performance Index Ppt PowerPoint Presentation Infographics Mockup
This is a cost performance index ppt powerpoint presentation infographics mockup. This is a three stage process. The stages in this process are finance, marketing, management, investment, product, percentage.

Portfolio Management Securities Allocation Dashboard Ppt PowerPoint Presentation Professional Design Ideas
This is a portfolio management securities allocation dashboard ppt powerpoint presentation professional design ideas. This is a four stage process. The stages in this process are percentage product, business, management, marketing.

Portfolio Summary Management Dashboard Ppt PowerPoint Presentation File Design Templates
This is a portfolio summary management dashboard ppt powerpoint presentation file design templates. This is a five stage process. The stages in this process are percentage product, business, management, marketing.

Web Analytics Traffic Sources And Conversion Rate Ppt PowerPoint Presentation Picture
This is a web analytics traffic sources and conversion rate ppt powerpoint presentation picture. This is a four stage process. The stages in this process are digital analytics, digital dashboard, marketing.
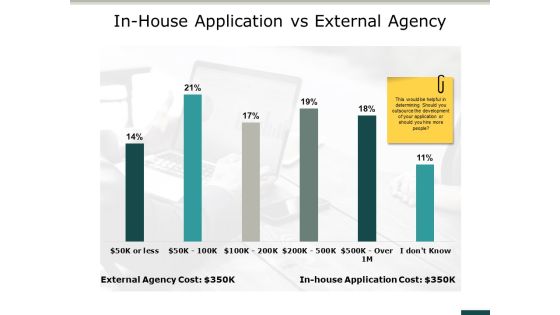
In House Application Vs External Agency Ppt PowerPoint Presentation Portfolio Images
This is a in house application vs external agency ppt powerpoint presentation portfolio images. This is a two stage process. The stages in this process are business, management, marketing, parentage, product.

Quality Control Kpi Dashboard Ppt PowerPoint Presentation Slides Topics
This is a quality control kpi dashboard ppt powerpoint presentation slides topics. This is a four stage process. The stages in this process are finance, marketing, management, investment, analysis.

Quality Control Kpi Metrics Ppt PowerPoint Presentation Slides Guidelines
This is a quality control kpi metrics ppt powerpoint presentation slides guidelines. This is a three stage process. The stages in this process are finance, marketing, management, investment, analysis.

how much money we need ppt powerpoint presentation inspiration master slide
This is a how much money we need ppt powerpoint presentation inspiration master slide. This is a two stage process. The stages in this process are how will we spend the money, how much have we raised, how much are we raising, production, marketing.

Sales Force Automation Benefits Ppt PowerPoint Presentation Infographics Samples
This is a sales force automation benefits ppt powerpoint presentation infographics samples. This is a two stage process. The stages in this process are increases deal closure by, reduces sales cycle by, cuts down the sales administrative time by, business, marketing.

Business Process Flow Diagram Examples Reppt Slides Diagrams Templates PowerPoint
We present our business process flow diagram examples reppt slides diagrams templates PowerPoint.Download our Advertising PowerPoint Templates because You have a driving passion to excel in your field. Our PowerPoint Templates and Slides will prove ideal vehicles for your ideas. Download our Arrows PowerPoint Templates because It will mark the footprints of your journey. Illustrate how they will lead you to your desired destination. Use our Shapes PowerPoint Templates because Our PowerPoint Templates and Slides will provide you a launch platform. Give a lift off to your ideas and send them into orbit. Download and present our Process and Flows PowerPoint Templates because You can Connect the dots. Fan expectations as the whole picture emerges. Use our Business PowerPoint Templates because It will let you Set new benchmarks with our PowerPoint Templates and Slides. They will keep your prospects well above par.Use these PowerPoint slides for presentations relating to Arrow, business, button, chart, circle, cycle, define, deploy, develop, diagram, eps10, flow, graphic, illustration, improvement, integrate, lifecycle, line, measure, ongoing, optimize, pattern, process, relationship, role, round, shape, text, transparency, vector, wave, wheel. The prominent colors used in the PowerPoint template are Yellow, Gray, Black. The feedback we get is that our business process flow diagram examples reppt slides diagrams templates PowerPoint are designed to make your presentations professional. The feedback we get is that our button PowerPoint templates and PPT Slides will get their audience's attention. Professionals tell us our business process flow diagram examples reppt slides diagrams templates PowerPoint are designed by professionals Professionals tell us our circle PowerPoint templates and PPT Slides will save the presenter time. Presenters tell us our business process flow diagram examples reppt slides diagrams templates PowerPoint are specially created by a professional team with vast experience. They diligently strive to come up with the right vehicle for your brilliant Ideas. You can be sure our deploy PowerPoint templates and PPT Slides provide you with a vast range of viable options. Select the appropriate ones and just fill in your text.
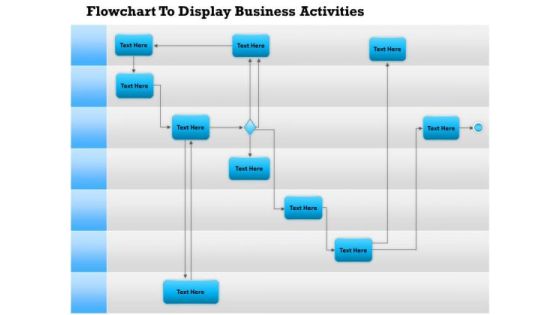
Business Diagram Flowchart To Display Business Activities Presentation Template
This image slide displays business consulting diagram of flow chart. This image slide exhibits business process. Use this PowerPoint template, in your presentations to express various business activities in process. This image slide will make your presentations precise.

Stock Photo Golden Dollar Symbol With Pie Graph PowerPoint Slide
This Power Point template has been crafted with graphic of golden dollar symbol and pie chart on a tablet. Display the concept of financial data analysis with this image. Use this image to present financial reports in business presentations.
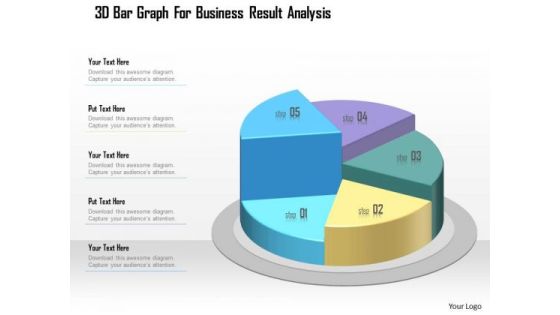
Business Diagram 3d Bar Graph For Business Result Analysis Presentation Template
This business slide displays five staged pie chart. This diagram is a data visualization tool that gives you a simple way to present statistical information. This slide helps your audience examine and interpret the data you present.
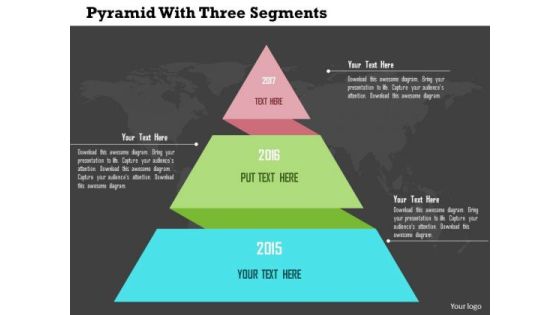
Business Diagram Pyramid With Three Segments Presentation Template
Sales process can be explained with this pyramid diagram. This diagram contains the graphic of pyramid chart with three segments. This diagram provides an effective way of displaying information.

How To Reach Your Target Audience PowerPoint Templates
Concept of target division for teams has been displayed in this 3d diagram. To display this concept we have used graphic of target boards design pie chart and team. Use this business diagram to build quality presentation for your viewers.
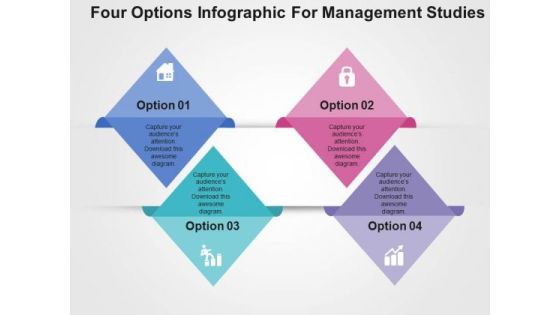
Four Options Infographic For Management Studies PowerPoint Templates
This business slide has been designed with four options infographic. You may download this diagram to display concept of management studies. Chart the course you intend to take with this slide
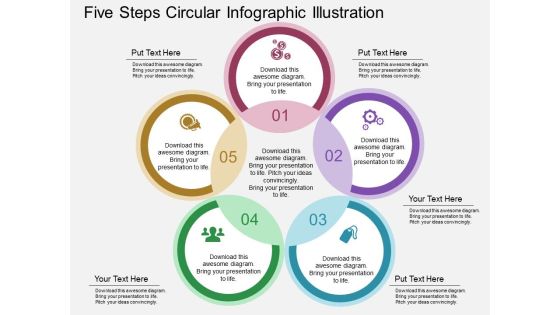
Five Steps Circular Infographic Illustration Powerpoint Template
Download this exclusive business diagram to present progress steps. This PowerPoint template contains the circular process chart. This diagram provides an effective way of displaying information you can edit text, color, shade and style as per you need.
Five Numeric Tags And Icons Powerpoint Template
This PowerPoint template has been designed with five numeric tags and icons. You may download this diagram to display flow of business steps. Chart the course you intend to take with this slide

Colorful House Model With Six Boxes And Icons Powerpoint Template
This PPT slide displays diagram of colorful house chart with bunch of keys. This has been designed to exhibit house safety and security. You can present your opinions using this impressive slide
Five Steps Pencil Diagram With Icons Powerpoint Template
The above PPT template displays graphics of pencil chart with icons. This diagram helps to display operational activities. Adjust the above diagram in your business presentations to visually support your content.
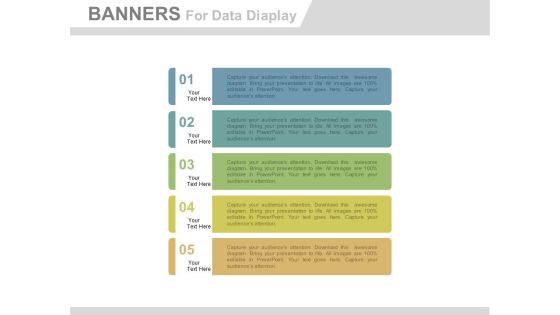
Five Banners To Display Business Information Powerpoint Template
This PowerPoint template has been designed with four numeric tags and icons. You may download this diagram slide to display flow of business steps. Chart the course you intend to take with this slide.

Four Arrow Banners For Synergy And Merger Powerpoint Template
Develop competitive advantage with our above template which contains four arrow banners chart with icons. This diagram provides an effective way of displaying business information. You can edit text, color, shade and style of this slide as per you need.
 Home
Home