Brand Plan
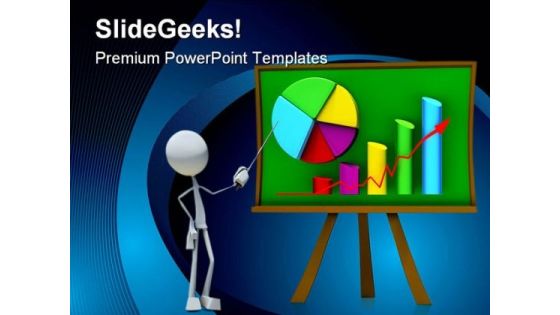
Showing Bar Chart Business PowerPoint Themes And PowerPoint Slides 0211
Microsoft PowerPoint Theme and Slide with character presenting 3d bar chart
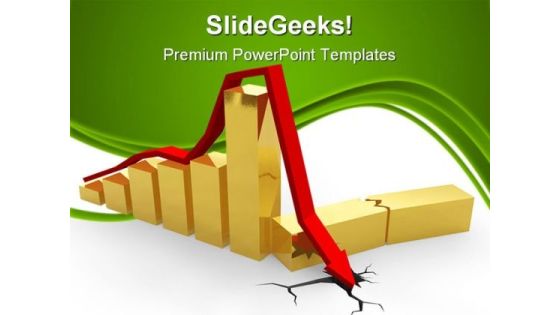
Crisis Chart Business PowerPoint Themes And PowerPoint Slides 0511
Microsoft PowerPoint Slide and Theme with golden crisis chart with red arrow fallen into the crack
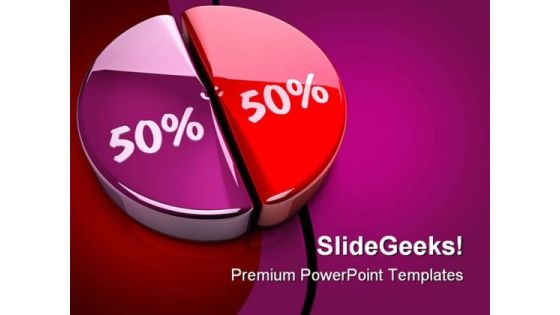
Pie Chart Percent Business PowerPoint Themes And PowerPoint Slides 0911
Microsoft PowerPoint Theme and Slide with pie chart with fifty fifty percent

Business Chart Finance PowerPoint Themes And PowerPoint Slides 0511
Microsoft PowerPoint Theme and Slide with illustration of a business chart with coin on the ground
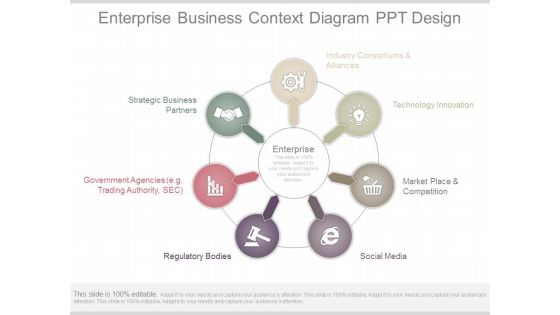
Enterprise Business Context Diagram Ppt Design
This is a enterprise business context diagram ppt design. This is a seven stage process. The stages in this process are industry consortiums and alliances, technology innovation, market place and competition, social media, regulatory bodies, government agencies trading authority, sec, strategic business partners.
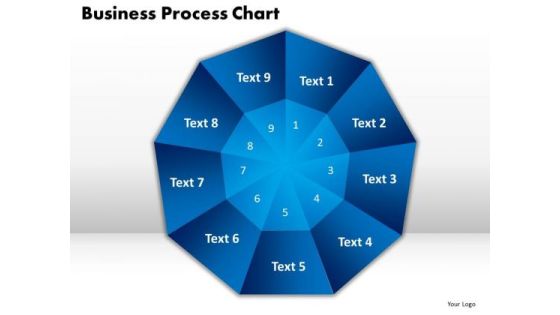
PowerPoint Process Business Process Chart Sales Ppt Themes
PowerPoint Process Business Process Chart Sales PPT Themes-This PowerPoint Process Chart shows the nine Different Layers which are to be followed in any business. This Business Diagram can be used in Marketing, Banking, and Management etc. This Diagram explains nine different topics.-PowerPoint Process Business Process Chart Sales PPT Themes

Profit Chart Success PowerPoint Templates And PowerPoint Themes 1012
Profit Chart Success PowerPoint Templates And PowerPoint Themes 1012-The above template displays a diagram of a profit chart with percentages on tab. This image represents the concept of business success. It is a useful captivating tool conceived to enable you to define your message in your Business and Marketing PPT presentations. Go ahead and add personality to your presentations with our high quality growth business chart template.-Profit Chart Success PowerPoint Templates And PowerPoint Themes 1012-This PowerPoint template can be used for presentations relating to-Success profit chart graphic, business, finance, success, money, marketing

Company Growth Chart Business PowerPoint Templates And PowerPoint Themes 0912
Company Growth Chart Business PowerPoint Templates And PowerPoint Themes 0912-Microsoft Powerpoint Templates and Background with business growth-Business growth, arrows, people, success, marketing, business

Activities And Functional Process Chart Powerpoint Slide Images
This is a activities and functional process chart powerpoint slide images. This is a four stage process. The stages in this process are marketing, finance, logistic, validate.
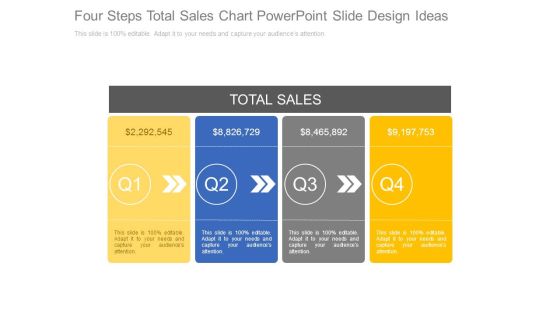
Four Steps Total Sales Chart Powerpoint Slide Design Ideas
This is a four steps total sales chart powerpoint slide design ideas. This is a four stage process. The stages in this process are total sales, marketing.

Puzzle Chart With Possible Solutions Ppt Background Template
This is a puzzle chart with possible solutions ppt background template. This is a four stage process. The stages in this process are puzzles, problem, solution, business, marketing.

Business Expenditure Analysis Pie Charts Ppt Infographic Template
This is a business expenditure analysis pie charts ppt infographic template. This is a three stage process. The stages in this process are pie, business, marketing, finance, success.

Radar Chart Ppt PowerPoint Presentation Infographic Template Design Templates
This is a radar chart ppt powerpoint presentation infographic template design templates. This is a seven stage process. The stages in this process are business, shapes, product, marketing.

Radar Chart Ppt PowerPoint Presentation Pictures Graphics Example
This is a radar chart ppt powerpoint presentation pictures graphics example. This is a two stage process. The stages in this process are business, marketing, shapes, diagram.
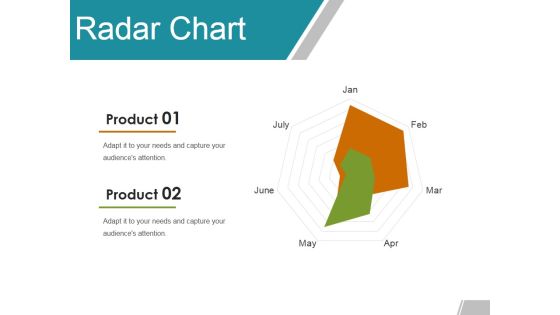
Radar Chart Ppt PowerPoint Presentation Gallery Example Topics
This is a radar chart ppt powerpoint presentation gallery example topics. This is a seven stage process. The stages in this process are product, business, marketing, shapes.

Basic Gap Analysis Chart Ppt PowerPoint Presentation Professional Portfolio
This is a basic gap analysis chart ppt powerpoint presentation professional portfolio. This is a six stage process. The stages in this process are business, step, marketing, management.

Radar Chart Ppt PowerPoint Presentation Infographic Template Graphics Template
This is a radar chart ppt powerpoint presentation infographic template graphics template. This is a six stage process. The stages in this process are product, business, marketing, shapes.
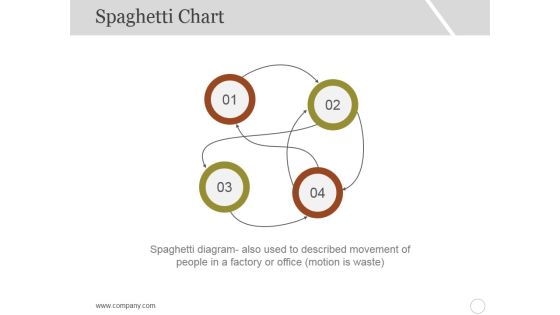
Spaghetti Chart Template 2 Ppt PowerPoint Presentation Inspiration Professional
This is a spaghetti chart template 2 ppt powerpoint presentation inspiration professional. This is a four stage process. The stages in this process are business, marketing, management, numbering.
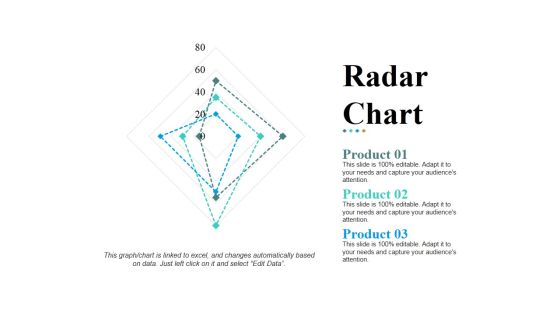
Radar Chart Ppt PowerPoint Presentation Pictures Design Templates
This is a radar chart ppt powerpoint presentation pictures design templates. This is a three stage process. The stages in this process are product, shapes, business, marketing, management.

Example Of Content Marketing Trends Ppt Good Ppt Example
This is a example of content marketing trends ppt good ppt example. This is a eight stage process. The stages in this process are content inventory, keyword research and analytics review, scrumming it up, content analysis and taxonomy, voice definition, editorial calendar, inbound marketing and social media, stakeholder interviews.

Business Process Redesign Example Powerpoint Slide Background
This is a business process redesign example powerpoint slide background. This is a eight stage process. The stages in this process are business transformation, project leadership, business process management, project management, operational and change management excellence, regulatory compliance, regulatory watch, business analysis.
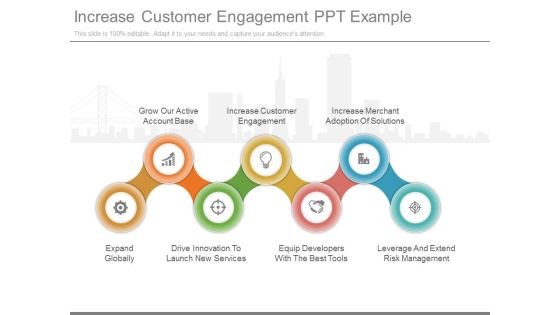
Increase Customer Engagement Ppt Example
This is a increase customer engagement ppt example. This is a seven stage process. The stages in this process are grow our active account base, increase customer engagement, increase merchant adoption of solutions, leverage and extend risk management, equip developers with the best tools, drive innovation to launch new services, expand globally.

Business Consulting Services Sample Diagram Ppt Example
This is a business consulting services sample diagram ppt example. This is a six stage process. The stages in this process are enterprises performance management, strategic technology advisory services, auto id solution carter, sustainability, supply chain management, crm and locality consulting, transform, business consulting services, innovate, optimize, improve, align.

Example Of Sustainable Workplace Vision Ppt Powerpoint Images
This is a example of sustainable workplace vision ppt powerpoint images. This is a three stage process. The stages in this process are build, leadership, innovation, technology, communication, transform, green procurement, sustainable workplace operations, greening services to clients, invasive alien species, greenhouse gas emissions and energy, real property environmental performance, water management, achieve, cost saving, improved employee performance, environmental sustainability.
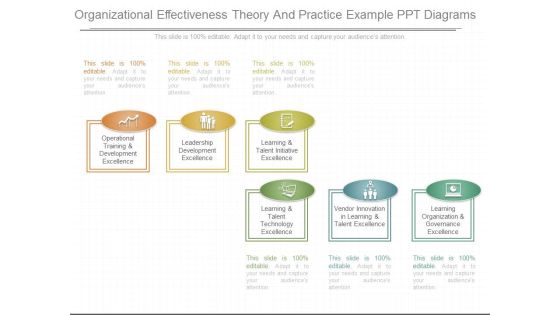
Organizational Effectiveness Theory And Practice Example Ppt Diagrams
This is a organizational effectiveness theory and practice example ppt diagrams. This is a six stage process. The stages in this process are operational training and development excellence, leadership development excellence, learning and talent initiative excellence, learning and talent technology excellence, vendor innovation in learning and talent excellence, learning organization and governance excellence.

Introduction Stage Of New Product Powerpoint Templates
This is a introduction stage of new product powerpoint templates. This is a five stage process. The stages in this process are sales, low sales, profits, negative profits, competition, little competition, targets, innovators are targeted, cost, high cost per customer acquired.
Introduction Stage Of Product Cost Analysis Ppt Icon
This is a introduction stage of product cost analysis ppt icon. This is a five stage process. The stages in this process are high cost per customer acquired, innovators are targeted, little competition, negative profits, low sales, cost, targets, competition, profits, sales.
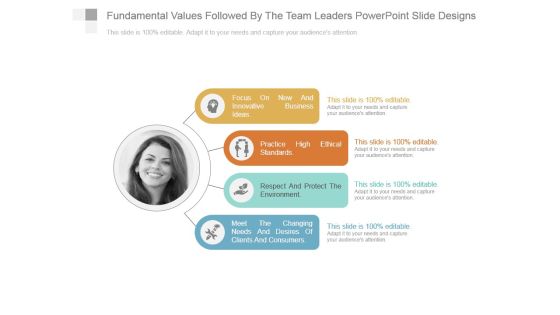
Fundamental Values Followed By The Team Leaders Powerpoint Slide Designs
This is a fundamental values followed by the team leaders powerpoint slide designs. This is a four stage process. The stages in this process are focus on new and innovative business ideas, practice high ethical standards, respect and protect the environment, meet the changing needs and desires of clients and consumers.
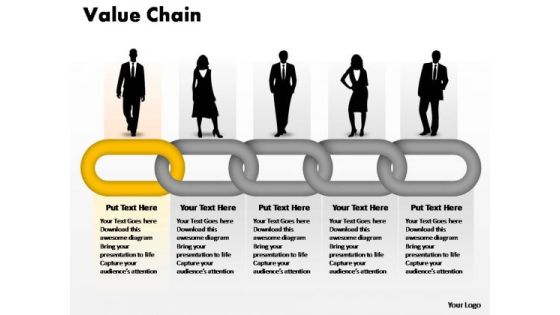
PowerPoint Presentation Chart Designs Business Value Chain Ppt Slide
PowerPoint Presentation Chart Designs Business Value Chain PPT Slide- By using this value chain diagram you can visualize events and the analysis of risks and uncertainties can be significantly explained. -PowerPoint Presentation Chart Designs Business Value Chain PPT Slide

Business Diagram Design Process Chart PowerPoint Ppt Presentation
This diagram shows design of process chart. It contains five steps diagram. These steps are define, research, create, refine and test. Download this process chart as a tool for business presentations.

Business Structure Comparison Chart Ppt PowerPoint Presentation Infographic Template Vector
This is a business structure comparison chart ppt powerpoint presentation infographic template vector. This is a three stage process. The stages in this process are business structure comparison chart.
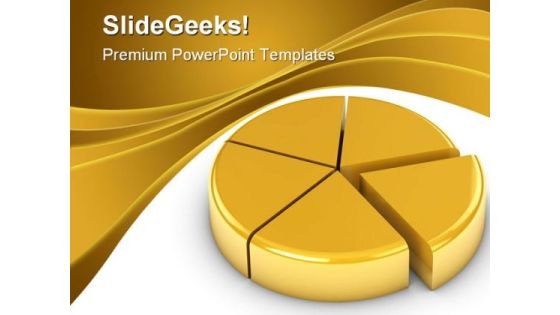
Golden Pie Chart Business PowerPoint Backgrounds And Templates 1210
Microsoft PowerPoint Template and Background with Golden pie chart on a white background. Part of a series
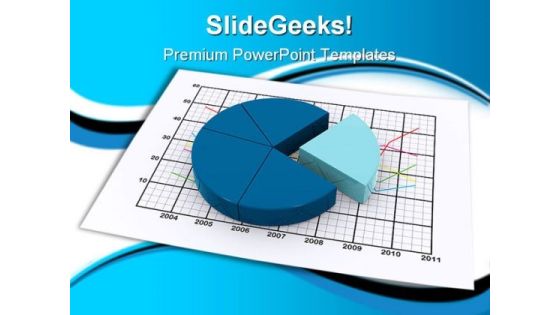
Pie Chart Graph Business PowerPoint Backgrounds And Templates 1210
Microsoft PowerPoint Template and Background with pie chart lying on a paper sheet containing a business diagram(3 render)

Pie Chart Business Success PowerPoint Templates And PowerPoint Backgrounds 0811
Microsoft PowerPoint Template and Background with business people stood on a pie chart with successful business thoughts

Pie Chart Business Success PowerPoint Themes And PowerPoint Slides 0811
Microsoft PowerPoint Theme and slide with business people stood on a pie chart with successful business thoughts
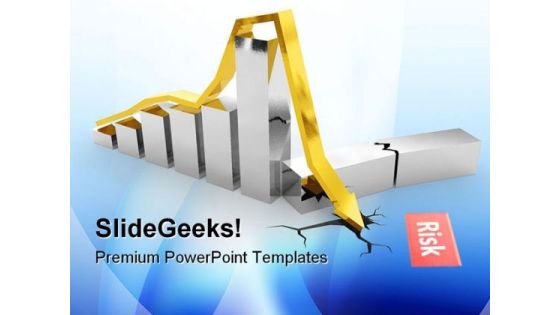
Financial Crisis Chart Business PowerPoint Themes And PowerPoint Slides 0811
Microsoft PowerPoint Theme and Slide with steel crisis chart with golden arrow dropped into crack in white surface

Funding Charts Finance PowerPoint Templates And PowerPoint Themes 0512
Funding Charts Finance PowerPoint Templates And PowerPoint Themes PPT designs-Microsoft Powerpoint Templates and Background with business graph

Lego Growth Chart Business PowerPoint Templates And PowerPoint Themes 0512
Lego Growth Chart Business PowerPoint Templates And PowerPoint Themes PPT designs-Microsoft Powerpoint Templates and Background with bar graph

Raising Money Chart Finance PowerPoint Templates And PowerPoint Themes 0512
Raising Money Chart Finance PowerPoint Templates And PowerPoint Themes PPT designs-Microsoft Powerpoint Templates and Background with business graph

Loss Chart Business PowerPoint Templates And PowerPoint Themes 0812
Loss Chart Business PowerPoint Templates And PowerPoint Themes 0812-Microsoft Powerpoint Templates and Background with business failure graph down arrow

Rescue Pie Chart Business PowerPoint Templates And PowerPoint Themes 1112
Rescue Pie Chart Business PowerPoint Templates And PowerPoint Themes 1112-This Awesome PowerPoint template contains a diagram of lifesaver and pie chart. This image depicts the concept of statistics. Adjust the above image in your PPT presentations to visually support your content in your Business and Marketing PPT slideshows. Present your views using our innovative slides and be assured of leaving a lasting impression.-Rescue Pie Chart Business PowerPoint Templates And PowerPoint Themes 1112-This PowerPoint template can be used for presentations relating to-Lifesaver and Pie Chart, Symbol, Finance, Marketing, Business, Metaphor

Public Relations Evaluation Example Ppt Infographics
This is a public relations evaluation example ppt infographics. This is a four stage process. The stages in this process are function of public relations, evaluates public attitudes, identifies areas of public interest, executes programs to win public.

Reliable Audit Practice Diagram Powerpoint Ideas
This is a reliable audit practice diagram powerpoint ideas. This is a five stage process. The stages in this process are management response, control testing and remediation, significant effort, work program execution, risk management.
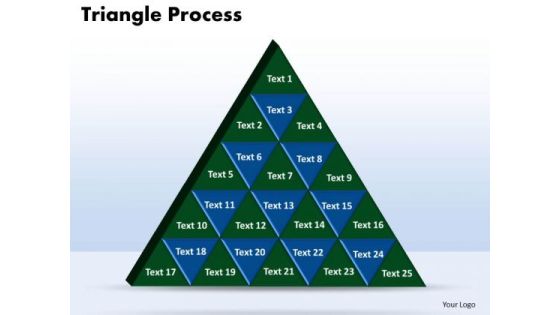
PowerPoint Slide Designs Triangle Process Chart Ppt Template
PowerPoint Slide Designs triangle process Chart PPT Template-Use this diagram to show containment, proportional, or interconnected relationships. You can add text in the triangular shapes-Business, chart, color, concept, conceptual, construction, corporate, creating, data, design, diagram, direction, focus, graph, group, growth, hierarchy, illustration, information, isolated, layer, layered, level, manage, management, model, object, organization, performance, population, presentation, principal, process, progress, pyramid, rank, resource, shape, stage, structure, support, symbol, top, triangle, vector-PowerPoint Slide Designs triangle process Chart PPT Template

Business Diagram Pie Chart Showing Percentages Presentation Template
This image slide displays business consulting diagram of pie chart showing percentage. Pie Charts can be used to display a wide variety of information. When data is represented in the form of a pie chart the human eye finds it very easy to compare the data and quickly draw conclusions. In short they are a great visual aid and will add a touch of professionalism to any presentation which requires the display of data.

Raising Chart Finance PowerPoint Templates And PowerPoint Themes 0512
Microsoft Powerpoint Templates and Background with business graph-Raising Chart Finance PowerPoint Templates And PowerPoint Themes 0512-These PowerPoint designs and slide layouts can be used for themes relating to -Business graph, success, money, marketing, finance, shapes
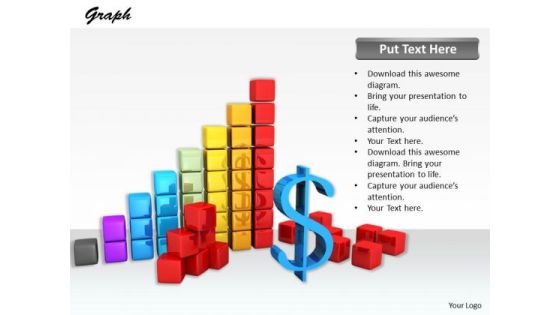
Stock Photo Design Of Financial Charts And Reports PowerPoint Slide
This image slide has been professionally designed to give complete look to your business presentations. This image is designed with graphics of business reports and charts. Use this image in marketing and sales related presentations.
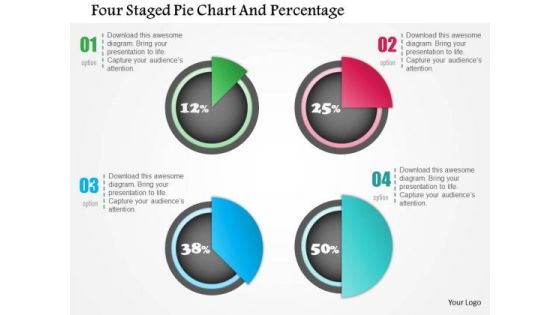
Business Diagram Four Staged Pie Chart And Percentage Presentation Template
Four staged pie chart and percentage values has been used to design this power point template. This PPT contains the concept of financial result analysis. Use this PPT for business and marketing related presentations.
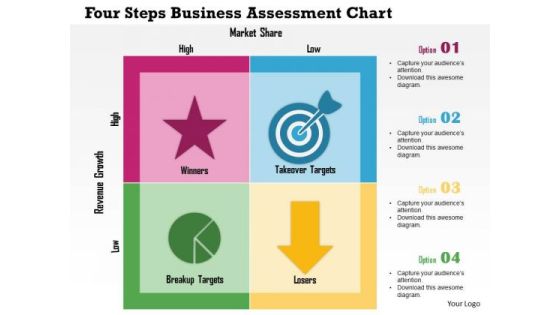
Business Diagram Four Steps Business Assessment Chart Presentation Template
Graphic of four steps assessment chart has been used to design this power point template. This PPT contains the concept of business assessment process. This PPT is suitable for business and marketing related presentations.

Business Diagram Business People Over Bar Chart PowerPoint Template
This Power Point template has been designed with graphic of business people and bar chart. This PPT contains the concept of result analysis and business data display. Use this PPT slide for your business and marketing related presentations.

Pie Chart On Magnifying Glass For Business Analysis PowerPoint Template
Visually support your presentation with our above template showing pie chart on magnifying glass. This slide has been professionally designed to emphasize the concept of market research and analysis. Deliver amazing presentations to mesmerize your audience.
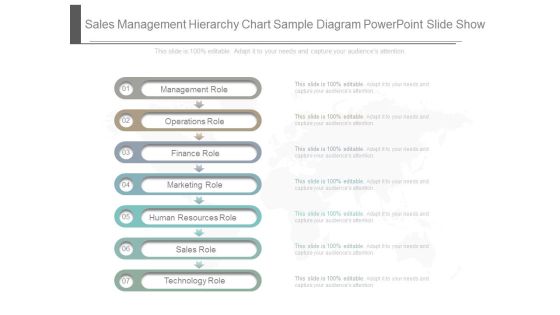
Sales Management Hierarchy Chart Sample Diagram Powerpoint Slide Show
This is a sales management hierarchy chart sample diagram powerpoint slide show. This is a seven stage process. The stages in this process are management role, operations role, finance role, marketing role, human resources role, sales role, technology role.
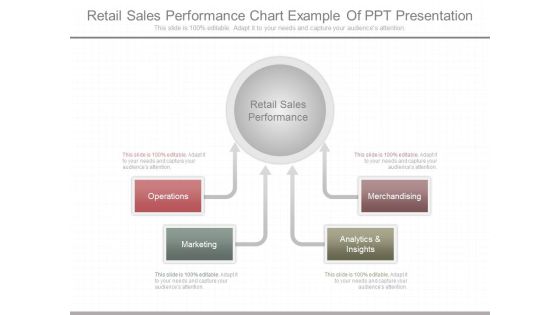
Retail Sales Performance Chart Example Of Ppt Presentation
This is a retail sales performance chart example of ppt presentation. This is a four stage process. The stages in this process are operations, marketing, analytics and insights, merchandising, retail sales performance.
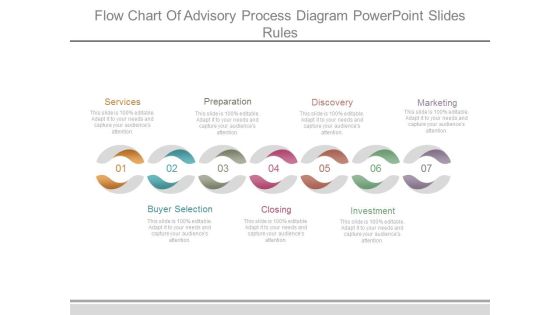
Flow Chart Of Advisory Process Diagram Powerpoint Slides Rules
This is a flow chart of advisory process diagram powerpoint slides rules. This is a seven stage process. The stages in this process are services, buyer selection, preparation, closing, discovery, investment, marketing.
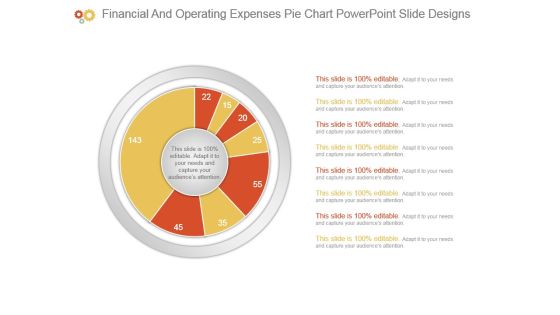
Financial And Operating Expenses Pie Chart Powerpoint Slide Designs
This is a financial and operating expenses pie chart powerpoint slide designs. This is a eight stage process. The stages in this process are business, diagram, marketing, management, presentation.

Donut Pie Chart Ppt PowerPoint Presentation Infographic Template Layout Ideas
This is a donut pie chart ppt powerpoint presentation infographic template layout ideas. This is a five stage process. The stages in this process are product, business, finance, marketing.
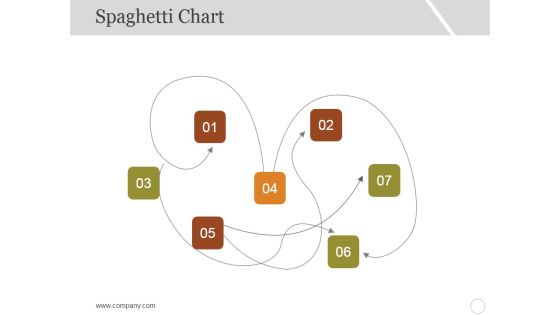
Spaghetti Chart Template 1 Ppt PowerPoint Presentation Slides Graphics Example
This is a spaghetti chart template 1 ppt powerpoint presentation slides graphics example. This is a seven stage process. The stages in this process are business, marketing, management, numbering.

Flow PowerPoint Template Vertical Steps Working With Slide Numbers 5 1 Image
We present our flow PowerPoint template vertical steps working with slide numbers 5 1 Image. Use our Advertising PowerPoint Templates because; now put it up there for all to see. Use our Arrows PowerPoint Templates because; Present your views on the methods using our self-explanatory templates. Use our Layers PowerPoint Templates because, You have it all down to a T. Use our Shapes PowerPoint Templates because, Educate your listeners on the means to keep it ticking over. Use our Business PowerPoint Templates because; emphasize the benefits of healthy food habits and lifestyles in respect of vital organs of the human anatomy. Use these PowerPoint slides for presentations relating to abstract, advertising, arrow, background, banner, choice, clean, compare, concept, design, icon, illustration, label, layout, modern, product, progress, promotion, rounded, simple, step, sticker, symbol, tutorial, two, vector, version, vertical, web, web design, website. The prominent colors used in the PowerPoint template are Green, Gray, and Black

Stock Photo Pie Chart And Bar Graph PowerPoint Template
Put In A Dollop Of Our stock photo Pie Chart And Bar Graph powerpoint template Powerpoint Templates. Give Your Thoughts A Distinctive Flavor.
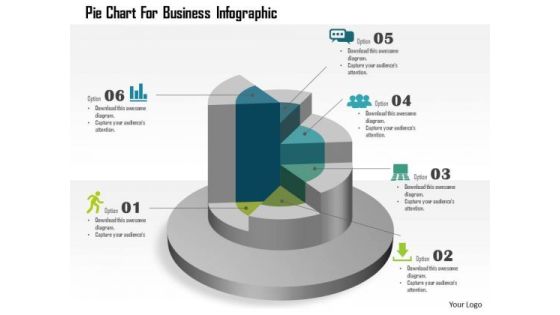
Business Diagram Pie Chart For Business Infographic Presentation Template
This template displays pie chart business infographic. You may download this business slide for result analysis. Amplify your thoughts via this appropriate business template.

Management Information Systems Chart Powerpoint Slide Presentation Tips
This is a management information systems chart powerpoint slide presentation tips. This is a three stage process. The stages in this process are organizations, technology, management, information system.

Mutual Fund Operation Flow Chart Diagram Ppt Ideas
This is a mutual fund operation flow chart diagram ppt ideas. This is a four stage process. The stages in this process are returns, securities, investors, fund manager.

Budget Calculator Chart Layout Powerpoint Slides Designs Download
This is a budget calculator chart layout powerpoint slides designs download. This is a three stage process. The stages in this process are budget tracking, report, adjust.
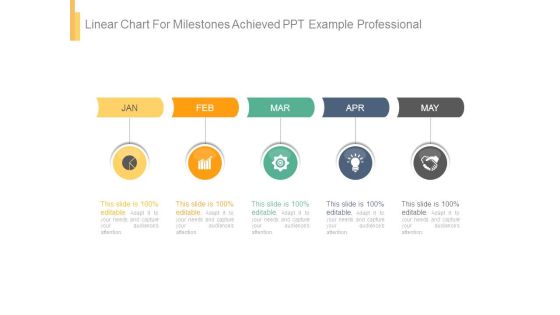
Linear Chart For Milestones Achieved Ppt Example Professional
This is a linear chart for milestones achieved ppt example professional. This is a five stage process. The stages in this process are jan, feb, mar, apr, may.
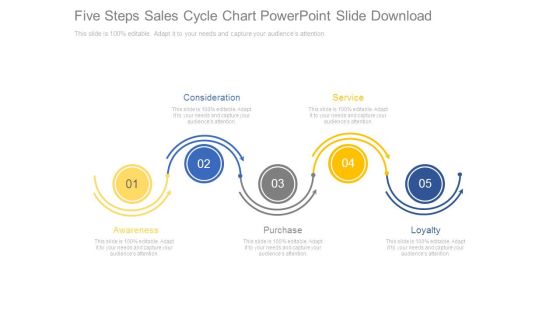
Five Steps Sales Cycle Chart Powerpoint Slide Download
This is a five steps sales cycle chart powerpoint slide download. This is a five stage process. The stages in this process are consideration, service, loyalty, purchase, awareness.
Sales Summary Review Chart With Icons Ppt Background Graphics
This is a sales summary review chart with icons ppt background graphics. This is a four stage process. The stages in this process are business, presentation, analysis, process.

Hierarchy Chart Ppt PowerPoint Presentation Model Graphics Pictures
This is a hierarchy chart ppt powerpoint presentation model graphics pictures. This is a four stage process. The stages in this process are ceo, accountant, sales, developer, designer.
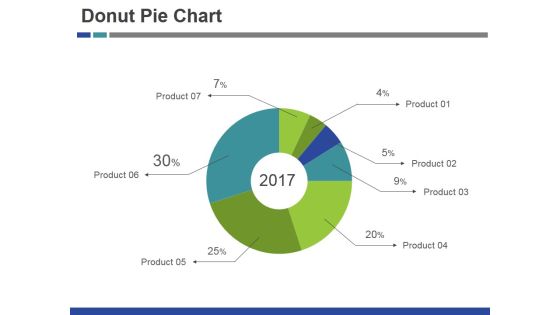
Donut Pie Chart Ppt PowerPoint Presentation Infographics Images
This is a donut pie chart ppt powerpoint presentation infographics images. This is a seven stage process. The stages in this process are product, year, pie, process, business.

Donut Pie Chart Ppt PowerPoint Presentation Slides Example
This is a donut pie chart ppt powerpoint presentation slides example. This is a five stage process. The stages in this process are product, finance, business, process.

Daunt Pie Chart Ppt PowerPoint Presentation Layouts Portrait
This is a daunt pie chart ppt powerpoint presentation layouts portrait. This is a three stage process. The stages in this process are percentage, finance, donut, business.
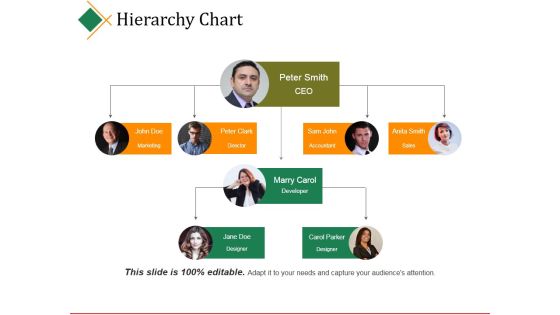
Hierarchy Chart Ppt PowerPoint Presentation Infographic Template Graphics
This is a hierarchy chart ppt powerpoint presentation infographic template graphics. This is a four stage process. The stages in this process are ceo, director, accountant, sales, developer.
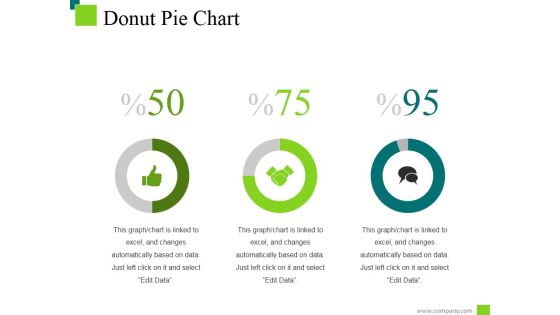
Donut Pie Chart Ppt PowerPoint Presentation Inspiration Deck
This is a donut pie chart ppt powerpoint presentation inspiration deck. This is a three stage process. The stages in this process are percentage, finance, donut, business.

Donut Pie Chart Ppt PowerPoint Presentation Model Pictures
This is a donut pie chart ppt powerpoint presentation model pictures. This is a six stage process. The stages in this process are product, percentage, finance, year, business.
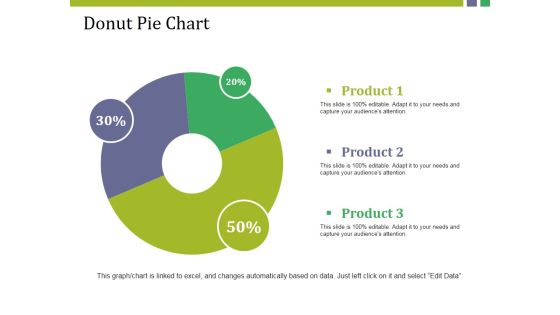
Donut Pie Chart Ppt PowerPoint Presentation Model Show
This is a donut pie chart ppt powerpoint presentation model show. This is a three stage process. The stages in this process are product, donut, percentage, finance, business.
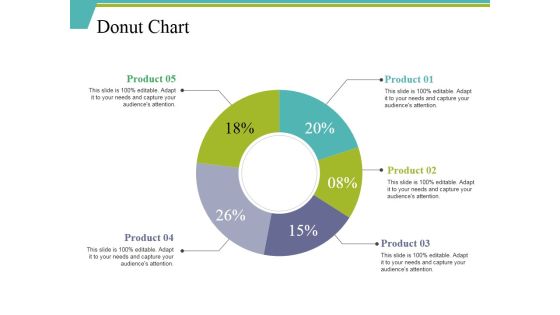
Donut Chart Ppt PowerPoint Presentation Ideas Background Designs
This is a donut chart ppt powerpoint presentation ideas background designs. This is a five stage process. The stages in this process are percentage, finance, donut, business, product.
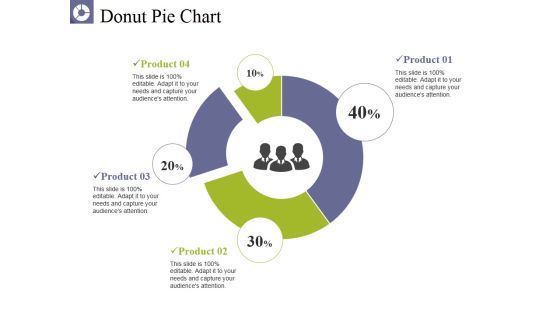
Donut Pie Chart Ppt PowerPoint Presentation Pictures Graphics
This is a donut pie chart ppt powerpoint presentation pictures graphics. This is a four stage process. The stages in this process are product, business, percentage, donut, finance.

PowerPoint Template Business Process Chart Success Ppt Theme
PowerPoint Template Business Process Chart Success PPT Theme-This PowerPoint Diagram consists of Red Kite of four layers as shown. It portrays the concept of teamwork. These four layers combine to form one unique Design.-PowerPoint Template Business Process Chart Success PPT Theme

Business Diagram Percentage Pie Chart On Computer Tablet Presentation Template
This image slide displays business consulting diagram of percentage pie chart on computer tablet. This image has been made with 3d colorful graphic of pie chart on black tablet. Use this PowerPoint template, in your presentations to express various views like growth, achievements, success in business. This image slide will make your presentations outshine.
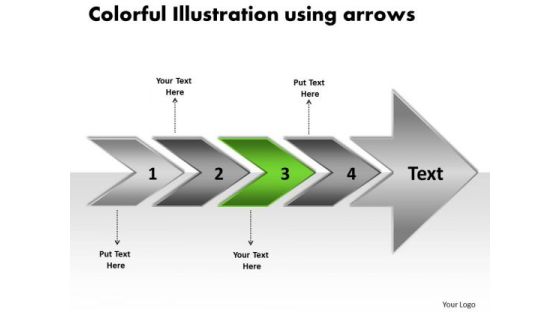
Colorful Illustration Using Arrows Sample Flow Charts PowerPoint Slides
We present our colorful illustration using arrows sample flow charts PowerPoint Slides.Use our Marketing PowerPoint Templates because,You can Explain the contribution of each of the elements and how they provide impetus to the next phase. Use our Arrows PowerPoint Templates because,This one depicts the popular chart. Use our Shapes PowerPoint Templates because,The colour coding of our templates are specifically designed to highlight you points. Use our Business PowerPoint Templates because,You are ready to flap your wings and launch off. All poised are you to touch the sky with glory Use our Targets PowerPoint Templates because,You know the path so show the way.Use these PowerPoint slides for presentations relating to Arrow, background, banner, business, chart, colorful, diagram, advertising, direction, element, financial, flow, gradient, illustration, isolated, marketing mirrored, placeholderm, presentation, process, success, steps. The prominent colors used in the PowerPoint template are Green, Gray, White
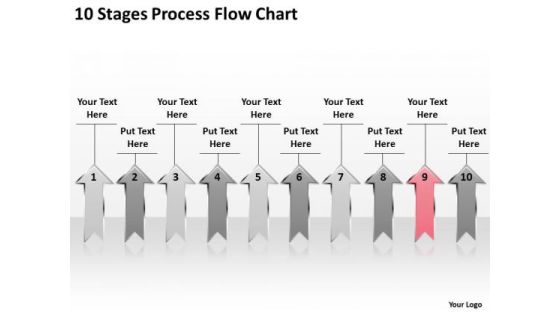
PowerPoint Arrows 10 Stages Process Flow Chart Ppt 9 Slides
arrow, art, background, blank, blue, business, chart, clip, diagram, drop, eps10, flow, four, graph, graphic, gray, green, heat, illustration, map, process, red, shadow, shape, step, symbol, transparency, vector, white, yellow

Stock Photo Graphics For Business Reports And Charts PowerPoint Slide
This image contains graphics of business reports and charts. Download this image for business and sales presentations where you have to focus on financial growth. Dazzle the audience with your thoughts.

Stock Photo Graphics Of Business Reports And Charts PowerPoint Slide
The above slide displays an image of business charts and reports. Use this professionally designed image to make your message to be spread in a more effective manner. This can add up spice to corporate displays.
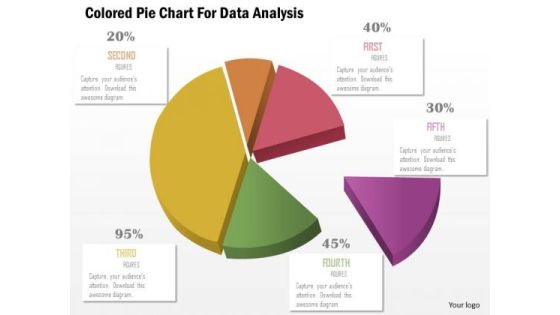
Business Diagram Colored Pie Chart For Data Analysis Presentation Template
This business slide displays pie chart. This diagram is a data visualization tool that gives you a simple way to present statistical information. This slide helps your audience examine and interpret the data you present.
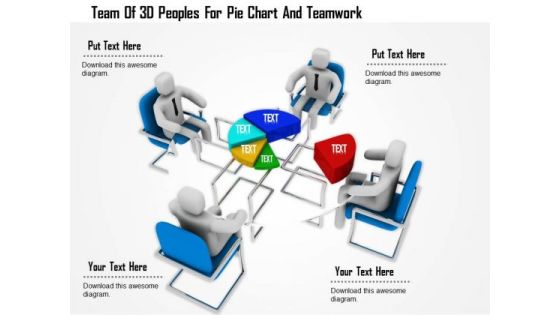
Team Of 3d Peoples For Pie Chart And Teamwork
This Power Point template has been designed with graphic of 3d team forming a pie chart. In this slide team is displaying data analysis. Use this editable slide to build innovative presentation for your viewers.
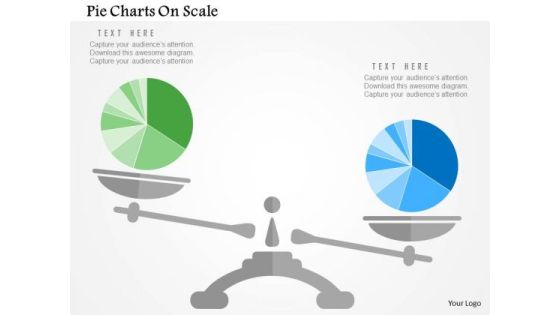
Business Diagram Pie Charts On Scale Presentation Template
Our above slide display graphics of pie chart on a scale. Download this diagram slide to display competitive analysis of business. Adjust the above diagram in your business presentations to visually support your content.
Business Diagram Icons And Charts For Business Growth Presentation Template
Our above slide contains graphics of business charts and icons. It helps to display business reports and analysis. Use this diagram to impart more clarity to data and to create more sound impact on viewers.

Business Diagram Matrix Chart For Financial Review Presentation Template
Our above business diagram has been designed with graphics of matrix chart. This slide is suitable to present financial review. Use this business diagram to present your work in a more smart and precise manner.
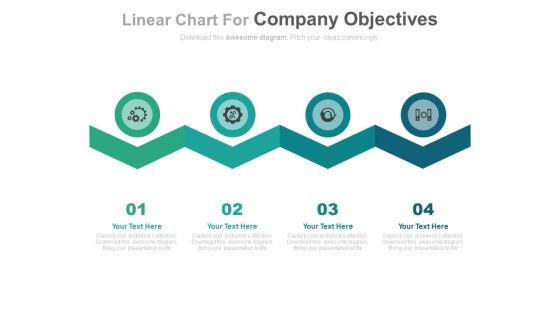
Zigzag Linear Chart For Strategic Management Process Powerpoint Template
This business slide displays graphics of zigzag linear chart. You may use this PPT slide to display strategic management process. Make your mark with this unique slide and create an impression that will endure.

Circular Chart With Icons For Value Chain Powerpoint Template
This PowerPoint template has been designed with circular chart and icons. This professional PPT slide is suitable to present value chain analysis. Capture the attention of your audience using this professional slide.
Sequential Chart With Financial Management Icons Powerpoint Template
This PowerPoint template has been designed with sequential chart with icons. This business slide may be used to display financial management steps. Present your views and ideas with this impressive design.
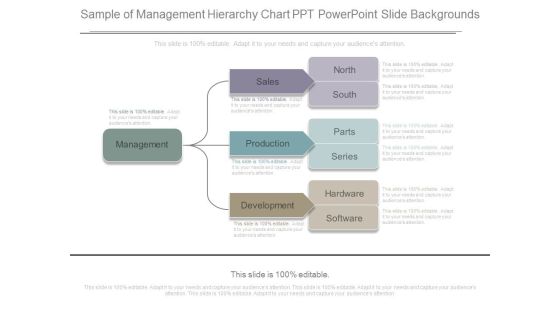
Sample Of Management Hierarchy Chart Ppt Powerpoint Slide Backgrounds
This is a sample of management hierarchy chart ppt powerpoint slide backgrounds. This is a one stage process. The stages in this process are management, sales, production, development, north, south, parts, series, hardware, software.

Operational Flow Of Financial Services Chart Example Of Ppt
This is a operational flow of financial services chart example of ppt. This is a five stage process. The stages in this process are customer, mobile, atm, employees, high finance trading.

Real Estate Investing Cash Flow Chart Powerpoint Templates
This is a real estate investing cash flow chart powerpoint templates. This is a four stage process. The stages in this process are cash flow, tax benefits, debt pay down, appreciation.

Areas Of Qualitative Research Chart Powerpoint Slide Show
This is a areas of qualitative research chart powerpoint slide show. This is a nine stage process. The stages in this process are commercial, healthcare, communication, manufacturing, legal, financial,, education, government, technology.

Competence Cycle For Business Excellence Chart Powerpoint Layout
This is a competence cycle for business excellence chart powerpoint layout. This is a four stage process. The stages in this process are confidence competence cycle, competence, comfort, control, confidence.
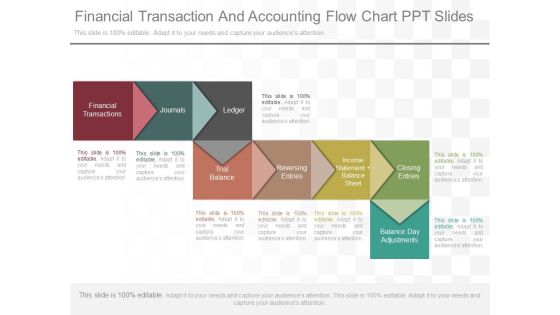
Financial Transaction And Accounting Flow Chart Ppt Slides
This is a financial transaction and accounting flow chart ppt slides. This is a eight stage process. The stages in this process are financial transactions, journals, ledger, trial balance, reversing entries, income statement balance sheet, closing entries, balance day adjustments.
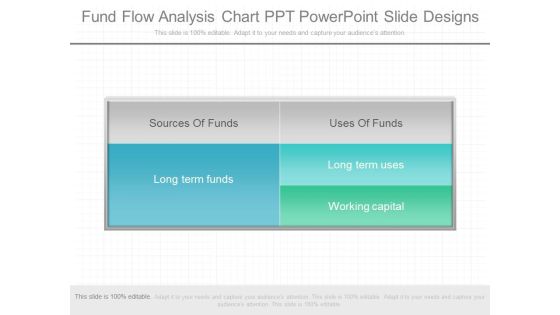
Fund Flow Analysis Chart Ppt Powerpoint Slide Designs
This is a fund flow analysis chart ppt powerpoint slide designs. This is a five stage process. The stages in this process are sources of funds, long term funds, uses of funds, long term uses, working capital.
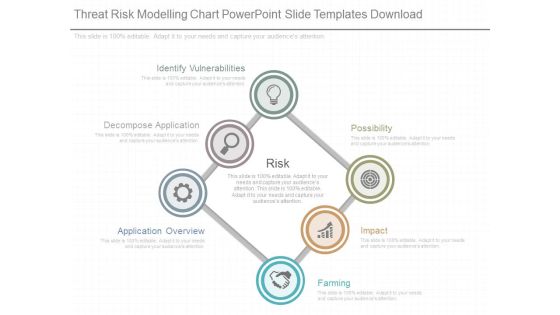
Threat Risk Modelling Chart Powerpoint Slide Templates Download
This is a threat risk modelling chart powerpoint slide templates download. This is a six stage process. The stages in this process are identify vulnerabilities, decompose application, application overview, possibility, impact, farming, risk.

Manage Risk In A Global Supply Chain Chart Ppt Summary
This is a Manage Risk In A Global Supply Chain Chart Ppt Summary. This is a five stage process. The stages in this process are distance, culture, communication, priority, intellectual property, risk.

Conversion Rate Optimization Flow Chart Sample Diagram Powerpoint Slides Images
This is a conversion rate optimization flow chart sample diagram powerpoint slides images. This is a five stage process. The stages in this process are gather insights, measure, unique, pitch, status, future.
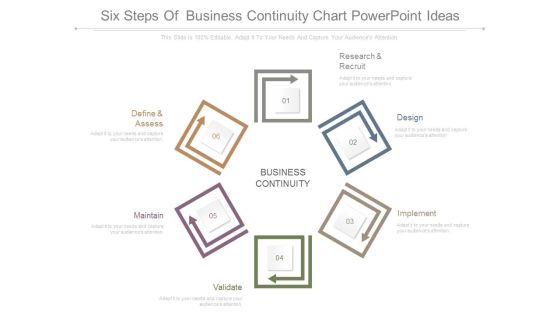
Six Steps Of Business Continuity Chart Powerpoint Ideas
This is a six steps of business continuity chart powerpoint ideas. This is a six stage process. The stages in this process are define and assess, research and recruit, design, implement, validate, maintain, business continuity.

Conversion Rate Optimization Flow Chart Sample Diagram Example Ppt
This is a conversion rate optimization flow chart sample diagram example ppt. This is a four stage process. The stages in this process are measure, gather insights, test, form hypothesis.

Customer Awareness Process Flow Chart Ppt Presentation Deck
This is a customer awareness process flow chart ppt presentation deck. This is a seven stage process. The stages in this process are loyalty, public relation, sales promotion, advertising, purchase, preference, awareness.
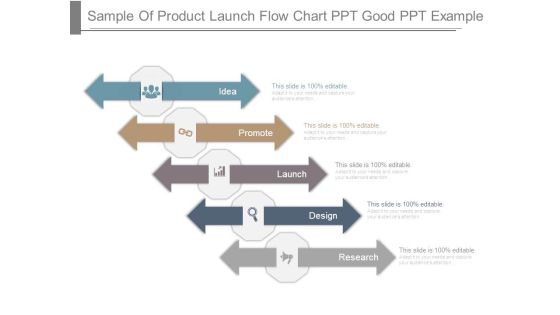
Sample Of Product Launch Flow Chart Ppt Good Ppt Example
This is a sample of product launch flow chart ppt good ppt example. This is a five stage process. The stages in this process are idea, promote, launch, design, research.
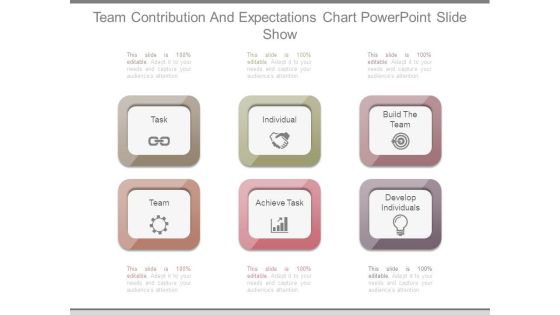
Team Contribution And Expectations Chart Powerpoint Slide Show
This is a team contribution and expectations chart powerpoint slide show. This is a six stage process. The stages in this process are task, individual, build the team, team, achieve task, develop individuals.

Custom Website Development Chart Powerpoint Slides Templates Download
This is a custom website development chart powerpoint slides templates download. This is a six stage process. The stages in this process are analyze requirement, design architecture, implementation, integration, quality control, refinement, deployment.

Closed Loop Life Cycle Chart Powerpoint Slide Backgrounds
This is a closed loop life cycle chart powerpoint slide backgrounds. This is a seven stage process. The stages in this process are consumption and use, results, manufacturing, materials sourcing, distribution logistics, sale and retail, underlying assumption.

Sample Of User Guide Flow Chart Diagram Powerpoint Ideas
This is a sample of user guide flow chart diagram powerpoint ideas. This is a five stage process. The stages in this process are data, process, decision, document, sored data.
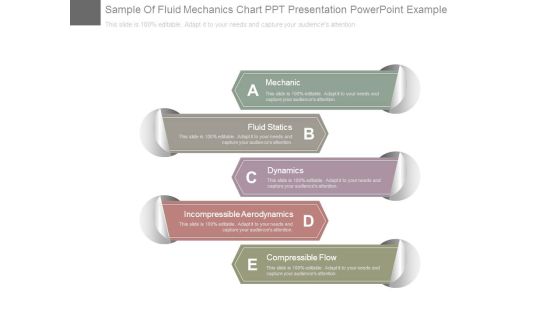
Sample Of Fluid Mechanics Chart Ppt Presentation Powerpoint Example
This is a sample of fluid mechanics chart ppt presentation powerpoint example. This is a five stage process. The stages in this process are mechanic, fluid statics, dynamics, incompressible aerodynamics, compressible flow.
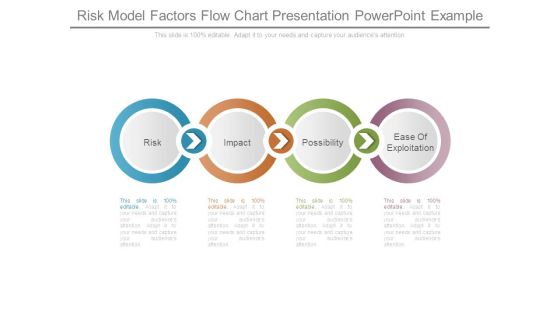
Risk Model Factors Flow Chart Presentation Powerpoint Example
This is a risk model factors flow chart presentation powerpoint example. This is a four stage process. The stages in this process are risk, impact, possibility, ease of exploitation.
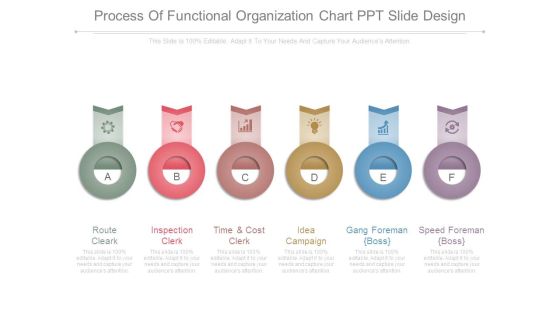
Process Of Functional Organization Chart Ppt Slide Design
This is a process of functional organization chart ppt slide design. This is a six stage process. The stages in this process are route cleark, inspection clerk, time and cost clerk, idea campaign, gang foreman boss, speed foreman boss.
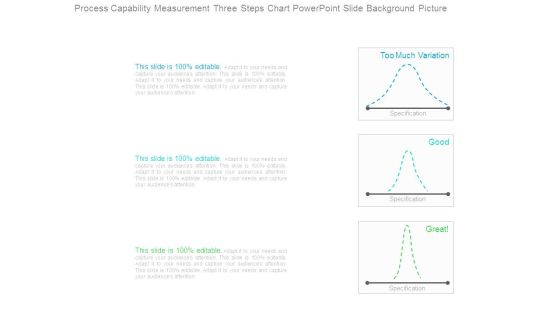
Process Capability Measurement Three Steps Chart Powerpoint Slide Background Picture
This is a process capability measurement three steps chart powerpoint slide background picture. This is a three stage process. The stages in this process are too much variation, specification, good, great.

Six Sigma Linear Circles Chart Presentation Powerpoint Templates
This is a six sigma linear circles chart presentation powerpoint templates. This is a five stage process. The stages in this process are bottom line, trained individuals, engagement, project by project, customer focused.
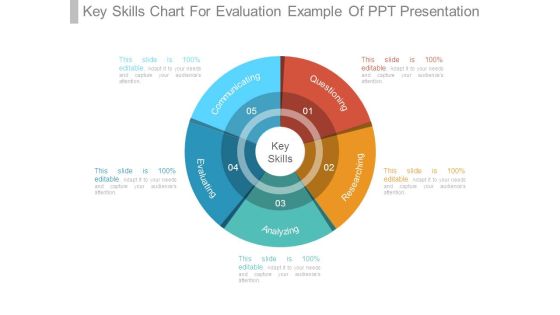
Key Skills Chart For Evaluation Example Of Ppt Presentation
This is a key skills chart for evaluation example of ppt presentation. This is a five stage process. The stages in this process are communicating, questioning, researching, analyzing, evaluating, key skills.

Competition Competitor Identification Charts Powerpoint Slide Presentation Examples
This is a competition competitor identification charts powerpoint slide presentation examples. This is a four stage process. The stages in this process are key national competitors, substitutes, new entrants, competitor.

Competitor Analysis 2 X 2 Matrix Chart Powerpoint Slide Show
This is a competitor analysis 2 x 2 matrix chart powerpoint slide show. This is a four stage process. The stages in this process are competitor, your company, competitor, complex, simple, fast, slow.
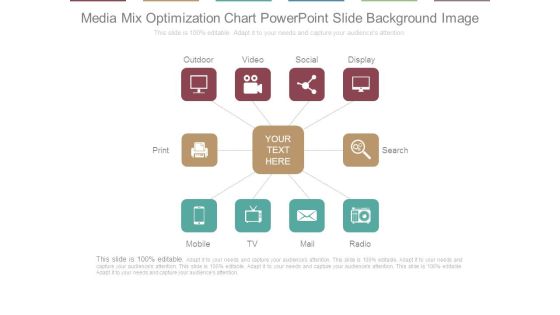
Media Mix Optimization Chart Powerpoint Slide Background Image
This is a media mix optimization chart powerpoint slide background image. This is a ten stage process. The stages in this process are outdoor, video, social, display, search, radio, mail, tv, mobile, print.
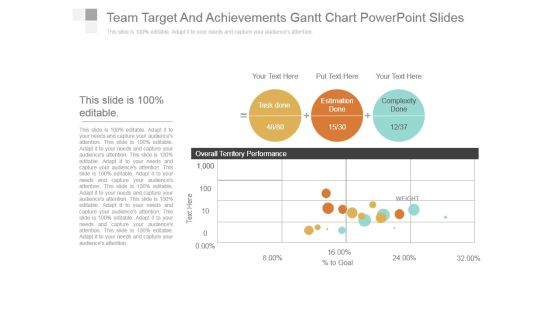
Team Target And Achievements Gantt Chart Powerpoint Slides
This is a team target and achievements gantt chart powerpoint slides. This is a three stage process. The stages in this process are task done, estimation done, complexity done, overall territory performance.
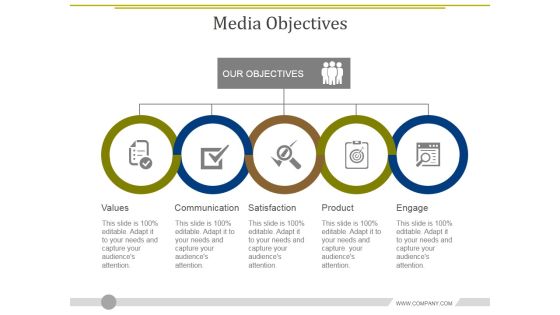
Media Objectives Template 2 Ppt PowerPoint Presentation Diagram Graph Charts
This is a media objectives template 2 ppt powerpoint presentation diagram graph charts. This is a five stage process. The stages in this process are values, communication, satisfaction, product, engage.
Management Organizational Chart Ppt PowerPoint Presentation Portfolio Icon
This is a management organizational chart ppt powerpoint presentation portfolio icon. This is a three stage process. The stages in this process are tony williams, bill durbin, david johnson, robert fowler, kate jeter.


 Continue with Email

 Home
Home


