Board Of Director Chart

Column Chart Sample Budget Ppt Ppt PowerPoint Presentation Infographics Brochure
This is a column chart sample budget ppt ppt powerpoint presentation infographics brochure. This is a two stage process. The stages in this process are business, management, strategy, analysis, marketing.

Bubble Chart Marketing Business Ppt PowerPoint Presentation Model Sample
This is a bubble chart marketing business ppt powerpoint presentation model sample. This is a two stage process. The stages in this process are finance, business, management, strategy, analysis.
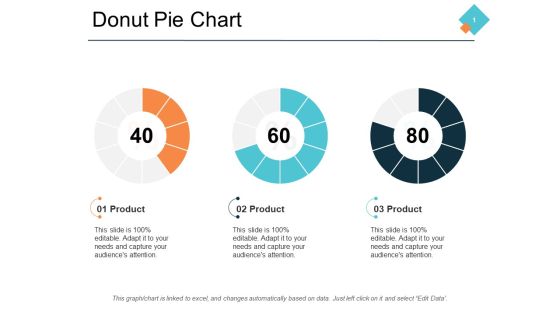
Donut Pie Chart Finance Ppt PowerPoint Presentation Portfolio Model
This is a donut pie chart finance ppt powerpoint presentation portfolio model. This is a three stage process. The stages in this process are finance, management, strategy, analysis, marketing.

Area Chart Finance Ppt PowerPoint Presentation Infographic Template Model
This is a area chart finance ppt powerpoint presentation infographic template model. This is a two stage process. The stages in this process are finance, marketing, management, investment, analysis.

Column Chart And Graph Ppt PowerPoint Presentation File Introduction
This is a column chart and graph ppt powerpoint presentation file introduction. This is a three stage process. The stages in this process are finance, marketing, management, investment, analysis.

Area Chart Finance Ppt PowerPoint Presentation Infographic Template Graphics Template
This is a area chart finance ppt powerpoint presentation infographic template graphics template. This is a two stage process. The stages in this process are finance, marketing, management, investment, analysis.

Combo Chart Finance Ppt PowerPoint Presentation Summary Design Ideas
This is a combo chart finance ppt powerpoint presentation summary design ideas. This is a three stage process. The stages in this process are finance, marketing, management, investment, analysis.

Donut Pie Chart Graph Ppt PowerPoint Presentation File Styles
This is a donut pie chart graph ppt powerpoint presentation file styles. This is a three stage process. The stages in this process are finance, marketing, management, investment, analysis.

Donut Pie Chart Graph Ppt PowerPoint Presentation Ideas Guidelines
This is a donut pie chart graph ppt powerpoint presentation ideas guidelines. This is a three stage process. The stages in this process are finance, marketing, management, investment, analysis.
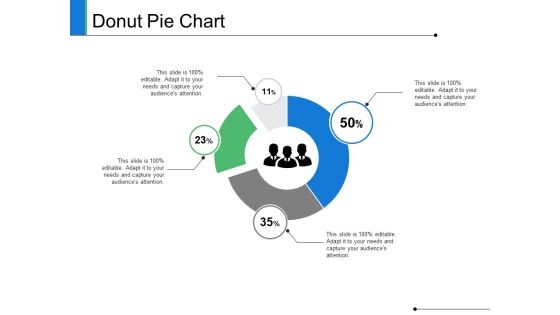
Donut Pie Chart Finance Ppt PowerPoint Presentation Styles Deck
This is a donut pie chart finance ppt powerpoint presentation styles deck. This is a four stage process. The stages in this process are finance, marketing, management, investment, analysis.
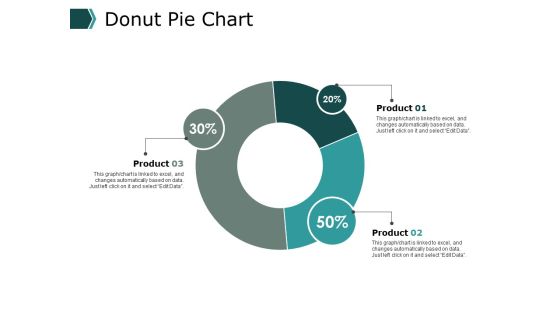
Donut Pie Chart Finance Ppt PowerPoint Presentation File Slide Download
This is a donut pie chart finance ppt powerpoint presentation file slide download. This is a three stage process. The stages in this process are finance, marketing, management, investment, analysis.

Donut Pie Chart Finance Ppt PowerPoint Presentation Styles Summary
This is a donut pie chart finance ppt powerpoint presentation styles summary. This is a three stage process. The stages in this process are finance, marketing, management, investment, analysis.
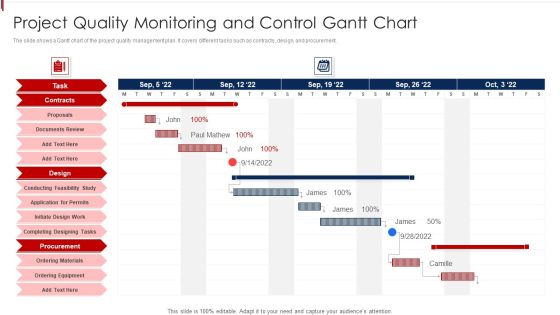
Project Quality Monitoring And Control Gantt Chart Clipart PDF
The slide shows a Gantt chart of the project quality management plan. It covers different tasks such as contracts, design, and procurement. Introducing our Project Quality Monitoring And Control Gantt Chart Clipart PDF that is designed to showcase some of the vital components that will help you create timelines, roadmaps, and project plans. In addition, also communicate your project durations, milestones, tasks, subtasks, dependencies, and other attributes using this well structured Project Quality Monitoring And Control Gantt Chart Clipart PDF template. You can also exhibit preeminence against time by deploying this easily adaptable slide to your business presentation. Our experts have designed this template in such a way that it is sure to impress your audience. Thus, download it and steer your project meetings, meetups, and conferences.

Application Lifecycle Management ALM Change Management Gantt Chart Topics PDF
Presenting this set of slides with name application lifecycle management alm change management gantt chart topics pdf. The topics discussed in these slides are procurement, deployment, maintenance, security. This is a completely editable PowerPoint presentation and is available for immediate download. Download now and impress your audience.
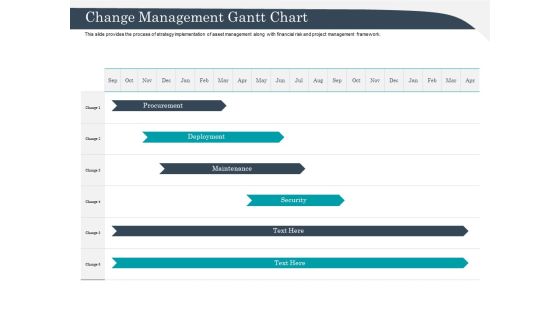
Strategic Management Of Assets Change Management Gantt Chart Mockup PDF
Presenting this set of slides with name strategic management of assets change management gantt chart mockup pdf. The topics discussed in these slides are procurement, deployment, maintenance, security. This is a completely editable PowerPoint presentation and is available for immediate download. Download now and impress your audience.

PMP Process Chart With Progress Groups Ppt Pictures Deck PDF
Following slide displays project management process chart along with the details about progress groups namely initiating, planning, executing, monitoring and controlling and closing. Deliver an awe inspiring pitch with this creative pmp process chart with progress groups ppt pictures deck pdf bundle. Topics like management, integration, schedule can be discussed with this completely editable template. It is available for immediate download depending on the needs and requirements of the user.

Real Estate Pie Chart Infographic Ppt PowerPoint Presentation Portfolio
This is a real estate pie chart infographic ppt powerpoint presentation portfolio. This is a four stage process. The stages in this process are circular, business, icons, marketing, process.

Donut Pie Chart Ppt PowerPoint Presentation Pictures Infographic Template
This is a donut pie chart ppt powerpoint presentation pictures infographic template. This is a three stage process. The stages in this process are product, business, marketing, icons, process.

Customer Plan Comparison Chart Ppt Powerpoint Presentation Infographic Template Portrait
This is a customer plan comparison chart ppt powerpoint presentation infographic template portrait. This is a four stage process. The stages in this process are customer service strategy, customer service plan, customer service approach.

Stacked Bar Chart Ppt PowerPoint Presentation Inspiration Ideas
This is a stacked bar chart ppt powerpoint presentation inspiration ideas. This is a four stage process. The stages in this process are product, highest, business, marketing, bar graph.

Competitive Analysis Matrix Chart Ppt PowerPoint Presentation Portfolio Format Ideas
This is a competitive analysis matrix chart ppt powerpoint presentation portfolio format ideas. This is a six stage process. The stages in this process are our business, product quality, product fidelity, after sales service, customer service.

Scatter Bubble Chart Ppt PowerPoint Presentation Inspiration Backgrounds
This is a scatter bubble chart ppt powerpoint presentation inspiration backgrounds. This is a five stage process. The stages in this process are highest sale, in price, business, marketing, success.

Area Chart Ppt PowerPoint Presentation Layouts Graphics Example
This is a area chart ppt powerpoint presentation layouts graphics example. This is a two stage process. The stages in this process are sales in percentage, financial year, business, marketing, presentation.
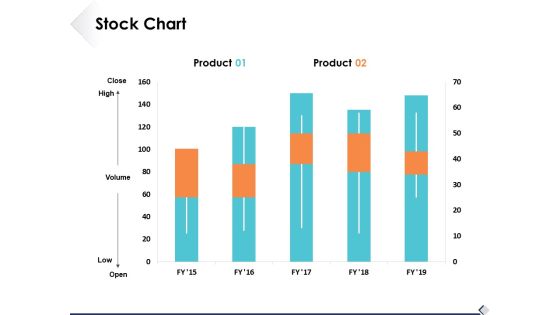
Stock Chart Finance Ppt PowerPoint Presentation Styles Background Image
This is a stock chart finance ppt powerpoint presentation styles background image. This is a two stage process. The stages in this process are analysis, marketing, icons, finance, strategy.

Donut Pie Chart Ppt PowerPoint Presentation Ideas Design Templates
This is a donut pie chart ppt powerpoint presentation ideas design templates. This is a four stage process. The stages in this process are analysis finance, investment, business, planning, marketing.

Task Based Recognition Chart Ppt PowerPoint Presentation Inspiration Vector
This is a task based recognition chart ppt powerpoint presentation inspiration vector. This is a two stage process. The stages in this process are business, planning, strategy, detail, particular.

Five Column Chart For Business Review Ppt PowerPoint Presentation Diagrams
This is a five column chart for business review ppt powerpoint presentation diagrams. This is a five stage process. The stages in this process are business, marketing, bulb, icon, management.

International Collaboration Chart For Strategic Alliance Management Structure PDF
Presenting international collaboration chart for strategic alliance management structure pdf to dispense important information. This template comprises four stages. It also presents valuable insights into the topics including stakeholder, competency skill, goals clarity. This is a completely customizable PowerPoint theme that can be put to use immediately. So, download it and address the topic impactfully.

PowerPoint Presentation Process Layout Business Flow Chart Slides
We present our powerpoint presentation process layout business flow chart Slides.Use our Marketing PowerPoint Templates because networking is an imperative in todays world. You need to access the views of others. Similarly you need to give access to them of your abilities. Use our Leadership PowerPoint Templates because there are so many different pieces to the puzzle. Present our Business PowerPoint Templates because you have selected your team man for man. Download our Shapes PowerPoint Templates because it can bring your ideas to the fore so that all around can know. Dissect each idea to the core and select the best. Use our Arrows PowerPoint Templates because it is all there in bits and pieces.Use these PowerPoint slides for presentations relating to Abstract, Arrow, Arrows, Business, Chart, Design, Development, Diagram, Direction, Element, Flow, Flowchart, Graph, Linear, Management, Model, Motion, Organization, Plan, Process, Program, Section, Segment, Set, Sign, Solution, Strategy, Symbol, Technology,,. The prominent colors used in the PowerPoint template are White, Green, Gray. PowerPoint presentation experts tell us our powerpoint presentation process layout business flow chart Slides are Enchanting. Customers tell us our Chart PowerPoint templates and PPT Slides are Elevated. Use our powerpoint presentation process layout business flow chart Slides are Spectacular. Use our Arrows PowerPoint templates and PPT Slides are Dazzling. We assure you our powerpoint presentation process layout business flow chart Slides are Zippy. People tell us our Chart PowerPoint templates and PPT Slides are Stylish.

Circular Chart Showing Process Approach Ppt PowerPoint Presentation Backgrounds
This is a circular chart showing process approach ppt powerpoint presentation backgrounds. This is a four stage process. The stages in this process are process approach, business, marketing, success, strategy.

Team Target And Achievements Scatter Chart Ppt PowerPoint Presentation Example
This is a team target and achievements scatter chart ppt powerpoint presentation example. This is a three stage process. The stages in this process are overall territory performance, task done, estimation done, complexity done.

Competitive Analysis Template 6 Scatter Chart Ppt PowerPoint Presentation Shapes
This is a competitive analysis template 6 scatter chart ppt powerpoint presentation shapes. This is a one stage process. The stages in this process are users interface, data import, example, pricing, support update, tutorials, easy to use.

Competitive Analysis Template 8 Matrix Chart Ppt PowerPoint Presentation Templates
This is a competitive analysis template 8 matrix chart ppt powerpoint presentation templates. This is a six stage process. The stages in this process are our business, product quality, product fidelity, after sales service, customer service, price, shipping speed, competitor.

Competitive Analysis Matrix Chart Ppt PowerPoint Presentation Gallery
This is a competitive analysis matrix chart ppt powerpoint presentation gallery. This is a seven stage process. The stages in this process are our business, product quality, product fidelity, after sales service, customer service, price, shipping speed.
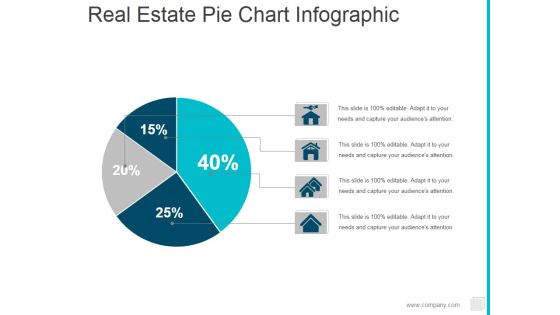
Real Estate Pie Chart Infographic Ppt PowerPoint Presentation Ideas Shapes
This is a real estate pie chart infographic ppt powerpoint presentation ideas shapes. This is a four stage process. The stages in this process are pie, finance, marketing, percentage.

Basic Gap Analysis Chart Ppt PowerPoint Presentation Pictures Design Ideas
This is a basic gap analysis chart ppt powerpoint presentation pictures design ideas. This is a five stage process. The stages in this process are business, finance, marketing, analysis, investment.

Line Chart Ppt Powerpoint Presentation Infographic Template Format
This is a line chart ppt powerpoint presentation infographic template format. This is a two stage process. The stages in this process are jan, feb, mar, apr, may, financial.

Scatter Bubble Chart Ppt PowerPoint Presentation Professional Model
This is a scatter bubble chart ppt powerpoint presentation professional model. This is a six stage process. The stages in this process are sales in profit, financial year, growth, business, marketing, strategy.

Donut Pie Chart Ppt PowerPoint Presentation Inspiration Background Image
This is a donut pie chart ppt powerpoint presentation inspiration background image. This is a three stage process. The stages in this process are product, percentage, business, marketing, process.

Pie Chart Finance Ppt PowerPoint Presentation Styles Graphics Template
This is a pie chart finance ppt powerpoint presentation styles graphics template. This is a three stage process. The stages in this process are financial, minimum, medium, maximum, marketing.

Combo Chart Graph Ppt PowerPoint Presentation Gallery Designs Download
This is a combo chart graph ppt powerpoint presentation gallery designs download. This is a three stage process. The stages in this process are finance, marketing, analysis, investment, million.
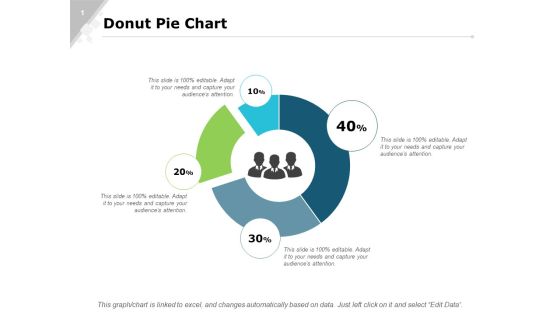
Donut Pie Chart Bar Ppt PowerPoint Presentation Infographics Slide Portrait
This is a donut pie chart bar ppt powerpoint presentation infographics slide portrait. This is a four stage process. The stages in this process are finance, marketing, analysis, investment, million.

Area Chart Graph Ppt PowerPoint Presentation Professional Format Ideas
This is a column chart graph ppt powerpoint presentation slides file formats. This is a stage three process. The stages in this process are finance, marketing, analysis, investment, million.

Vehicle Management System Process Flow Chart Introduction PDF
This slide represents the flow chart for effectively tracking and managing activities of vehicles such as trucks, cards and construction equipment. It starts with planning, dispatching end ends with control unit and user interface. Showcasing this set of slides titled Vehicle Management System Process Flow Chart Introduction PDF. The topics addressed in these templates are Central Computer, Communication Device, Data Logging. All the content presented in this PPT design is completely editable. Download it and make adjustments in color, background, font etc. as per your unique business setting.

Competitive Analysis Bubble Chart Ppt PowerPoint Presentation Pictures Mockup
This is a competitive analysis bubble chart ppt powerpoint presentation pictures mockup. This is a six stage process. The stages in this process are product, table, business, marketing, management.

Emotional Investing Chart Ppt PowerPoint Presentation Portfolio Model Cpb Pdf
Presenting this set of slides with name emotional investing chart ppt powerpoint presentation portfolio model cpb pdf. This is an editable Powerpoint one stages graphic that deals with topics like emotional investing chart to help convey your message better graphically. This product is a premium product available for immediate download and is 100 percent editable in Powerpoint. Download this now and use it in your presentations to impress your audience.

Companies Comparison Chart Vector Icon Ppt PowerPoint Presentation Files PDF
Persuade your audience using this companies comparison chart vector icon ppt powerpoint presentation files pdf. This PPT design covers one stages, thus making it a great tool to use. It also caters to a variety of topics including companies comparison chart vector icon. Download this PPT design now to present a convincing pitch that not only emphasizes the topic but also showcases your presentation skills.
Hierarchy Chart Organizational Structure Ppt PowerPoint Presentation Icon Guide Cpb
Presenting this set of slides with name hierarchy chart organizational structure ppt powerpoint presentation icon guide cpb. This is an editable Powerpoint four stages graphic that deals with topics like hierarchy chart organizational structure to help convey your message better graphically. This product is a premium product available for immediate download and is 100 percent editable in Powerpoint. Download this now and use it in your presentations to impress your audience.

Economic Cooperation And Development Chart Powerpoint Slide Themes
This is a economic cooperation and development chart powerpoint slide themes. This is a five stage process. The stages in this process are partnership, participation, consultation, communication, identify, stakeholders.

Gantt Chart For Stock Management Approach Slides PDF
This slide showcases gantt. chart that can help organization to track key milestones that are organizing and placing the order, order arrivals plus itinerary updates. It showcases progress for a period of three weeks. Pitch your topic with ease and precision using this Gantt Chart For Stock Management Approach Slides PDF. This layout presents information on Make Preliminary, Receive Approval, Arrived Accordingly. It is also available for immediate download and adjustment. So, changes can be made in the color, design, graphics or any other component to create a unique layout.

Project Chart Ppt PowerPoint Presentation Ideas Design Ideas Cpb
Presenting this set of slides with name project chart ppt powerpoint presentation ideas design ideas cpb. This is an editable Powerpoint four stages graphic that deals with topics like project chart to help convey your message better graphically. This product is a premium product available for immediate download and is 100 percent editable in Powerpoint. Download this now and use it in your presentations to impress your audience.
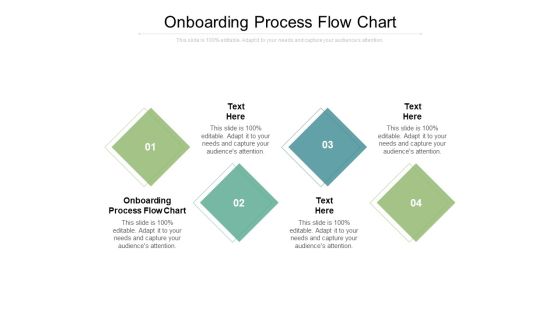
Onboarding Process Flow Chart Ppt PowerPoint Presentation Professional Inspiration Cpb
Presenting this set of slides with name onboarding process flow chart ppt powerpoint presentation professional inspiration cpb. This is an editable Powerpoint four stages graphic that deals with topics like onboarding process flow chart to help convey your message better graphically. This product is a premium product available for immediate download and is 100 percent editable in Powerpoint. Download this now and use it in your presentations to impress your audience.

Compare Multiple Stock Chart Ppt PowerPoint Presentation Inspiration Layout Cpb
Presenting this set of slides with name compare multiple stock chart ppt powerpoint presentation inspiration layout cpb. This is an editable Powerpoint four stages graphic that deals with topics like compare multiple stock chart to help convey your message better graphically. This product is a premium product available for immediate download and is 100 percent editable in Powerpoint. Download this now and use it in your presentations to impress your audience.
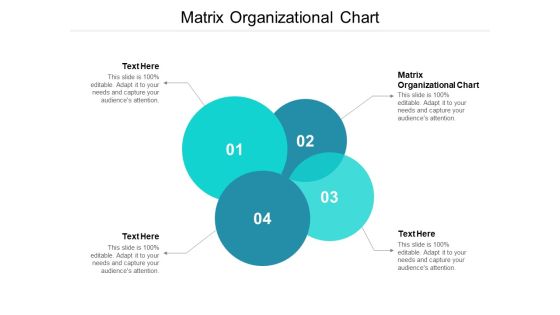
Matrix Organizational Chart Ppt PowerPoint Presentation Model Inspiration Cpb
Presenting this set of slides with name matrix organizational chart ppt powerpoint presentation model inspiration cpb. This is an editable Powerpoint four stages graphic that deals with topics like matrix organizational chart to help convey your message better graphically. This product is a premium product available for immediate download and is 100 percent editable in Powerpoint. Download this now and use it in your presentations to impress your audience.
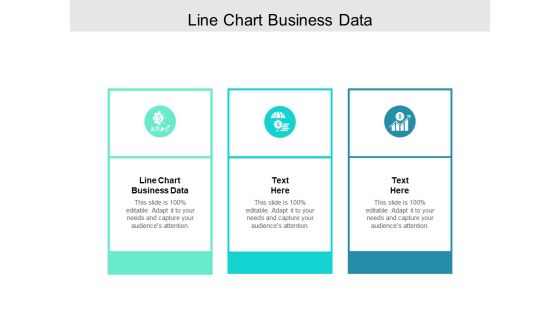
Line Chart Business Data Ppt PowerPoint Presentation Styles Layout Cpb
Presenting this set of slides with name line chart business data ppt powerpoint presentation styles layout cpb. This is an editable Powerpoint three stages graphic that deals with topics like line chart business data to help convey your message better graphically. This product is a premium product available for immediate download and is 100 percent editable in Powerpoint. Download this now and use it in your presentations to impress your audience.

Break Even Analysis Chart Ppt PowerPoint Presentationmodel Brochure Cpb
Presenting this set of slides with name break even analysis chart ppt powerpoint presentationmodel brochure cpb. This is an editable Powerpoint five stages graphic that deals with topics like break even analysis chart to help convey your message better graphically. This product is a premium product available for immediate download and is 100 percent editable in Powerpoint. Download this now and use it in your presentations to impress your audience.

Compatibility Chart Ppt PowerPoint Presentation Summary Example File Cpb
Presenting this set of slides with name compatibility chart ppt powerpoint presentation summary example file cpb. This is an editable Powerpoint five stages graphic that deals with topics like compatibility chart to help convey your message better graphically. This product is a premium product available for immediate download and is 100 percent editable in Powerpoint. Download this now and use it in your presentations to impress your audience.
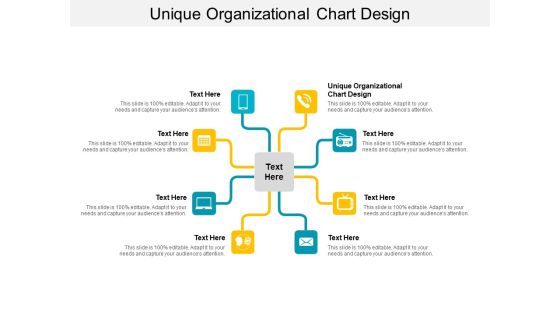
Unique Organizational Chart Design Ppt PowerPoint Presentation Background Cpb
Presenting this set of slides with name unique organizational chart design ppt powerpoint presentation background cpb. This is an editable Powerpoint eght stages graphic that deals with topics like unique organizational chart design to help convey your message better graphically. This product is a premium product available for immediate download and is 100 percent editable in Powerpoint. Download this now and use it in your presentations to impress your audience.

Activity Relationship Chart Ppt PowerPoint Presentation Professional Background Cpb Pdf
Presenting this set of slides with name activity relationship chart ppt powerpoint presentation professional background cpb pdf. This is an editable Powerpoint six stages graphic that deals with topics like activity relationship chart to help convey your message better graphically. This product is a premium product available for immediate download and is 100 percent editable in Powerpoint. Download this now and use it in your presentations to impress your audience.

Cost Curve Chart Ppt PowerPoint Presentation Portfolio Pictures Cpb Pdf
Presenting this set of slides with name cost curve chart ppt powerpoint presentation portfolio pictures cpb pdf. This is an editable Powerpoint four stages graphic that deals with topics like cost curve chart to help convey your message better graphically. This product is a premium product available for immediate download and is 100 percent editable in Powerpoint. Download this now and use it in your presentations to impress your audience.
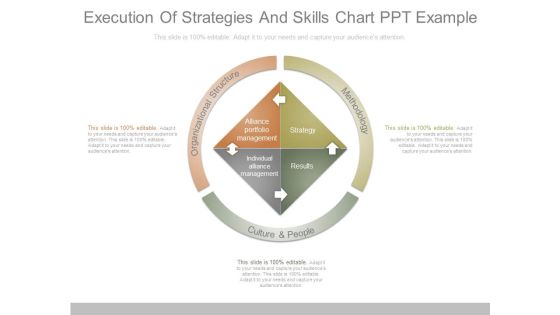
Execution Of Strategies And Skills Chart Ppt Example
This is a execution of strategies and skills chart ppt example. This is a three stage process. The stages in this process are methodology, culture and people, organizational structure, alliance portfolio management, strategy, individual alliance management, results.

Small Business Structure Chart Example Powerpoint Slide Background Image
This is a small business structure chart example powerpoint slide background image. This is a six stage process. The stages in this process are financial manager, sales, distributions, finance, operations, general manager.
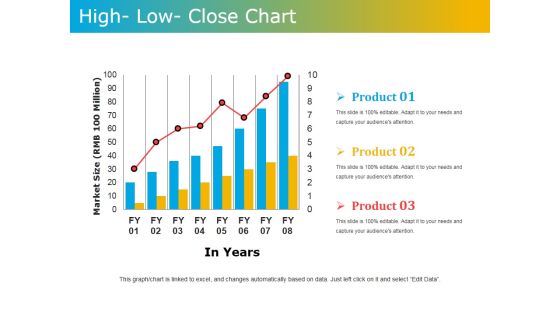
High Low Close Chart Ppt PowerPoint Presentation Model Graphics Tutorials
This is a high low close chart ppt powerpoint presentation model graphics tutorials. This is a three stage process. The stages in this process are market size, in years, product.

Bar Chart Ppt PowerPoint Presentation Infographic Template Skills
This is a bar chart ppt powerpoint presentation infographic template skills. This is a nine stage process. The stages in this process are sales in percentage, finance, business, marketing, strategy, success.

Flow Chart Plan For Client Project Communication Download PDF
This slide presents a flow chart plan that can be used by managers for streamlining project communication among customers. Major elements include monthly status reports, monthly analytics, weekly analytics, etc. Presenting Flow Chart Plan For Client Project Communication Download PDF to dispense important information. This template comprises one stages. It also presents valuable insights into the topics including Flow Chart Plan, Client Project Communication. This is a completely customizable PowerPoint theme that can be put to use immediately. So, download it and address the topic impactfully.
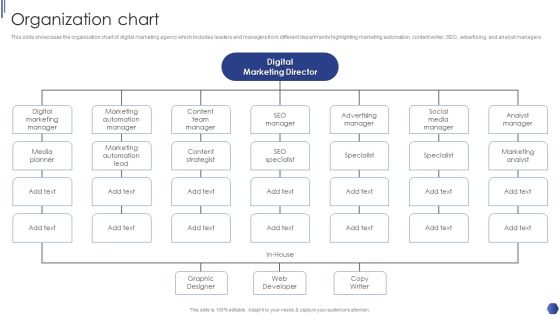
Digital Marketing Agency Business Profile Organization Chart Elements PDF
This slide showcases the organization chart of digital marketing agency which includes leaders and managers from different departments highlighting marketing automation, content writer, SEO, advertising, and analyst managers. Deliver and pitch your topic in the best possible manner with this Digital Marketing Agency Business Profile Organization Chart Elements PDF. Use them to share invaluable insights on Content Team Manager, Marketing Automation Manager, Digital Marketing Manager and impress your audience. This template can be altered and modified as per your expectations. So, grab it now.
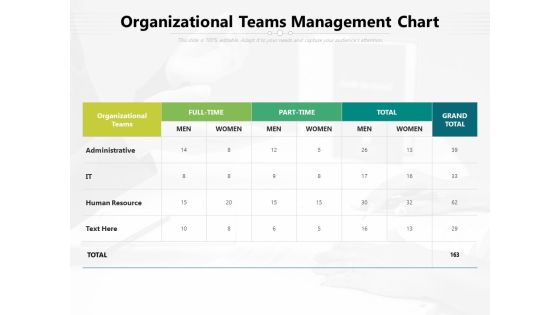
Organizational Teams Management Chart Ppt PowerPoint Presentation File Outline PDF
Presenting this set of slides with name organizational teams management chart ppt powerpoint presentation file outline pdf. The topics discussed in these slides are administrative, human resource, organizational teams. This is a completely editable PowerPoint presentation and is available for immediate download. Download now and impress your audience.

Comprehensive Solution Analysis Solution Assessment Criteria Analysis Chart Mockup PDF
This slide shows the solution assessment criteria analysis chart whose purpose is to evaluate the options available for a particular solution based on management receptivity, degree of risk and feasibility, solution cost etc.. along with the total score of each solution. This is a comprehensive solution analysis solution assessment criteria analysis chart mockup pdf template with various stages. Focus and dispense information on one stage using this creative set, that comes with editable features. It contains large content boxes to add your information on topics like solution assessment criteria analysis chart. You can also showcase facts, figures, and other relevant content using this PPT layout. Grab it now.
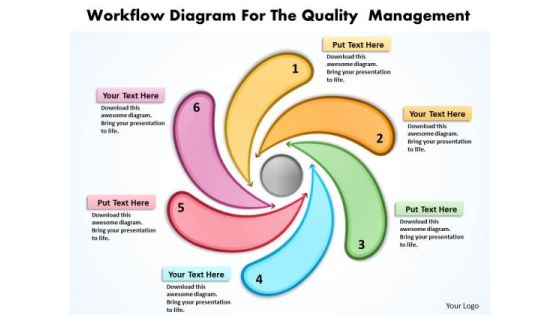
Workflow Diagram For The Quality Management Radial Chart PowerPoint Templates
We present our workflow diagram for the quality management Radial Chart PowerPoint templates.Present our Marketing PowerPoint Templates because Our PowerPoint Templates and Slides will let Your superior ideas hit the target always and everytime. Download and present our Business PowerPoint Templates because infrastructure growth is an obvious requirement of today.inform your group on how exactly this potential is tailor made for you. Download our Shapes PowerPoint Templates because you should Demonstrate how you think out of the box. Use our Finance PowerPoint Templates because you can see clearly through to the bigger bowl ahead. Time your jump to perfection and hit the nail on the head. Use our Symbol PowerPoint Templates because you can see In any endeavour people matter most.Use these PowerPoint slides for presentations relating to Arrow, Art, Business, Chart, Design, Development, Diagram, Flow, Flowchart, Graphic, Gray, Idea, Info, Management, Method, Model, Process, Quality, Rainbow, Research, Sign, Software, Strategy, Success, System, Template, Text, Vector, Work. The prominent colors used in the PowerPoint template are Red, Blue, Yellow. We assure you our workflow diagram for the quality management Radial Chart PowerPoint templates are incredible easy to use. Customers tell us our Flow PowerPoint templates and PPT Slides will make the presenter successul in his career/life. The feedback we get is that our workflow diagram for the quality management Radial Chart PowerPoint templates effectively help you save your valuable time. We assure you our Chart PowerPoint templates and PPT Slides are Splendid. People tell us our workflow diagram for the quality management Radial Chart PowerPoint templates are Classic. We assure you our Diagram PowerPoint templates and PPT Slides are Fabulous.

IT Software Web Development Gantt Chart Topics PDF
This slide presents a Gantt chart highlighting various phases of website design plan to help project managers deliver the project on time. It includes phases such as project definition, content, design, development and review. Pitch your topic with ease and precision using this IT Software Web Development Gantt Chart Topics PDF. This layout presents information on Chart, Software, Development. It is also available for immediate download and adjustment. So, changes can be made in the color, design, graphics or any other component to create a unique layout.

Gantt Chart For Business Promotion Activities Sample PDF
Design a highly optimized project management report using this well-researched gantt chart for business promotion activities sample pdf. This layout can be used to present the professional details of a task or activity. Showcase the activities allocated to the business executives with this Gantt Chart PowerPoint theme. List down the column tasks in various timeframes and allocate time for each. In addition, also monitor the actual time and make comparisons to interpret the final progress using this innovative Gantt Chart Template. Showcase the work breakdown structure to attract your audience. Download and share it using Google Slides, if it suits your requirement.

Project Gantt Chart Showing Design Blueprint Rules PDF
Design a highly optimized project management report using this well-researched project gantt chart showing design blueprint rules pdf. This layout can be used to present the professional details of a task or activity. Showcase the activities allocated to the business executives with this Gantt Chart PowerPoint theme. List down the column tasks in various timeframes and allocate time for each. In addition, also monitor the actual time and make comparisons to interpret the final progress using this innovative Gantt Chart Template. Showcase the work breakdown structure to attract your audience. Download and share it using Google Slides, if it suits your requirement.
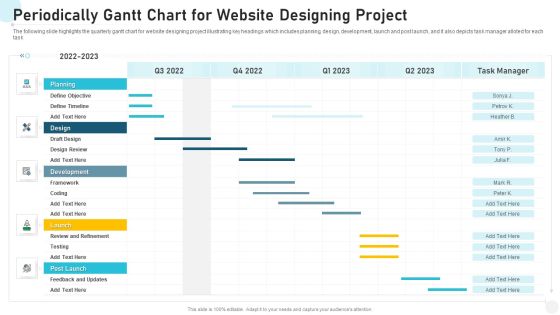
Periodically Gantt Chart For Website Designing Project Portrait PDF
The following slide highlights the quarterly gantt chart for website designing project illustrating key headings which includes planning, design, development, launch and post launch, and it also depicts task manager alloted for each task Showcasing this set of slides titled periodically gantt chart for website designing project portrait pdf. The topics addressed in these templates are periodically gantt chart for website designing project. All the content presented in this PPT design is completely editable. Download it and make adjustments in color, background, font etc. as per your unique business setting.

Scatter Bubble Chart Graph Ppt PowerPoint Presentation Infographic Template Maker
This is a scatter bubble chart graph ppt powerpoint presentation infographic template maker. This is a two stage process. The stages in this process are finance, marketing, management, investment, analysis.

Action Management Chart For Project Status Progress Background PDF
This slide exhibits project action planning chart illustrating action steps, goal, department responsible etc that helps organization to monitor and track project progress and take immediate required steps to make procedure more efficient. Showcasing this set of slides titled Action Management Chart For Project Status Progress Background PDF. The topics addressed in these templates are Web Development, Marketing, Resources Required. All the content presented in this PPT design is completely editable. Download it and make adjustments in color, background, font etc. as per your unique business setting.
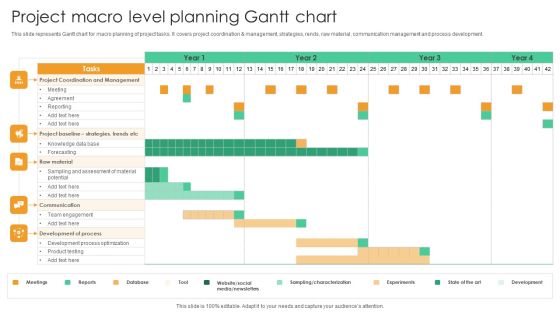
Project Macro Level Planning Gantt Chart Guidelines PDF
This slide represents Gantt chart for macro planning of project tasks. It covers project coordination and management, strategies, rends, raw material, communication management and process development. Pitch your topic with ease and precision using this Project Macro Level Planning Gantt Chart Guidelines PDF. This layout presents information on Project Coordination Management, Raw Material. It is also available for immediate download and adjustment. So, changes can be made in the color, design, graphics or any other component to create a unique layout.

Stacked Line Chart Finance Ppt Powerpoint Presentation Outline Themes
This is a stacked line chart finance ppt powerpoint presentation outline themes. This is a two stage process. The stages in this process are finance, marketing, management, investment, analysis.

Circular Arrow Chart With Business Icons Powerpoint Slides
Graphics of circular arrow chart with icons have been displayed in this business slide. This business diagram helps to exhibit strategy analysis and management. Use this PowerPoint template to visually support your content.

Cycle Chart Of Mutual Funds Sample Diagram Ppt Images
This is a cycle chart of mutual funds sample diagram ppt images. This is a five stage process. The stages in this process are reinvestment, returns, investors, fund manager, financial securities.

Four Employees Timeline Chart With Years Powerpoint Slides
This PowerPoint template has been designed with graphics of timeline with team pictures. You may download this timeline diagram slide to display team planning and management steps. Chart the course you intend to take with this slide.

Financial Planning Steps Infographic Chart Ppt Samples Download
This is a financial planning steps infographic chart ppt samples download. This is a five stage process. The stages in this process are investments, retirement, estate planning, risk management, cash flow.

Activity Planning Chart Ppt PowerPoint Presentation Visual Aids Model
This is a activity planning chart ppt powerpoint presentation visual aids model. This is a six stage process. The stages in this process are activities, business, management, table, planning.

Circular Chart Showing Business Plan Ppt PowerPoint Presentation Shapes
This is a circular chart showing business plan ppt powerpoint presentation shapes. This is a seven stage process. The stages in this process are business, marketing, arrows, process, management.
Six Steps Circular Chart With Icons Powerpoint Slides
This PowerPoint template has been designed with six steps circular chart with icons. This PPT slide may be used to display business and management functions. Download this slide to build unique presentation.

Cost Benefit Analysis Chart With Icons Powerpoint Layout
This is a cost benefit analysis chart with icons powerpoint layout. This is a two stage process. The stages in this process are balance scale, compare, business, marketing, management.

Combo Chart Marketing Analysis Ppt Powerpoint Presentation Pictures Icons
This is a combo chart marketing analysis ppt powerpoint presentation pictures icons. This is a three stage process. The stages in this process are finance, marketing, management, investment, analysis.

Clustered Bar Chart Finance Ppt Powerpoint Presentation Icon Graphics Template
This is a clustered bar chart finance ppt powerpoint presentation icon graphics template. This is a four stage process. The stages in this process are finance, marketing, management, investment, analysis.
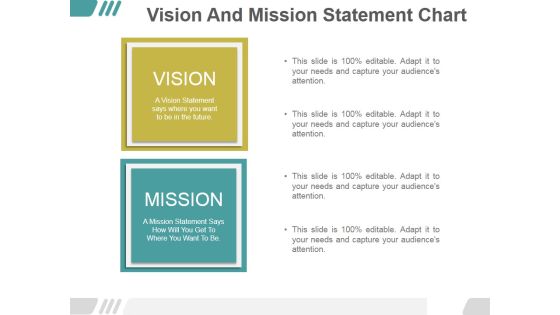
Vision And Mission Statement Chart Ppt PowerPoint Presentation Samples
This is a vision and mission statement chart ppt powerpoint presentation samples. This is a two stage process. The stages in this process are vision, business, marketing, mission, management.
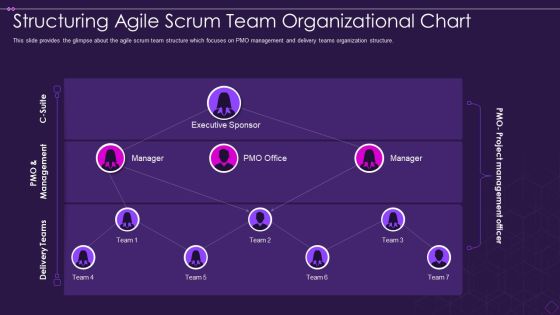
Structuring Agile Scrum Team Organizational Chart Ideas PDF
This slide provides the glimpse about the agile scrum team structure which focuses on PMO management and delivery teams organization structure. Deliver an awe inspiring pitch with this creative structuring agile scrum team organizational chart ideas pdf bundle. Topics like structuring agile scrum team organizational chart can be discussed with this completely editable template. It is available for immediate download depending on the needs and requirements of the user.
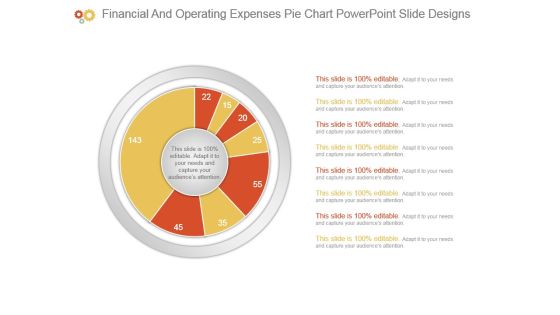
Financial And Operating Expenses Pie Chart Powerpoint Slide Designs
This is a financial and operating expenses pie chart powerpoint slide designs. This is a eight stage process. The stages in this process are business, diagram, marketing, management, presentation.
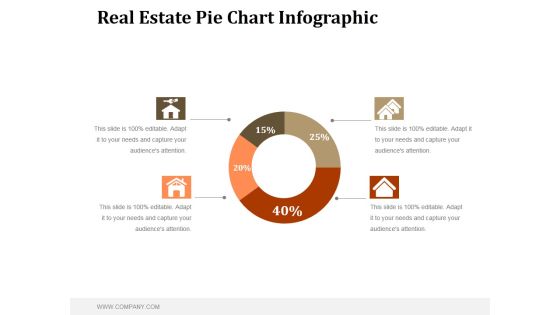
Real Estate Pie Chart Infographic Ppt PowerPoint Presentation Shapes
This is a real estate pie chart infographic ppt powerpoint presentation shapes. This is a four stage process. The stages in this process are business, marketing, management, finance, planning.

data collection and analysis flow chart ppt powerpoint presentation microsoft
This is a data collection and analysis flow chart ppt powerpoint presentation microsoft. This is a nine stage process. The stages in this process are business, planning, marketing, strategy, management.

Email Marketing Performance Chart Ppt Powerpoint Presentation Pictures Show
This is a email marketing performance chart ppt powerpoint presentation pictures show. This is a nine stage process. The stages in this process are finance, planning, marketing, business, management, strategy.
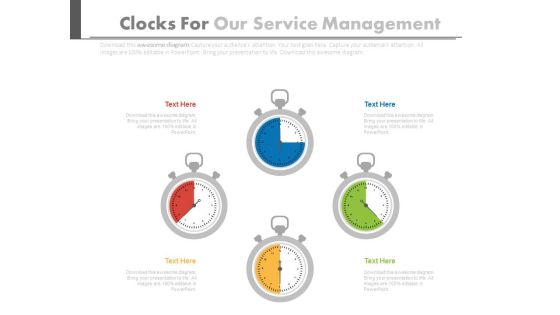
Four Stopwatches In Pie Chart Style Powerpoint Slides
This PPT slide has been designed with graphics of four stop watches in pie chart style. You may sue this PowerPoint template for time management. This dashboard slide may useful for multilevel status report creation and approval process.

Business Development Skills Business Development Skills Chart Slides
This is a business development skills business development skills chart slides. This is a eleven stage process. The stages in this process are entrepreneur, strategies, commercial, project, leadership, marketing, international, innovation, gestation, management, developer.

Strategy Development Fro Effective Market Chart Powerpoint Guide
This is a strategy development fro effective market chart powerpoint guide. This is a six stage process. The stages in this process are customers, leading distributors, other competitors, suppliers to the target, local provincial governments, associations institutions, target company management.
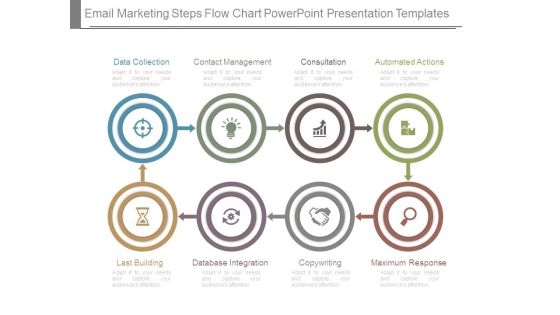
Email Marketing Steps Flow Chart Powerpoint Presentation Templates
This is a email marketing steps flow chart powerpoint presentation templates. This is a eight stage process. The stages in this process are data collection, contact management, consultation, automated actions, last building, database integration, copywriting, maximum response.
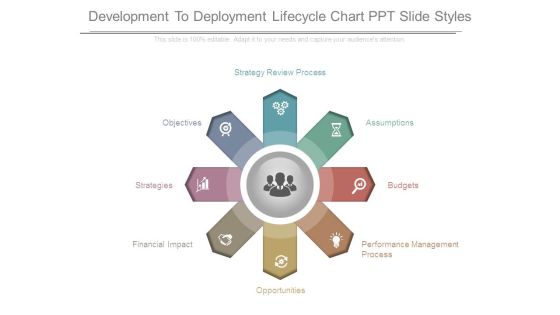
Development To Deployment Lifecycle Chart Ppt Slide Styles
This is a development to deployment lifecycle chart ppt slide styles. This is a eight stage process. The stages in this process are performance management process, opportunities, financial impact, strategies, objectives, strategy review process, assumptions, budgets.
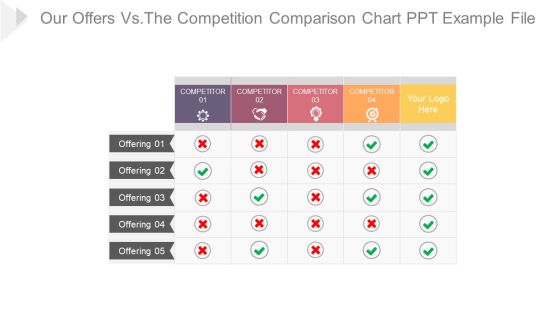
Our Offers Vs The Competition Comparison Chart Ppt Example File
This is a our offers vs the competition comparison chart ppt example file. This is a five stage process. The stages in this process are compare, table, management, business, strategy.

Column Chart Ppt PowerPoint Presentation Infographic Template Graphic Images
This is a column chart ppt powerpoint presentation infographic template graphic images. This is a nine stage process. The stages in this process are business, marketing, growth, product, management.
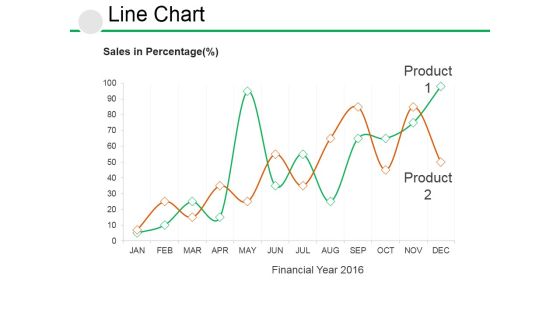
Line Chart Ppt PowerPoint Presentation Visual Aids Example File
This is a line chart ppt powerpoint presentation visual aids example file. This is a two stage process. The stages in this process are business, growth, strategy, analysis, management.
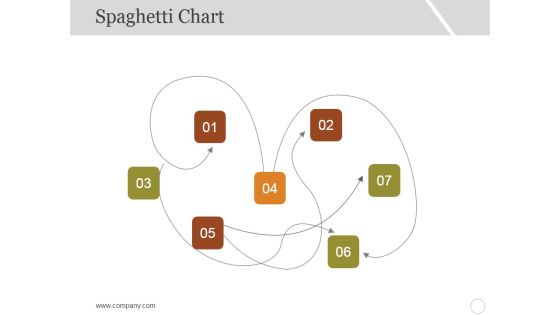
Spaghetti Chart Template 1 Ppt PowerPoint Presentation Slides Graphics Example
This is a spaghetti chart template 1 ppt powerpoint presentation slides graphics example. This is a seven stage process. The stages in this process are business, marketing, management, numbering.
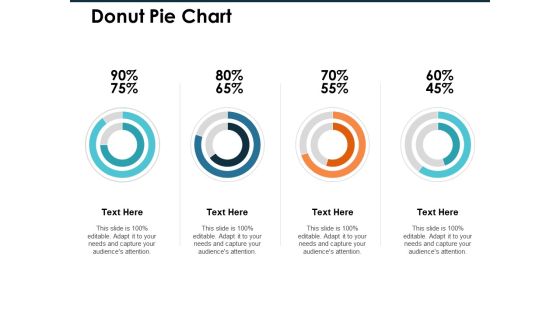
Donut Pie Chart Ppt PowerPoint Presentation Infographic Template Professional
This is a donut pie chart ppt powerpoint presentation infographic template professional. This is a four stage process. The stages in this process are finance, marketing, management, investment, analysis.
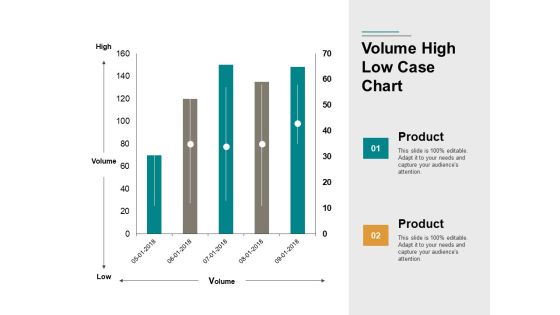
Volume High Low Case Chart Ppt PowerPoint Presentation Portfolio Images
This is a volume high low case chart ppt powerpoint presentation portfolio images. This is a two stage process. The stages in this process are finance, business, marketing, management.

Bubble Chart Finance Ppt PowerPoint Presentation File Master Slide
This is a bubble chart finance ppt powerpoint presentation file master slide. This is a three stage process. The stages in this process are finance, marketing, management, investment, analysis.

Volume High Low Close Chart Ppt PowerPoint Presentation Pictures Objects
This is a volume high low close chart ppt powerpoint presentation pictures objects. This is a one stage process. The stages in this process are finance, marketing, management, investment, analysis.
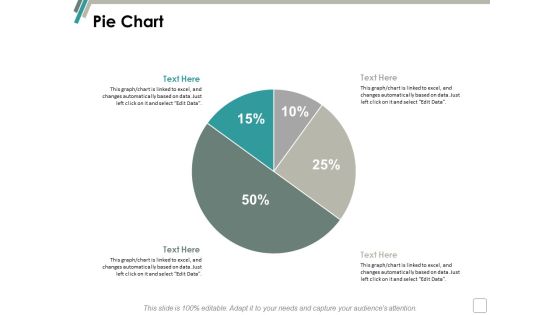
Pie Chart Finance Marketing Ppt Powerpoint Presentation Infographics Background
This is a pie chart finance marketing ppt powerpoint presentation infographics background. This is a two stage process. The stages in this process are finance, marketing, management, investment, analysis.

Volume High Low Close Chart Ppt Powerpoint Presentation Slides Images
This is a volume high low close chart ppt powerpoint presentation slides images. This is a five stage process. The stages in this process are finance, marketing, management, investment, analysis.

Area Chart Finance Marketing Ppt Powerpoint Presentation Gallery Slides
This is a area chart finance marketing ppt powerpoint presentation gallery slides. This is a three stage process. The stages in this process are finance, marketing, management, investment, analysis.
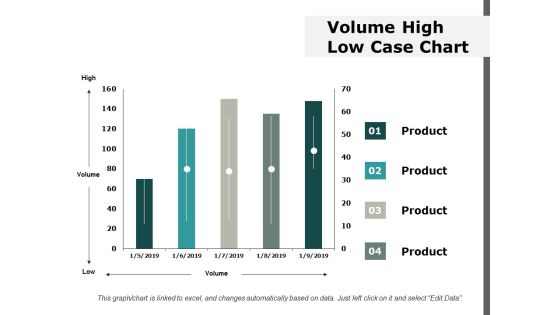
Volume High Low Case Chart Ppt Powerpoint Presentation Ideas Information
This is a volume high low case chart ppt powerpoint presentation ideas information. This is a four stage process. The stages in this process are finance, marketing, management, investment, analysis.

Scatter Chart Analysis Marketing Ppt Powerpoint Presentation Summary Infographic Template
This is a scatter chart analysis marketing ppt powerpoint presentation summary infographic template. This is a two stage process. The stages in this process are finance, marketing, management, investment, analysis.

Stacked Column Chart Analysis Ppt PowerPoint Presentation Slides Graphics Design
This is a stacked column chart analysis ppt powerpoint presentation slides graphics design. This is a three stage process. The stages in this process are finance, marketing, management, investment, analysis.

Bar Chart Finance Marketing Ppt Powerpoint Presentation Gallery Grid
This is a bar chart finance marketing ppt powerpoint presentation gallery grid. This is a three stage process. The stages in this process are finance, marketing, management, investment, analysis.

Donut Pie Chart Finance Ppt Powerpoint Presentation Outline Vector
This is a donut pie chart finance ppt powerpoint presentation outline vector. This is a four stage process. The stages in this process are finance, marketing, management, investment, analysis.

area chart finance ppt powerpoint presentation portfolio graphics download
This is a area chart finance ppt powerpoint presentation portfolio graphics download. This is a two stage process. The stages in this process are finance, marketing, management, investment, analysis.

Pie Chart Finance Ppt Powerpoint Presentation Layouts Design Ideas
This is a pie chart finance ppt powerpoint presentation layouts design ideas. This is a four stage process. The stages in this process are finance, marketing, management, investment, analysis.

Area Chart Finance Marketing Ppt Powerpoint Presentation Show Grid
This is a area chart finance marketing ppt powerpoint presentation show grid. This is a three stage process. The stages in this process are finance, marketing, management, investment, analysis.

Pie Chart Finance Ppt PowerPoint Presentation Infographics Mockup
This is a pie chart finance ppt powerpoint presentation infographics mockup . This is a four stage process. The stages in this process are finance, marketing, management, investment, analysis.

Combo Chart Marketing Ppt Powerpoint Presentation Ideas Format Ideas Cpb
This is a combo chart marketing ppt powerpoint presentation ideas format ideas cpb. This is a three stage process. The stages in this process are finance, marketing, management, investment, analysis.

Executing Operation Administration Project Flow Chart Clipart PDF
This slide shows the flowchart for carrying out an operation management project which assist in enhancing process standardization. It passes through various stages such as establishing project team, communication charts, quality check, etc. Presenting Executing Operation Administration Project Flow Chart Clipart PDF to dispense important information. This template comprises one stages. It also presents valuable insights into the topics including Executing Security, Establish Project Team. This is a completely customizable PowerPoint theme that can be put to use immediately. So, download it and address the topic impactfully.
 Home
Home