Barometer

Flowchart Indicating Monitoring Financial Transactions Process In Banks Pictures PDF
This slide depicts transaction monitoring stages in AML anti money laundering It provides information about source, analysis, insight, action, report, analyzing, financial transaction, etc.Persuade your audience using this Flowchart Indicating Monitoring Financial Transactions Process In Banks Pictures PDF. This PPT design covers one stage, thus making it a great tool to use. It also caters to a variety of topics including Payment Matching Process, Cancelled Payment, Cancelled Payment. Download this PPT design now to present a convincing pitch that not only emphasizes the topic but also showcases your presentation skills.

Key Performance Indicators Of Staffing Data Download PDF
The following slide showcases most relevant KPIs that help to develop data driven recruitment policy. The KPIs included are time to hire, time to acceptance, retention rate, applications per job, cost per hire and applications per channel. Persuade your audience using this Key Performance Indicators Of Staffing Data Download PDF. This PPT design covers one stages, thus making it a great tool to use. It also caters to a variety of topics including Quality Based Recruitment, Cost, Applications Per Channel. Download this PPT design now to present a convincing pitch that not only emphasizes the topic but also showcases your presentation skills.

Five Warehouse Key Efficiency Management Indicators Analysis Table Demonstration PDF
This slide shows the table representing the key metrics for measurement of performance of warehouse system of an organization. It includes data related to five activities of receiving, put away, storage, order picking and shipping of products. Showcasing this set of slides titled Five Warehouse Key Efficiency Management Indicators Analysis Table Demonstration PDF. The topics addressed in these templates are Activity, Received, Storage. All the content presented in this PPT design is completely editable. Download it and make adjustments in color, background, font etc. as per your unique business setting.
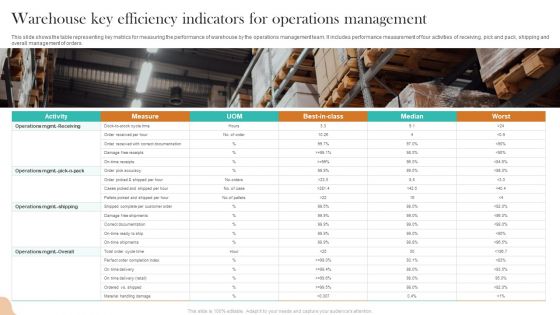
Warehouse Key Efficiency Indicators For Operations Management Slides PDF
This slide shows the table representing key metrics for measuring the performance of warehouse by the operations management team. It includes performance measurement of four activities of receiving, pick and pack, shipping and overall management of orders. Pitch your topic with ease and precision using this Warehouse Key Efficiency Indicators For Operations Management Slides PDF. This layout presents information on Operations Mgmt Shipping, Operations Mgmt. Receiving. It is also available for immediate download and adjustment. So, changes can be made in the color, design, graphics or any other component to create a unique layout.

Real Estate Business Sales Pipeline With Performance Indicators Background PDF
This slide showcases a sales funnel for real estate company to generate and acquire leads and maximize business profitability. It includes key components such as lead enters funnel, lead qualification, newsletter signup, schedule showing, negotiation, close, real estate deal won, etc. Presenting Real Estate Business Sales Pipeline With Performance Indicators Background PDF to dispense important information. This template comprises eight stages. It also presents valuable insights into the topics including Budget Preference, Newsletter Signup, Real Estate Deal Won. This is a completely customizable PowerPoint theme that can be put to use immediately. So, download it and address the topic impactfully.
Key Performance Indicators For Tracking Social Media Strategy Elements PDF
This slide presents multiple KPIs used to track progress of social media strategy helpful in checking content progress. Total reach, total subscribers, social shares, bounce rate and conversion rate are important in tracking the growth of brand and branded content. Pitch your topic with ease and precision using this Key Performance Indicators For Tracking Social Media Strategy Elements PDF. This layout presents information on Community Growth Kpis, Engagement Rate Kpis, Product Advertisement. It is also available for immediate download and adjustment. So, changes can be made in the color, design, graphics or any other component to create a unique layout.

Key Performance Indicators For Fulfilment Strategy Slides PDF
The following slide displays major obstacles faced by organizations in shipping and fulfilling orders received. It includes information about supply chain issues, seasonal and international fulfilment and inventory management. Persuade your audience using this Key Performance Indicators For Fulfilment Strategy Slides PDF. This PPT design covers six stages, thus making it a great tool to use. It also caters to a variety of topics including Transportation Costs, Picking Accuracy, Order Accuracy. Download this PPT design now to present a convincing pitch that not only emphasizes the topic but also showcases your presentation skills.

Process Flow Indicating Devops Project Administration Integration Microsoft PDF
This slide describes process flow for integration of DevOps methodology in project management. It provides information about control server, changes, developer, success, failure, test, development, etc. Presenting Process Flow Indicating Devops Project Administration Integration Microsoft PDF to dispense important information. This template comprises three stages. It also presents valuable insights into the topics including Server For Regular Integration, Source Control Server, Record Changes. This is a completely customizable PowerPoint theme that can be put to use immediately. So, download it and address the topic impactfully.

Logistics Management Dashboard With Monthly Key Performance Indicators Rules PDF
This slide showcases status dashboard for shipping that can help organization to calculate accurate shipping information and identify latest tracking updates. Its key components are order status, volume today, global financial performance, inventory and monthly KPIs. Pitch your topic with ease and precision using this Logistics Management Dashboard With Monthly Key Performance Indicators Rules PDF. This layout presents information on Orders, Inventory, Kpis Monthly. It is also available for immediate download and adjustment. So, changes can be made in the color, design, graphics or any other component to create a unique layout.
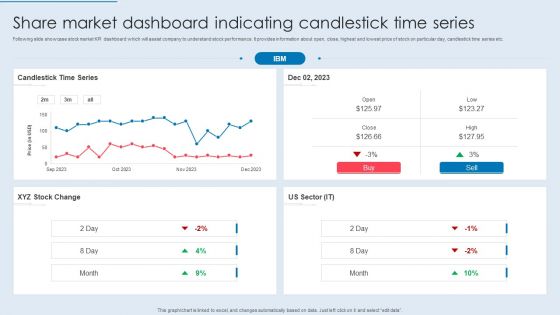
Share Market Dashboard Indicating Candlestick Time Series Formats PDF
Following slide showcase stock market KPI dashboard which will assist company to understand stock performance. It provides information about open, close, highest and lowest price of stock on particular day, candlestick time series etc. Pitch your topic with ease and precision using this Share Market Dashboard Indicating Candlestick Time Series Formats PDF. This layout presents information on Candlestick Time Series, Stock Change, US Sector. It is also available for immediate download and adjustment. So, changes can be made in the color, design, graphics or any other component to create a unique layout.
Performance Indicators For Strategic Resource Evaluation Icons PDF
This slide provides an overview of the various sourcing performance metrics used to analyze and measure the status. Major KPIs covered are purchase order cycle time, inventory turnover, total supply chain cost, number of suppliers and supplier lead time. Showcasing this set of slides titled Performance Indicators For Strategic Resource Evaluation Icons PDF. The topics addressed in these templates are Purchasing, Supply Chain Management, Vendor Management. All the content presented in this PPT design is completely editable. Download it and make adjustments in color, background, font etc. as per your unique business setting.
Sales By Lead Source Performance Indicator Icons PDF
Are you in need of a template that can accommodate all of your creative concepts This one is crafted professionally and can be altered to fit any style. Use it with Google Slides or PowerPoint. Include striking photographs, symbols, depictions, and other visuals. Fill, move around, or remove text boxes as desired. Test out color palettes and font mixtures. Edit and save your work, or work with colleagues. Download Sales By Lead Source Performance Indicator Icons PDF and observe how to make your presentation outstanding. Give an impeccable presentation to your group and make your presentation unforgettable.

Employee Experience Key Performance Indicators During Work Journey Topics PDF
The slide highlights various metrices to measure track progress overtime and build the best possible employee experience. It covers employee satisfaction , productivity, wellness, retention and net promoter score. Presenting Employee Experience Key Performance Indicators During Work Journey Topics PDF to dispense important information. This template comprises five stages. It also presents valuable insights into the topics including Employee Productivity, Employee Retention, Employee Satisfaction. This is a completely customizable PowerPoint theme that can be put to use immediately. So, download it and address the topic impactfully.
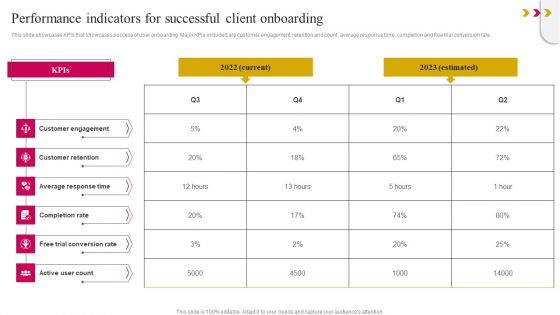
Performance Indicators For Successful Client Onboarding Template PDF
This slide showcases KPIs that showcases success of user onboarding. Major KPIs included are customer engagement, retention and count, average response time, completion and free trial conversion rate. If your project calls for a presentation, then Slidegeeks is your go-to partner because we have professionally designed, easy-to-edit templates that are perfect for any presentation. After downloading, you can easily edit Performance Indicators For Successful Client Onboarding Template PDF and make the changes accordingly. You can rearrange slides or fill them with different images. Check out all the handy templates
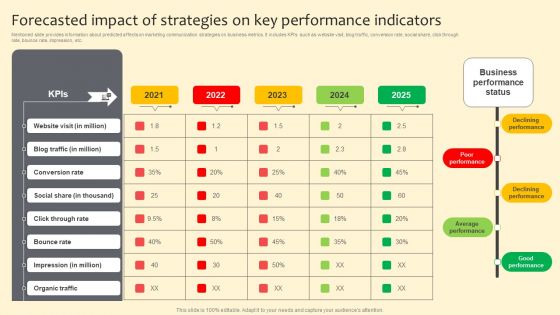
Forecasted Impact Of Strategies On Key Performance Indicators Slides PDF
Mentioned slide provides information about predicted affects on marketing communication strategies on business metrics. It includes KPIs such as website visit, blog traffic, conversion rate, social share, click through rate, bounce rate, impression, etc. Boost your pitch with our creative Forecasted Impact Of Strategies On Key Performance Indicators Slides PDF. Deliver an awe inspiring pitch that will mesmerize everyone. Using these presentation templates you will surely catch everyones attention. You can browse the ppts collection on our website. We have researchers who are experts at creating the right content for the templates. So you do not have to invest time in any additional work. Just grab the template now and use them.
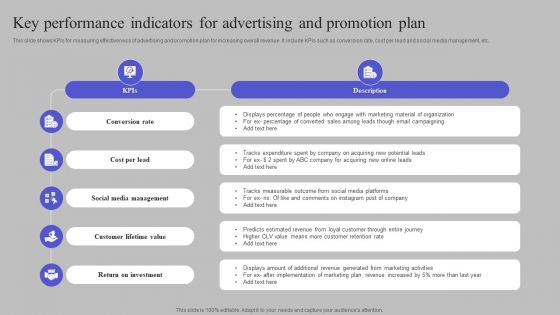
Key Performance Indicators For Advertising And Promotion Plan Background PDF
This slide shows KPIs for measuring effectiveness of advertising and promotion plan for increasing overall revenue. It include KPIs such as conversion rate, cost per lead and social media management, etc. Persuade your audience using this Key Performance Indicators For Advertising And Promotion Plan Background PDF. This PPT design covers five stages, thus making it a great tool to use. It also caters to a variety of topics including Conversion Rate, Cost Per Lead, Social Media Management. Download this PPT design now to present a convincing pitch that not only emphasizes the topic but also showcases your presentation skills.
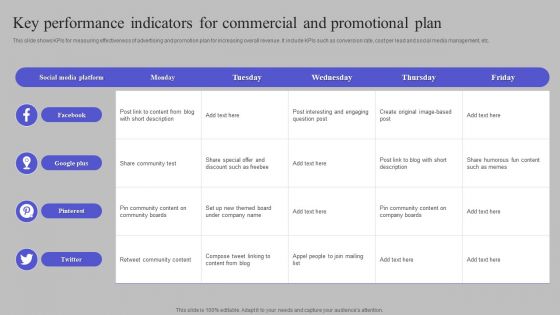
Key Performance Indicators For Commercial And Promotional Plan Information PDF
This slide shows KPIs for measuring effectiveness of advertising and promotion plan for increasing overall revenue. It include KPIs such as conversion rate, cost per lead and social media management, etc. Showcasing this set of slides titled Key Performance Indicators For Commercial And Promotional Plan Information PDF. The topics addressed in these templates are Facebook, Google Plus, Pinterest. All the content presented in this PPT design is completely editable. Download it and make adjustments in color, background, font etc. as per your unique business setting.
Ad Campaign Performance Indicators Tracking Dashboard Diagrams PDF
This slide covers dashboard to measure the performance of ad campaigns on LinkedIn platform. The purpose of this template is to provide the company an overview on the outcomes of running ad campaigns on LinkedIn. It includes performance based on impressions, CTR, engagement rates, CPC, CPM, etc. Find a pre designed and impeccable Ad Campaign Performance Indicators Tracking Dashboard Diagrams PDF. The templates can ace your presentation without additional effort. You can download these easy to edit presentation templates to make your presentation stand out from others. So, what are you waiting for Download the template from Slidegeeks today and give a unique touch to your presentation.
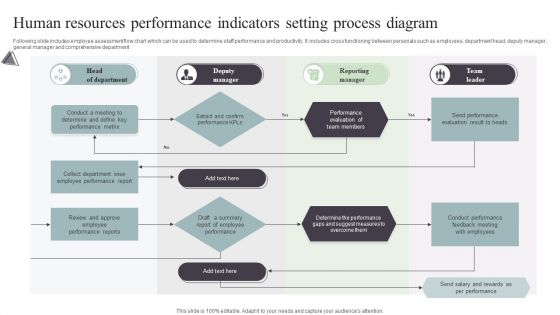
Human Resources Performance Indicators Setting Process Diagram Infographics PDF
Following slide includes employee assessment flow chart which can be used to determine staff performance and productivity. It includes cross functioning between personals such as employees, department head, deputy manager, general manager and comprehensive department. Presenting Human Resources Performance Indicators Setting Process Diagram Infographics PDF to dispense important information. This template comprises one stages. It also presents valuable insights into the topics including Head Of Department, Deputy Manager, Reporting Manager, Team Leader. This is a completely customizable PowerPoint theme that can be put to use immediately. So, download it and address the topic impactfully.

Stoplight Traffic Signal Go Indication Ppt PowerPoint Presentation Complete Deck
This stoplight traffic signal go indication ppt powerpoint presentation complete deck acts as backup support for your ideas, vision, thoughts, etc. Use it to present a thorough understanding of the topic. This PPT slideshow can be utilized for both in-house and outside presentations depending upon your needs and business demands. Entailing twelve slides with a consistent design and theme, this template will make a solid use case. As it is intuitively designed, it suits every business vertical and industry. All you have to do is make a few tweaks in the content or any other component to design unique presentations. The biggest advantage of this complete deck is that it can be personalized multiple times once downloaded. The color, design, shapes, and other elements are free to modify to add personal touches. You can also insert your logo design in this PPT layout. Therefore a well-thought and crafted presentation can be delivered with ease and precision by downloading this stoplight traffic signal go indication ppt powerpoint presentation complete deck PPT slideshow.

Progress Indicator Ring Ppt PowerPoint Presentation Complete Deck With Slides
This progress indicator ring ppt powerpoint presentation complete deck with slides acts as backup support for your ideas, vision, thoughts, etc. Use it to present a thorough understanding of the topic. This PPT slideshow can be utilized for both in-house and outside presentations depending upon your needs and business demands. Entailing twelve slides with a consistent design and theme, this template will make a solid use case. As it is intuitively designed, it suits every business vertical and industry. All you have to do is make a few tweaks in the content or any other component to design unique presentations. The biggest advantage of this complete deck is that it can be personalized multiple times once downloaded. The color, design, shapes, and other elements are free to modify to add personal touches. You can also insert your logo design in this PPT layout. Therefore a well-thought and crafted presentation can be delivered with ease and precision by downloading this progress indicator ring ppt powerpoint presentation complete deck with slides PPT slideshow.

Performance Indicators For Successful Client Onboarding Brochure PDF
This slide showcases KPIs that showcases success of user onboarding. Major KPIs included are customer engagement, retention and count, average response time, completion and free trial conversion rate. Retrieve professionally designed Performance Indicators For Successful Client Onboarding Brochure PDF to effectively convey your message and captivate your listeners. Save time by selecting pre made slideshows that are appropriate for various topics, from business to educational purposes. These themes come in many different styles, from creative to corporate, and all of them are easily adjustable and can be edited quickly. Access them as PowerPoint templates or as Google Slides themes. You do not have to go on a hunt for the perfect presentation because Slidegeeks got you covered from everywhere.

Current Key Account Management Performance Indicators Pictures PDF
The following slide provides information about the current key account management KPIs of the company which are shown in the form of graphs and for the past 5 years. The KPIs are key account satisfaction rate, key account interaction rate, key account churn rate and key account upsell rate. Are you in need of a template that can accommodate all of your creative concepts This one is crafted professionally and can be altered to fit any style. Use it with Google Slides or PowerPoint. Include striking photographs, symbols, depictions, and other visuals. Fill, move around, or remove text boxes as desired. Test out color palettes and font mixtures. Edit and save your work, or work with colleagues. Download Current Key Account Management Performance Indicators Pictures PDF and observe how to make your presentation outstanding. Give an impeccable presentation to your group and make your presentation unforgettable.
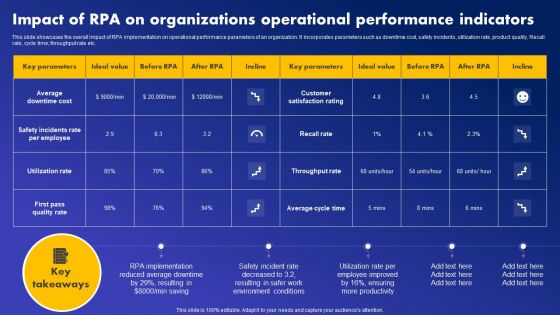
Impact Of RPA On Organizations Operational Performance Indicators Topics PDF
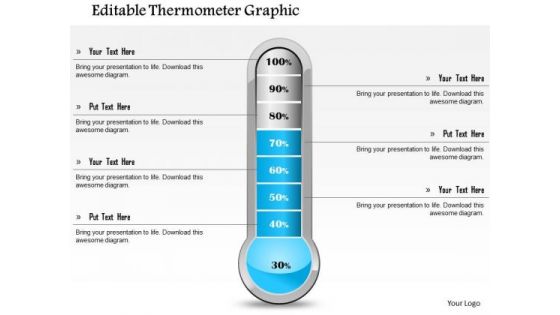
Business Framework Editable Thermometer Graphic PowerPoint Presentation
This Power Point template slide has been crafted with graphic of meter. This meter contains the max and min value. Use this PPt for your technical presentation and display your technical specifications in a graphical way.
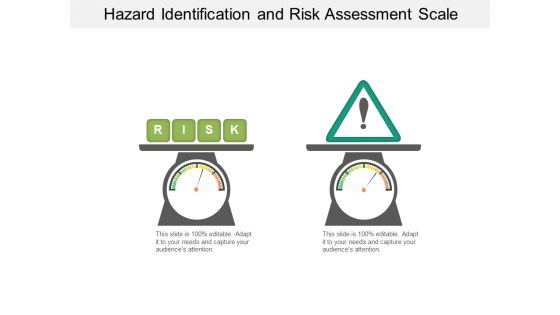
Hazard Identification And Risk Assessment Scale Ppt PowerPoint Presentation File Aids
This is a hazard identification and risk assessment scale ppt powerpoint presentation file aids. This is a two stage process. The stages in this process are risk meter, risk speedometer, hazard meter.
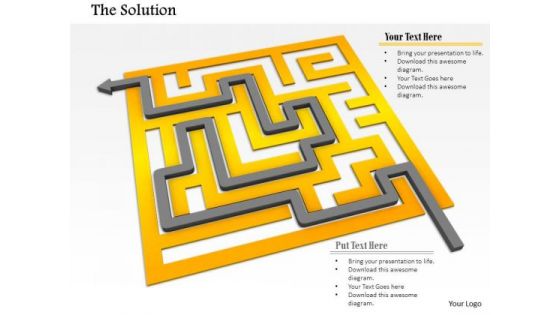
Stock Photo Arrow Indicating Solution Path Of Maze Pwerpoint Slide
This conceptual image is designed with graphic of maze and arrow. In this image maze shows the concept of problem while arrow is reflecting the idea of solution. Build a innovative presentation for displaying the complexity of problem solving topic. Use this image for business, sales and marketing related presentations.
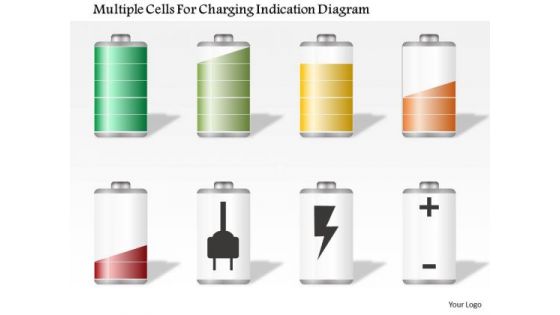
Business Diagram Multiple Cells For Charging Indication Diagram Presentation Template
Graphic of multiple cells is used to decorate this power point template slide. This PPt slide contains the concept of charging and power consumption. Use this PPT slide and explain these topics in a graphical manner.
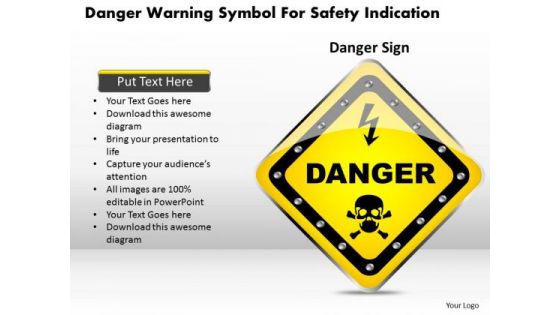
Business Diagram Danger Warning Symbol For Safety Indication Presentation Template
This Power Point template has been designed with graphic of danger board. This diagram contains the concept of safety warning for danger area. Use this diagram for your warning and safety related presentation.
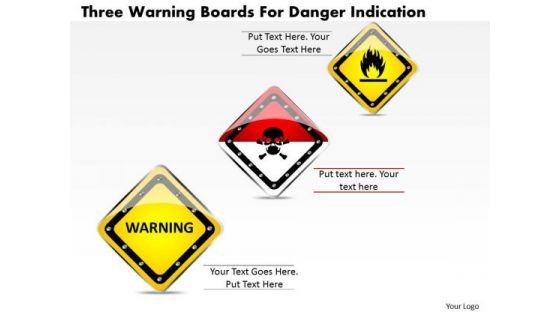
Business Diagram Three Warning Boards For Danger Indication Presentation Template
This Power Point image template has been designed with graphic of three different sign boards. These signs are designed to identify dangerous places. Use this diagram for safety and prevention related topics.
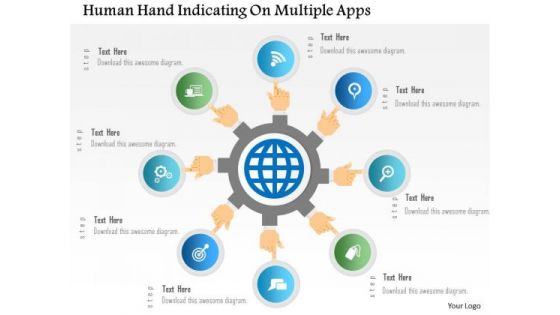
Business Diagram Human Hand Indicating On Multiple Apps PowerPoint Template
Graphic of human hand with multiple apps has been used to craft this PPT. This PPT diagram contains the concept of app usage. Use this PPT for your technology and data related topics in any presentation.
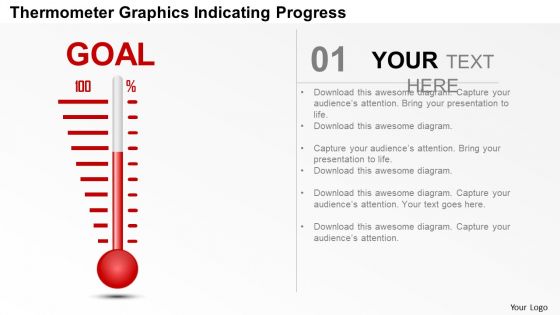
Business Diagram Thermometer Graphics Indicating Progress Presentation Template
This power point template diagram has been designed with graphic of thermometer and bar graph. This PPT contains the concept of growth analysis. Use this PPT for business and marketing related presentations.
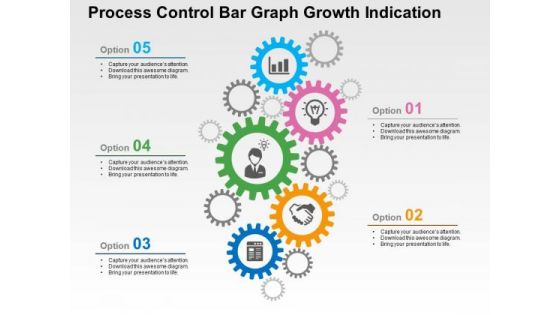
Process Control Bar Graph Growth Indication PowerPoint Template
Download our business slide with gear graphics to convincingly convey your important ideas in presentations. It also contains graphics of business icons. Create captivating presentations using this template

Eight Tags For Business Process Indication Powerpoint Template
Our above PPT slide contains graphics of eight text tags with icons. This PowerPoint template may be used to display business process steps. Use this diagram to impart more clarity to data and to create more sound impact on viewers.
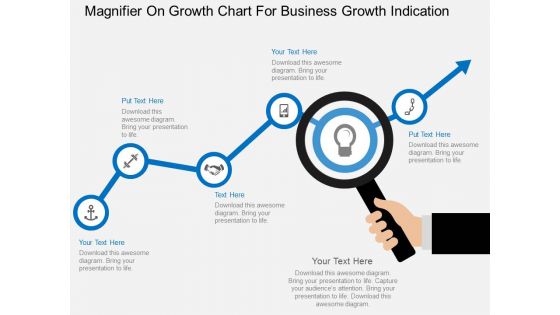
Magnifier On Growth Chart For Business Growth Indication Powerpoint Template
This business slide contains graphics of magnifier on growth chart. This PowerPoint template helps to display business planning and analysis. Use this diagram to impart more clarity to concept and to create more sound impact on viewers.

Plant With Bulb Education Growth Indication Powerpoint Template
This PowerPoint slide has been designed with graphics of plant and bulb. This diagram is designed to display education and growth. This professional slide helps in making an instant impact on viewers.
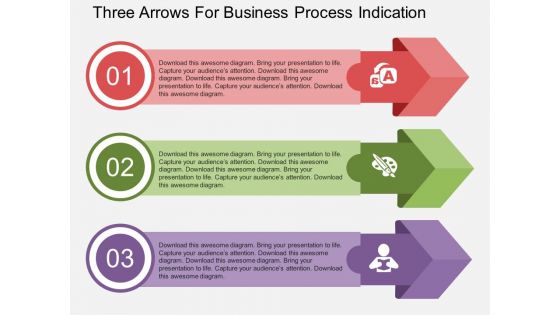
Three Arrows For Business Process Indication Powerpoint Template
This business slide displays diagram of three arrows with icons. Download this diagram to display information in visual manner. Visual effect of this diagram helps in maintaining the flow of the discussion and provides more clarity to the subject.
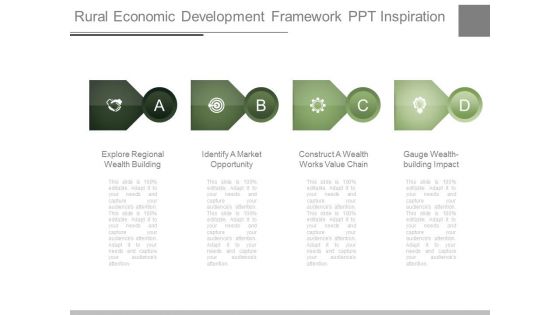
Rural Economic Development Framework Ppt Inspiration
This is a rural economic development framework ppt inspiration. This is a four stage process. The stages in this process are explore regional wealth building, identify a market opportunity, construct a wealth works value chain, gauge wealth building impact.
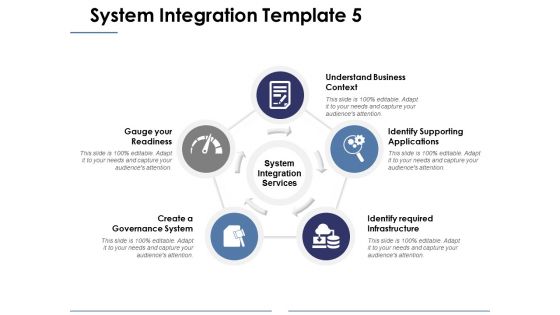
System Integration Template 5 Ppt PowerPoint Presentation File Gallery
This is a system integration template 5 ppt powerpoint presentation file gallery. This is a five stage process. The stages in this process are gauge your readiness, create a governance system, understand business context, identify supporting applications, identify required infrastructure.
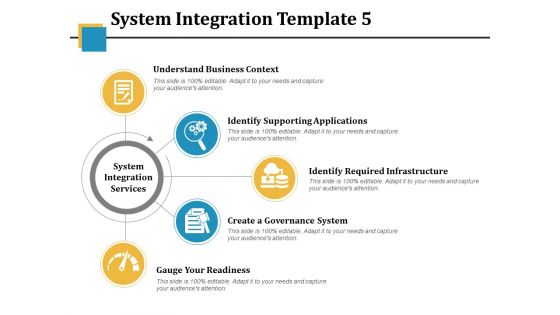
System Integration Template 5 Ppt PowerPoint Presentation Summary Templates
This is a system integration template 5 ppt powerpoint presentation summary templates. This is a five stage process. The stages in this process are understand business context, identify supporting applications, identify required infrastructure, create a governance system, gauge your readiness.
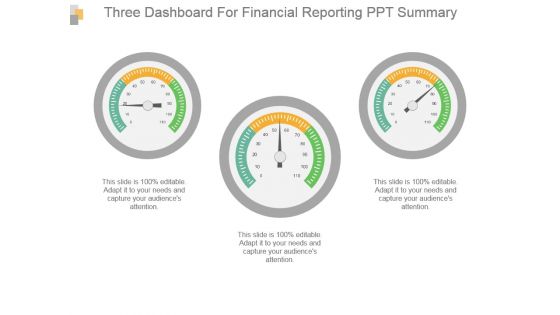
Three Dashboard For Financial Reporting Ppt Summary
This is a three dashboard for financial reporting ppt summary. This is a three stage process. The stages in this process are business, marketing, speed, dashboard, meter.
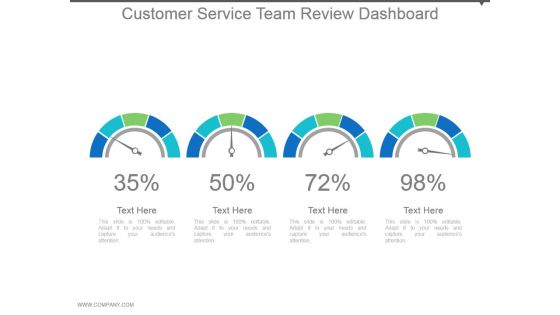
Customer Service Team Review Dashboard Powerpoint Slide Rules
This is a customer service team review dashboard powerpoint slide rules. This is a four stage process. The stages in this process are dashboard, meter, financials, speed, measure.
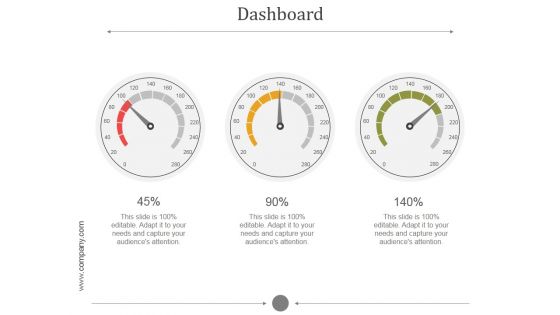
Dashboard Ppt PowerPoint Presentation Show
This is a dashboard ppt powerpoint presentation show. This is a three stage process. The stages in this process are speed, meter, measure, needle, calculate.

Project Dashboard Ppt PowerPoint Presentation Clipart
This is a project dashboard ppt powerpoint presentation clipart. This is a three stage process. The stages in this process are speed, meter, measure, needle, calculate.
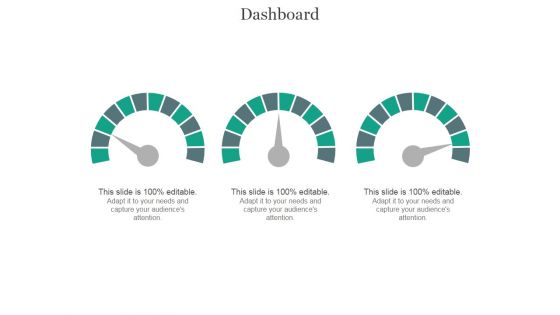
Dashboard Ppt PowerPoint Presentation Microsoft
This is a dashboard ppt powerpoint presentation microsoft. This is a three stage process. The stages in this process are dashboard, business, marketing, speed, meter.

Dashboard Ppt PowerPoint Presentation Images
This is a dashboard ppt powerpoint presentation images. This is a one stage process. The stages in this process are dashboard, meter, speed, measure, business.

Dashboard Ppt PowerPoint Presentation Styles
This is a dashboard ppt powerpoint presentation styles. This is a three stage process. The stages in this process are dashboard, business, marketing, meter, speed.
Dashboard Ppt PowerPoint Presentation Outline Icon
This is a dashboard ppt powerpoint presentation outline icon. This is a three stage process. The stages in this process are speed, meter, business, marketing, equipment.
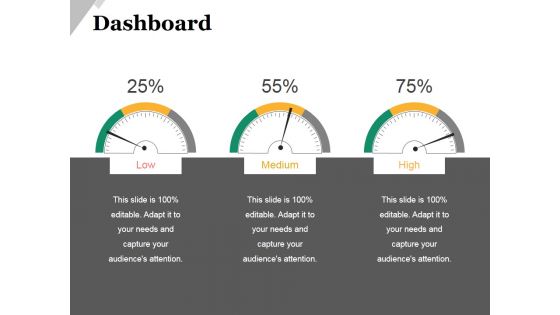
Dashboard Ppt PowerPoint Presentation Layouts Elements
This is a dashboard ppt powerpoint presentation layouts elements. This is a three stage process. The stages in this process are speed, meter, business, marketing, equipment.
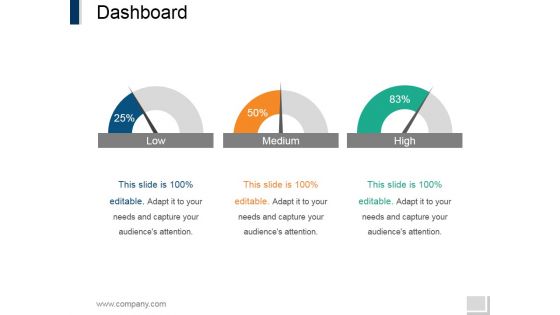
Dashboard Ppt PowerPoint Presentation Pictures Portfolio
This is a dashboard ppt powerpoint presentation pictures portfolio. This is a three stage process. The stages in this process are speed, meter, business, marketing, equipment.

Dashboard Ppt PowerPoint Presentation Infographic Template Model
This is a dashboard ppt powerpoint presentation infographic template model. This is a four stage process. The stages in this process are business, marketing, meter, speed, measure.
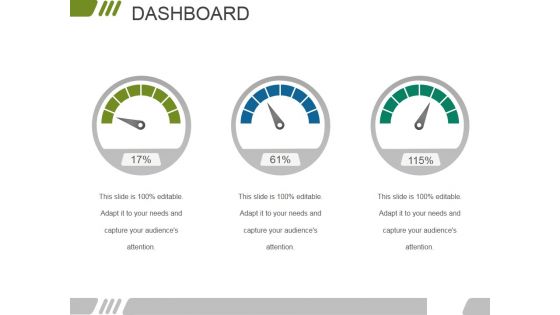
Dashboard Ppt PowerPoint Presentation Visual Aids Professional
This is a dashboard ppt powerpoint presentation visual aids professional. This is a three stage process. The stages in this process are speed, meter, business, marketing, equipment.
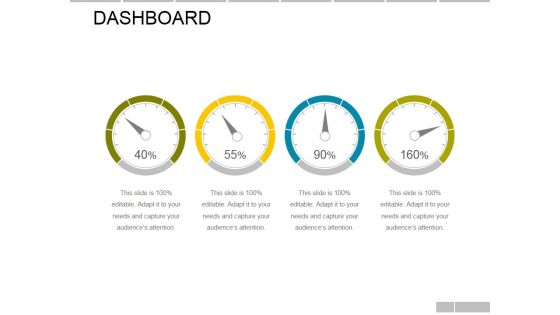
Dashboard Ppt PowerPoint Presentation Infographics Introduction
This is a dashboard ppt powerpoint presentation infographics introduction. This is a four stage process. The stages in this process are dashboard, meter, business, marketing, finance.
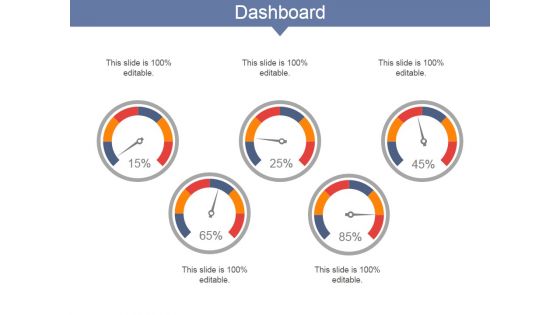
Dashboard Ppt PowerPoint Presentation Model Inspiration
This is a dashboard ppt powerpoint presentation model inspiration. This is a five stage process. The stages in this process are dashboard, business, marketing, strategy, meter.
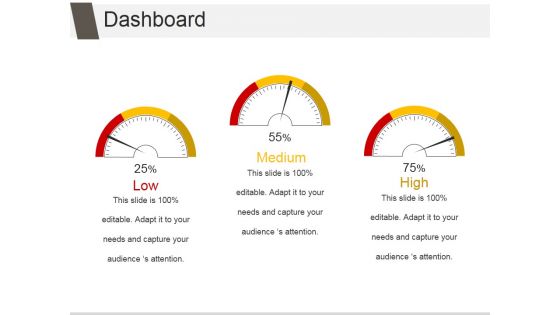
Dashboard Ppt PowerPoint Presentation Inspiration File Formats
This is a dashboard ppt powerpoint presentation inspiration file formats. This is a three stage process. The stages in this process are speed, meter, business, marketing, equipment.
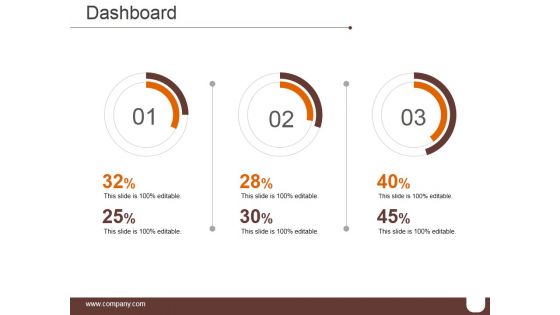
Dashboard Ppt PowerPoint Presentation Infographics Format Ideas
This is a dashboard ppt powerpoint presentation infographics format ideas. This is a three stage process. The stages in this process are speed, meter, business, marketing, equipment.
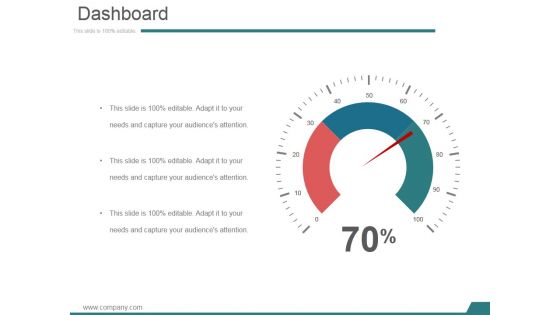
Dashboard Ppt PowerPoint Presentation Infographics Sample
This is a dashboard ppt powerpoint presentation infographics sample. This is a one stage process. The stages in this process are speed, meter, business, marketing, equipment.

Dashboard Ppt PowerPoint Presentation Gallery Layouts
This is a dashboard ppt powerpoint presentation gallery layouts. This is a two stage process. The stages in this process are speed, meter, business, marketing, equipment.

Dashboard Ppt PowerPoint Presentation Summary Example Topics
This is a dashboard ppt powerpoint presentation summary example topics. This is a one stage process. The stages in this process are speed, meter, business, marketing, equipment.
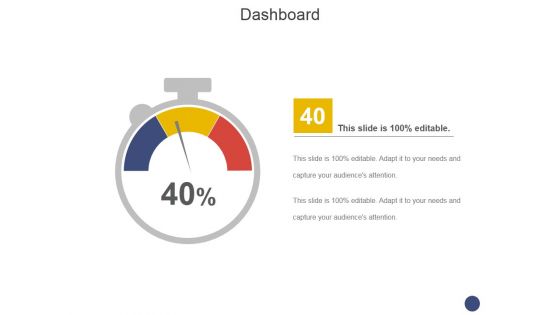
Dashboard Ppt PowerPoint Presentation Layouts Diagrams
This is a dashboard ppt powerpoint presentation layouts diagrams. This is a one stage process. The stages in this process are speed, meter, business, marketing, equipment.

 Home
Home