Barometer
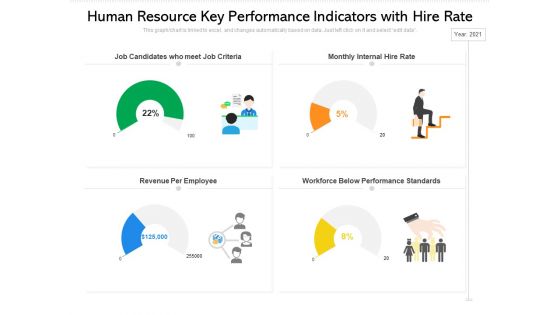
Human Resource Key Performance Indicators With Hire Rate Ppt PowerPoint Presentation Summary Examples PDF
Pitch your topic with ease and precision using this human resource key performance indicators with hire rate ppt powerpoint presentation summary examples pdf. This layout presents information on job candidates who meet job criteria, monthly internal hire rate, revenue per employee. It is also available for immediate download and adjustment. So, changes can be made in the color, design, graphics or any other component to create a unique layout.
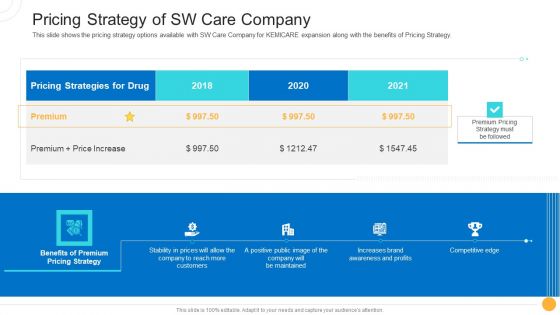
Drug Indicator Extension In A Pharmaceuticals Company Pricing Strategy Of SW Care Company Designs PDF
This slide shows the pricing strategy options available with SW Care Company for KEMICARE expansion along with the benefits of Pricing Strategy. Deliver and pitch your topic in the best possible manner with this drug indicator extension in a pharmaceuticals company pricing strategy of sw care company designs pdf. Use them to share invaluable insights on pricing strategies, competitive edge, maintained, awareness and impress your audience. This template can be altered and modified as per your expectations. So, grab it now.
Drug Indicator Extension In A Pharmaceuticals Company Post It Notes Introduction PDF
This is a drug indicator extension in a pharmaceuticals company post it notes introduction pdf template with various stages. Focus and dispense information on three stages using this creative set, that comes with editable features. It contains large content boxes to add your information on topics like post it notes. You can also showcase facts, figures, and other relevant content using this PPT layout. Grab it now.

Drug Indicator Extension In A Pharmaceuticals Company SW Care Pharmaceutical Company Overview Information PDF
This slide shows details about SW Care Pharmaceutical Company such as overview, headquarters, annual revenue, leading brand, future company strategy or goal etc. Deliver an awe inspiring pitch with this creative drug indicator extension in a pharmaceuticals company sw care pharmaceutical company overview information pdf bundle. Topics like revenue, headquarters, objective, strategy, plan can be discussed with this completely editable template. It is available for immediate download depending on the needs and requirements of the user.
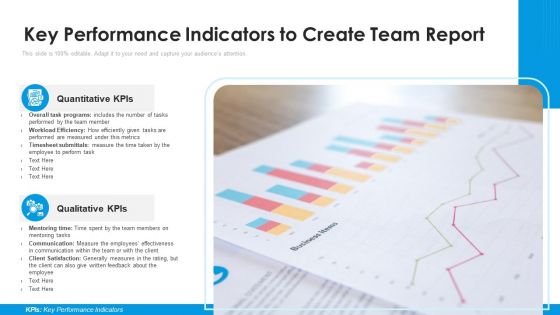
Key Performance Indicators To Create Team Report Ppt Model Microsoft PDF
Persuade your audience using this key performance indicators to create team report ppt model microsoft pdf. This PPT design covers two stages, thus making it a great tool to use. It also caters to a variety of topics including quantitative kpis, qualitative kpis. Download this PPT design now to present a convincing pitch that not only emphasizes the topic but also showcases your presentation skills.

Wheel Indicating Cooperation Tools For Content Management Ppt PowerPoint Presentation File Grid PDF
Persuade your audience using this wheel indicating cooperation tools for content management ppt powerpoint presentation file grid pdf. This PPT design covers three stages, thus making it a great tool to use. It also caters to a variety of topics including coordination, production, decision making. Download this PPT design now to present a convincing pitch that not only emphasizes the topic but also showcases your presentation skills.
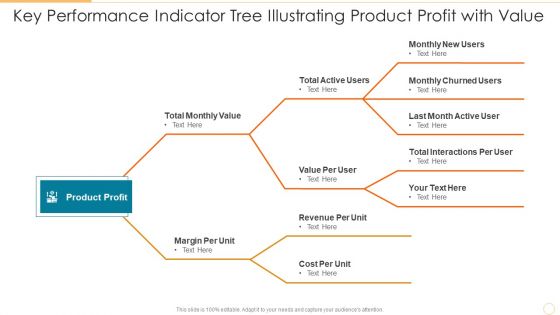
Key Performance Indicator Tree Illustrating Product Profit With Value Brochure PDF
Persuade your audience using this key performance indicator tree illustrating product profit with value brochure pdf. This PPT design covers three stages, thus making it a great tool to use. It also caters to a variety of topics including value per user, revenue per unit, cost per unit. Download this PPT design now to present a convincing pitch that not only emphasizes the topic but also showcases your presentation skills.
Five Different Types Of Calculate Facebook Key Performance Indicator Results Icons PDF
Pitch your topic with ease and precision using this five different types of calculate facebook key performance indicator results icons pdf. This layout presents information on reach kpis, traffic kpis, engagement kpis, conversions kpis, brand awareness kpis. It is also available for immediate download and adjustment. So, changes can be made in the color, design, graphics or any other component to create a unique layout.

Approaches For New Product Release Product Launch Goals And Performance Indicators Microsoft PDF
This slides shows table to specify measurable, observable and time specific goals such as revenue generated, subscribers gained etc Deliver an awe inspiring pitch with this creative approaches for new product release product launch goals and performance indicators microsoft pdf bundle. Topics like revenue, customer retention, subscribers, customer lifetime can be discussed with this completely editable template. It is available for immediate download depending on the needs and requirements of the user.
Agenda For Icons Slide For Delivery Methods To Drive Key Performance Indicators Brochure PDF
Presenting agenda for icons slide for delivery methods to drive key performance indicators brochure pdf to provide visual cues and insights. Share and navigate important information on six stages that need your due attention. This template can be used to pitch topics like digital transformation, to collaborate and business, drive efficiencies, business stability. In addtion, this PPT design contains high resolution images, graphics, etc, that are easily editable and available for immediate download.
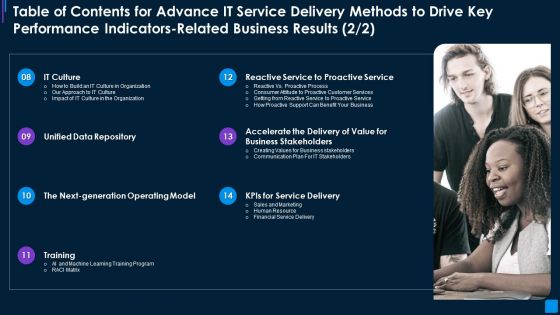
Table Of Contents Delivery Methods To Drive Key Performance Indicators Related Brochure PDF
Presenting table of contents delivery methods to drive key performance indicators related brochure pdf to provide visual cues and insights. Share and navigate important information on seven stages that need your due attention. This template can be used to pitch topics like it culture, unified data repository, proactive service, business stakeholders. In addtion, this PPT design contains high resolution images, graphics, etc, that are easily editable and available for immediate download.
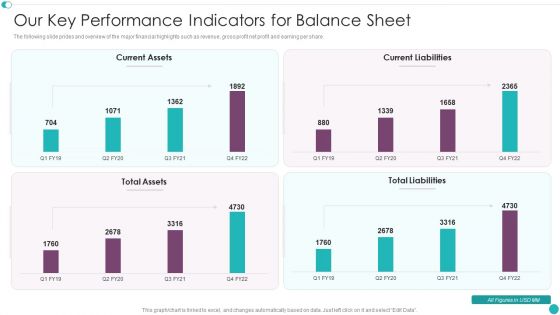
Credit Management And Recovery Policies Our Key Performance Indicators For Balance Sheet Rules PDF
The following slide prides and overview of the major financial highlights such as revenue, gross profit net profit and earning per share. Deliver an awe inspiring pitch with this creative Credit Management And Recovery Policies Our Key Performance Indicators For Balance Sheet Rules PDF bundle. Topics like Current Assets, Current Liabilities, Total Liabilities can be discussed with this completely editable template. It is available for immediate download depending on the needs and requirements of the user.
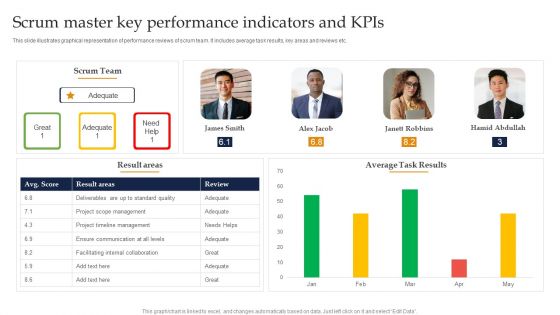
Scrum Master Key Performance Indicators And Kpis Ppt Gallery Files PDF
This slide illustrates graphical representation of performance reviews of scrum team. It includes average task results, key areas and reviews etc. Showcasing this set of slides titled Scrum Master Key Performance Indicators And Kpis Ppt Gallery Files PDF. The topics addressed in these templates are Scrum Team, Average Task Results, Project Timeline Management. All the content presented in this PPT design is completely editable. Download it and make adjustments in color, background, font etc. as per your unique business setting.

Timeline Indicating Insider Threat In Cyber Security User Activities Microsoft PDF
This slide shows timeline depicting insider threat user logs. It contains information about archived activities, user event, policy violation trigger, capture continuation, etc. Pitch your topic with ease and precision using this Timeline Indicating Insider Threat In Cyber Security User Activities Microsoft PDF. This layout presents information on User Event, Policy Violation Trigger, Archived Logs. It is also available for immediate download and adjustment. So, changes can be made in the color, design, graphics or any other component to create a unique layout.
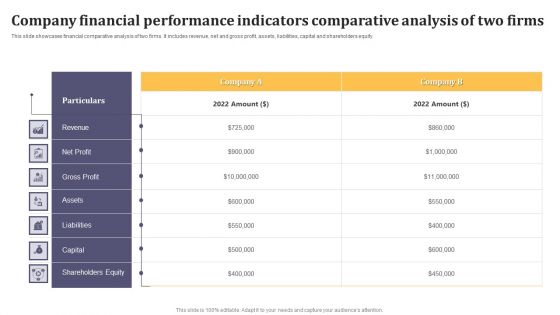
Company Financial Performance Indicators Comparative Analysis Of Two Firms Elements PDF
This slide showcases financial comparative analysis of two firms. It includes revenue, net and gross profit, assets, liabilities, capital and shareholders equity. Showcasing this set of slides titled Company Financial Performance Indicators Comparative Analysis Of Two Firms Elements PDF. The topics addressed in these templates are Revenue, Net Profit, Gross Profit. All the content presented in this PPT design is completely editable. Download it and make adjustments in color, background, font etc. as per your unique business setting.
Company Financial Performance Indicators Dashboard With Working Capital And Cash Conversion Icons PDF
This slide shows dashboard of finance KPIs . It covers working capital, cash conversion cycle, vendor payment error rate ,current assets and liabilities. Showcasing this set of slides titled Company Financial Performance Indicators Dashboard With Working Capital And Cash Conversion Icons PDF. The topics addressed in these templates are Current Working Capital, Current Liabilities, Working Capital. All the content presented in this PPT design is completely editable. Download it and make adjustments in color, background, font etc. as per your unique business setting.

Company Financial Performance Indicators With Revenue Cost And Assets Background PDF
This slide shows supply chain functions which are reliability for goods delivery, responsibility, flexibility, cost and asset management efficiency. Showcasing this set of slides titled Company Financial Performance Indicators With Revenue Cost And Assets Background PDF. The topics addressed in these templates are Perfect Order Fulfillment, Cycle Time, Supply Chain, Management Cost. All the content presented in this PPT design is completely editable. Download it and make adjustments in color, background, font etc. as per your unique business setting.
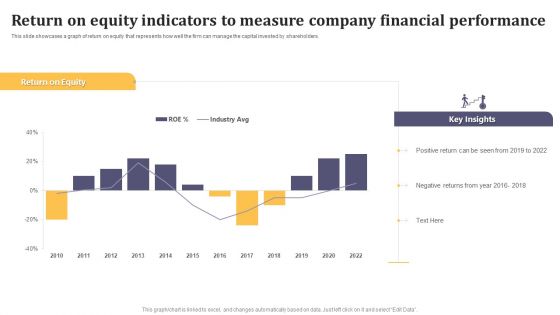
Return On Equity Indicators To Measure Company Financial Performance Mockup PDF
This slide showcases a graph of return on equity that represents how well the firm can manage the capital invested by shareholders. Pitch your topic with ease and precision using this Return On Equity Indicators To Measure Company Financial Performance Mockup PDF. This layout presents information on Return On Equity, Key Insights, Positive Return. It is also available for immediate download and adjustment. So, changes can be made in the color, design, graphics or any other component to create a unique layout.

SLA KPL Dashboard Indicating Compliance Priority With KPI Ppt File Format PDF
This graph or chart is linked to excel, and changes automatically based on data. Just left click on it and select Edit Data. Showcasing this set of slides titled SLA KPL Dashboard Indicating Compliance Priority With KPI Ppt File Format PDF. The topics addressed in these templates are KPI Graph, Insights Here, SLA Compliance Priority. All the content presented in this PPT design is completely editable. Download it and make adjustments in color, background, font etc. as per your unique business setting.
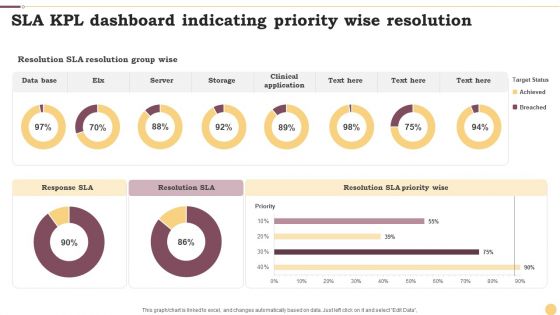
SLA KPL Dashboard Indicating Priority Wise Resolution Ppt Infographics Example File PDF
This graph or chart is linked to excel, and changes automatically based on data. Just left click on it and select Edit Data. Pitch your topic with ease and precision using this SLA KPL Dashboard Indicating Priority Wise Resolution Ppt Infographics Example File PDF. This layout presents information on Data Base, Server, Storage. It is also available for immediate download and adjustment. So, changes can be made in the color, design, graphics or any other component to create a unique layout.

SLA KPL Dashboard Indicating Top Week Performers Ppt Infographics Examples PDF
This graph or chart is linked to excel, and changes automatically based on data. Just left click on it and select Edit Data. Showcasing this set of slides titled SLA KPL Dashboard Indicating Top Week Performers Ppt Infographics Examples PDF. The topics addressed in these templates are Active Slas Risk, Active Slas Breached, Active Slas. All the content presented in this PPT design is completely editable. Download it and make adjustments in color, background, font etc. as per your unique business setting.

Key Performance Indicators Of Sales Coaching Program Ppt Styles Graphic Images PDF
The following slide highlights the key statistics of sales training program on overall business performance. It also includes three main elements namely retention, budget and impact. Presenting Key Performance Indicators Of Sales Coaching Program Ppt Styles Graphic Images PDF to dispense important information. This template comprises three stages. It also presents valuable insights into the topics including Retention, Budget, Impact, Employee. This is a completely customizable PowerPoint theme that can be put to use immediately. So, download it and address the topic impactfully.

Managing E Commerce Business Accounting Dashboard Indicating Online Store Accounts Overview Inspiration PDF
The following slide showcases ecommerce accounts management dashboard. It provides information about income, expenses, cash collected, cash spent, tax collected, tax claim, stock sold, invoice, etc. There are so many reasons you need a Managing E Commerce Business Accounting Dashboard Indicating Online Store Accounts Overview Inspiration PDF. The first reason is you can not spend time making everything from scratch, Thus, Slidegeeks has made presentation templates for you too. You can easily download these templates from our website easily.
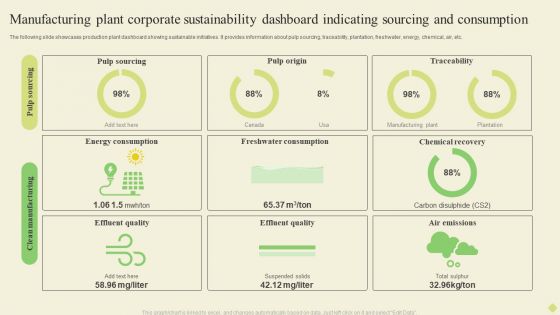
Manufacturing Plant Corporate Sustainability Dashboard Indicating Sourcing And Consumption Infographics PDF
The following slide showcases business sustainability dashboard highlighting multiple sources of technology. It provides information about renewable energy, plant age, solar, wind, biomass, regionality, etc.Pitch your topic with ease and precision using this Manufacturing Plant Corporate Sustainability Dashboard Indicating Sourcing And Consumption Infographics PDF. This layout presents information on Energy Consumption, Freshwater Consumption, Chemical Recovery. It is also available for immediate download and adjustment. So, changes can be made in the color, design, graphics or any other component to create a unique layout.
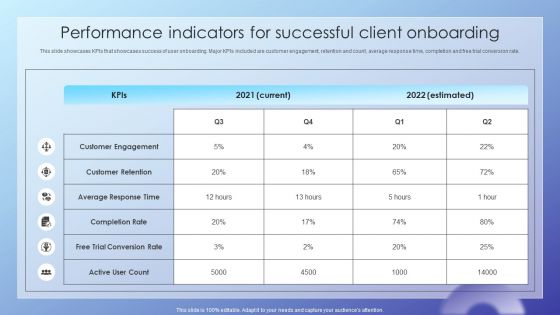
Client Acquisition Journey Plan Performance Indicators For Successful Client Structure PDF
This slide showcases KPIs that showcases success of user onboarding. Major KPIs included are customer engagement, retention and count, average response time, completion and free trial conversion rate. There are so many reasons you need a Client Acquisition Journey Plan Performance Indicators For Successful Client Structure PDF. The first reason is you cant spend time making everything from scratch, Thus, Slidegeeks has made presentation templates for you too. You can easily download these templates from our website easily.

Optimizing Traditional Media To Boost Sales Performance Indicators For Effective Traditional Marketing Diagrams PDF
The best PPT templates are a great way to save time, energy, and resources. Slidegeeks have 100 percent editable powerpoint slides making them incredibly versatile. With these quality presentation templates, you can create a captivating and memorable presentation by combining visually appealing slides and effectively communicating your message. Download Optimizing Traditional Media To Boost Sales Performance Indicators For Effective Traditional Marketing Diagrams PDF from Slidegeeks and deliver a wonderful presentation.
Indicator Batteries Charging And Discharging 4 PowerPoint Slides And Ppt Diagram Templates
Indicator Batteries Charging And Discharging 4 PowerPoint Slides And PPT Diagram Templates-These high quality powerpoint pre-designed slides and powerpoint templates have been carefully created by our professional team to help you impress your audience. All slides have been created and are 100% editable in powerpoint. Each and every property of any graphic - color, size, orientation, shading, outline etc. can be modified to help you build an effective powerpoint presentation. Any text can be entered at any point in the powerpoint template or slide. Simply DOWNLOAD, TYPE and PRESENT!

Indicator Batteries Charging And Discharging 5 PowerPoint Slides And Ppt Diagram Templates
Indicator Batteries Charging And Discharging 5 PowerPoint Slides And PPT Diagram Templates-These high quality powerpoint pre-designed slides and powerpoint templates have been carefully created by our professional team to help you impress your audience. All slides have been created and are 100% editable in powerpoint. Each and every property of any graphic - color, size, orientation, shading, outline etc. can be modified to help you build an effective powerpoint presentation. Any text can be entered at any point in the powerpoint template or slide. Simply DOWNLOAD, TYPE and PRESENT!
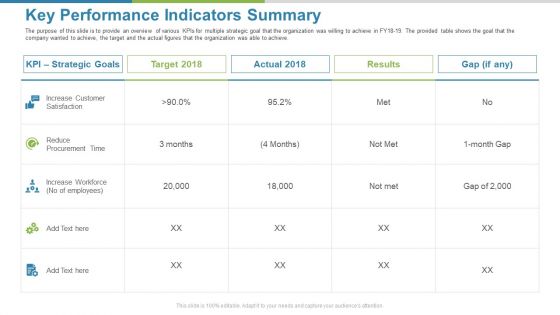
Work Execution Liability Key Performance Indicators Summary Ppt Show Slides PDF
The purpose of this slide is to provide an overview of various KPIs for multiple strategic goal that the organization was willing to achieve in FY18-19. The provided table shows the goal that the company wanted to achieve, the target and the actual figures that the organization was able to achieve. Deliver and pitch your topic in the best possible manner with this work execution liability key performance indicators summary ppt show slides pdf. Use them to share invaluable insights on strategic goals, target, actual, results, gap and impress your audience. This template can be altered and modified as per your expectations. So, grab it now.

Technology Innovation Human Resource System HR Key Performance Indicators Ppt Styles Designs Download PDF
The dashboard focus on monitoring the internal hire rate, percentage of eligible candidate, revenue per employee and workforce below job standard. Presenting technology innovation human resource system hr key performance indicators ppt styles designs download pdf to provide visual cues and insights. Share and navigate important information on four stages that need your due attention. This template can be used to pitch topics like revenue per employee, performance standards, internal rate. In addition, this PPT design contains high-resolution images, graphics, etc, that are easily editable and available for immediate download.
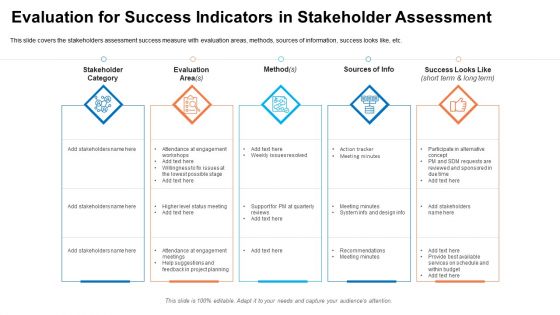
Evaluation For Success Indicators In Stakeholder Assessment Ppt Infographic Template Graphics Pictures PDF
This slide covers the stakeholders assessment success measure with evaluation areas, methods, sources of information, success looks like, etc. This is a evaluation for success indicators in stakeholder assessment ppt infographic template graphics pictures pdf template with various stages. Focus and dispense information on five stages using this creative set, that comes with editable features. It contains large content boxes to add your information on topics like stakeholder category, evaluation area, feedback in project planning. You can also showcase facts, figures, and other relevant content using this PPT layout. Grab it now.
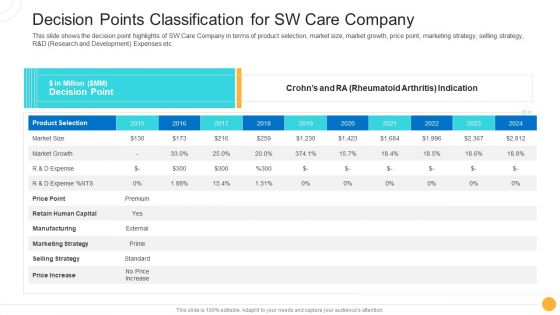
Drug Indicator Extension In A Pharmaceuticals Company Decision Points Classification For SW Care Company Download PDF
This slide shows the decision point highlights of SW Care Company in terms of product selection, market size, market growth, price point, marketing strategy, selling strategy, R and D Research and Development Expenses etc. Deliver and pitch your topic in the best possible manner with this drug indicator extension in a pharmaceuticals company decision points classification for sw care company download pdf. Use them to share invaluable insights on market growth, market size, marketing strategy, manufacturing, price increase and impress your audience. This template can be altered and modified as per your expectations. So, grab it now.

Drug Indicator Extension In A Pharmaceuticals Company Financial Highlights Of SW Care Company Slides PDF
This slide shows the Financial Highlights of SW Care Company such as net trade sales, gross profit, net income, sales and marketing investment, share metrics, value creation metrics, market growth etc. along with decision point summary details. Deliver an awe inspiring pitch with this creative drug indicator extension in a pharmaceuticals company financial highlights of sw care company slides pdf bundle. Topics like decision point summary, financials, market assumptions can be discussed with this completely editable template. It is available for immediate download depending on the needs and requirements of the user.

Outline For Devops Benefits Culture Performance Indicators And Implementation Roadmap Ppt PowerPoint Presentation Complete With Slides
Pitch yourself both in house and outside by utilizing this complete deck. This outline for devops benefits culture performance indicators and implementation roadmap ppt powerpoint presentation complete with slides focuses on key fundamentals of the topic, displayed using different slides. With a total of fifty three slides, this template is the best tool you can use to persuade your audience. It will not only help you create great presentations but also induce strategic thinking because of its well researched content and graphics. You can easily personalize any of the elements to suit your unique business setting. Additionally, it can be saved in PNG, JPG, and PDF formats to save your time and resources.
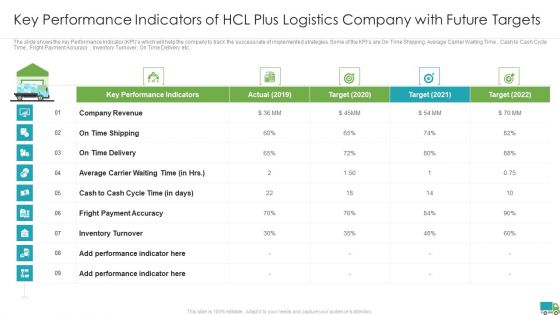
Generating Logistics Value Business Key Performance Indicators Of Hcl Plus Logistics Company With Future Sample PDF
The slide shows the key Performance Indicator KPIs which will help the company to track the success rate of implemented strategies. Some of the KPIs are On Time Shipping, Average Carrier Waiting Time, Cash to Cash Cycle Time, Fright Payment Accuracy, Inventory Turnover, On Time Delivery etc. Deliver and pitch your topic in the best possible manner with this generating logistics value business hcl plus logistics company business details with surplus funds elements pdf. Use them to share invaluable insights on company revenue, fright payment accuracy, inventory turnover and impress your audience. This template can be altered and modified as per your expectations. So, grab it now.
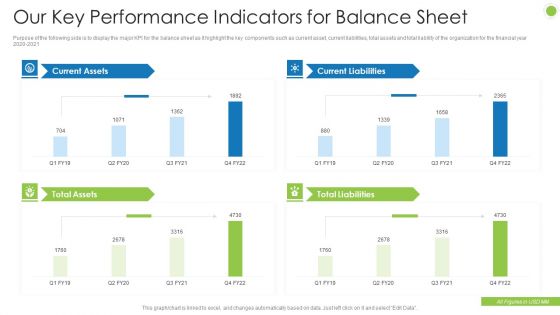
Debt Retrieval Techniques Our Key Performance Indicators For Balance Sheet Ppt Pictures Gallery PDF
Purpose of the following side is to display the major KPI for the balance sheet as it highlight the key components such as current asset, current liabilities, total assets and total liability of the organization for the financial year 2020 2021 Deliver and pitch your topic in the best possible manner with this debt retrieval techniques our key performance indicators for balance sheet ppt pictures gallery pdf. Use them to share invaluable insights on current assets, current liabilities, total assets, total liabilities and impress your audience. This template can be altered and modified as per your expectations. So, grab it now.

Pie Chart Indicating Funding Request For Key Business Areas Ppt Show Topics PDF
This slide showcases circular chart depicting funding ask for key business areas. It provides information about capital expenditure, marketing and sales, product development, personnel, etc. Pitch your topic with ease and precision using this pie chart indicating funding request for key business areas ppt show topics pdf. This layout presents information on product development, capex, marketing and sales, personnel. It is also available for immediate download and adjustment. So, changes can be made in the color, design, graphics or any other component to create a unique layout.
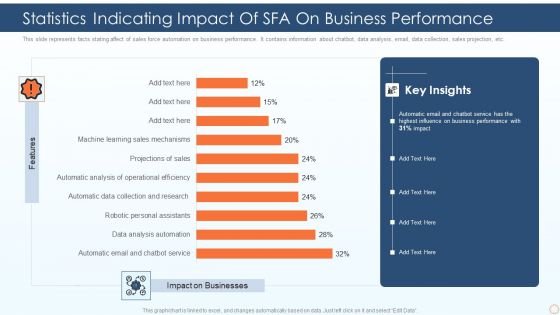
Statistics Indicating Impact Of SFA On Business Performance Ppt PowerPoint Presentation Gallery Outfit PDF
This slide represents facts stating affect of sales force automation on business performance. It contains information about chatbot, data analysis, email, data collection, sales projection, etc. Pitch your topic with ease and precision using this statistics indicating impact of sfa on business performance ppt powerpoint presentation gallery outfit pdf. This layout presents information on automatic email and chatbot service, data analysis automation, robotic personal assistants. It is also available for immediate download and adjustment. So, changes can be made in the color, design, graphics or any other component to create a unique layout.
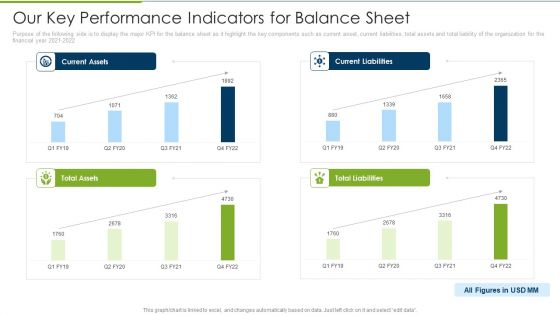
Debt Collection Improvement Plan Our Key Performance Indicators For Balance Sheet Professional PDF
Purpose of the following side is to display the major KPI for the balance sheet as it highlight the key components such as current asset, current liabilities, total assets and total liability of the organization for the financial year 2021 to 2022. Deliver and pitch your topic in the best possible manner with this debt collection improvement plan our key performance indicators for balance sheet professional pdf. Use them to share invaluable insights on current assets, current liabilities, total assets, total liabilities and impress your audience. This template can be altered and modified as per your expectations. So, grab it now.

Flowchart Indicating Legacy Cloud Platform Migration To Cloud Platform Sample PDF
This slide shows steps of legacy application migration to new platform which contains environmental analysis, environment assessment, selecting tactic, final migration and evaluating resources. It can benefit users who are looking to move to more immersive and user-friendly platforms like cloud.Presenting Flowchart Indicating Legacy Cloud Platform Migration To Cloud Platform Sample PDF to dispense important information. This template comprises six stages. It also presents valuable insights into the topics including Plan Phase, Design Phase, Work Products. This is a completely customizable PowerPoint theme that can be put to use immediately. So, download it and address the topic impactfully.
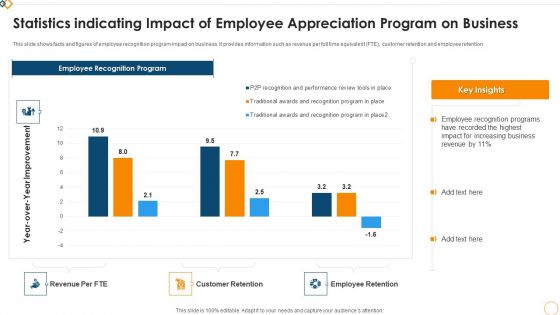
Statistics Indicating Impact Of Employee Appreciation Program On Business Graphics PDF
This slide shows facts and figures of employee recognition program impact on business. It provides information such as revenue per full time equivalent FTE, customer retention and employee retention. Showcasing this set of slides titled Statistics Indicating Impact Of Employee Appreciation Program On Business Graphics PDF. The topics addressed in these templates are Employee Recognition Program, Revenue Per FTE, Customer Retention. All the content presented in this PPT design is completely editable. Download it and make adjustments in color, background, font etc. as per your unique business setting.

Finance Metrics Dashboard Indicating Account Receivable And Account Payable Demonstration PDF
This graph or chart is linked to excel, and changes automatically based on data. Just left click on it and select edit data. Showcasing this set of slides titled Finance Metrics Dashboard Indicating Account Receivable And Account Payable Demonstration PDF. The topics addressed in these templates are Total Accounts Receivable, Total Accounts Payable, Recommended Payment Timeline, Monthly Cash Flow. All the content presented in this PPT design is completely editable. Download it and make adjustments in color, background, font etc. as per your unique business setting.
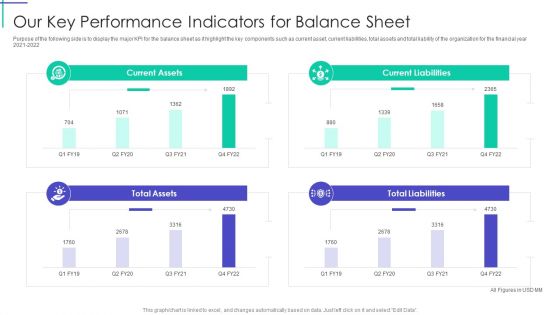
Mortgage Recovery Strategy For Finance Companies Our Key Performance Indicators For Balance Sheet Inspiration PDF
Purpose of the following side is to display the major KPI for the balance sheet as it highlight the key components such as current asset, current liabilities, total assets and total liability of the organization for the financial year 2021 to 2022. Deliver an awe inspiring pitch with this creative Mortgage Recovery Strategy For Finance Companies Our Key Performance Indicators For Balance Sheet Inspiration PDF bundle. Topics like Current Assets, Current Liabilities, Total Liabilities can be discussed with this completely editable template. It is available for immediate download depending on the needs and requirements of the user.
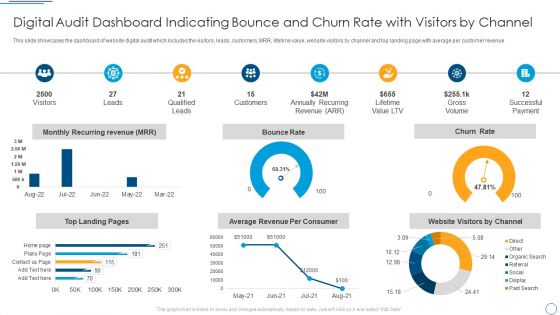
Digital Audit Dashboard Indicating Bounce And Churn Rate With Visitors By Channel Demonstration PDF
This slide showcases the dashboard of website digital audit which includes the visitors, leads, customers, MRR, lifetime value, website visitors by channel and top landing page with average per customer revenue.Deliver and pitch your topic in the best possible manner with this Digital Audit Dashboard Indicating Bounce And Churn Rate With Visitors By Channel Demonstration PDF. Use them to share invaluable insights on Qualified Leads, Annually Recurring, Successful Payment and impress your audience. This template can be altered and modified as per your expectations. So, grab it now.

Website And Social Media Digital Audit Dashboard Indicating Bounce And Churn Rate Template PDF
This slide showcases the dashboard of website digital audit which includes the visitors, leads, customers, MRR, lifetime value, website visitors by channel and top landing page with average per customer revenue. Deliver and pitch your topic in the best possible manner with this Website And Social Media Digital Audit Dashboard Indicating Bounce And Churn Rate Template PDF. Use them to share invaluable insights on Monthly Recurring Revenue, Bounce Rate, Churn Rate and impress your audience. This template can be altered and modified as per your expectations. So, grab it now.
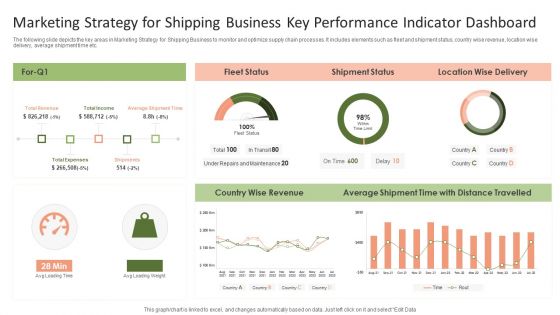
Marketing Strategy For Shipping Business Key Performance Indicator Dashboard Graphics PDF
The following slide depicts the key areas in Marketing Strategy for Shipping Business to monitor and optimize supply chain processes. It includes elements such as fleet and shipment status, country wise revenue, location wise delivery, average shipment time etc.Pitch your topic with ease and precision using this Marketing Strategy For Shipping Business Key Performance Indicator Dashboard Graphics PDF. This layout presents information on Shipment Status, Average Shipment, Wise Revenue. It is also available for immediate download and adjustment. So, changes can be made in the color, design, graphics or any other component to create a unique layout.
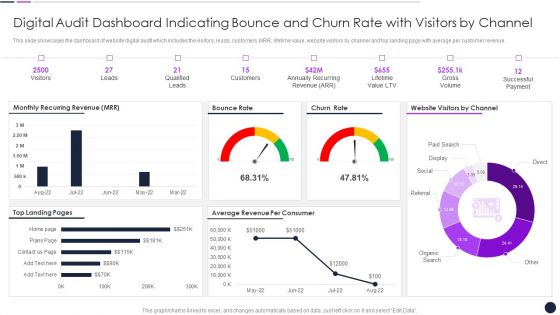
Digital Audit Dashboard Indicating Bounce And Churn Rate With Visitors By Channel Inspiration PDF
This slide showcases the dashboard of website digital audit which includes the visitors, leads, customers, MRR, lifetime value, website visitors by channel and top landing page with average per customer revenue.Deliver and pitch your topic in the best possible manner with this Digital Audit Dashboard Indicating Bounce And Churn Rate With Visitors By Channel Inspiration PDF. Use them to share invaluable insights on Qualified Leads, Annually Recurring, Lifetime Value and impress your audience. This template can be altered and modified as per your expectations. So, grab it now.

Digital Audit Dashboard Indicating Bounce And Churn Rate With Visitors By Channel Information PDF
This slide showcases the dashboard of website digital audit which includes the visitors, leads, customers, MRR, lifetime value, website visitors by channel and top landing page with average per customer revenue. Deliver an awe inspiring pitch with this creative Digital Audit Dashboard Indicating Bounce And Churn Rate With Visitors By Channel Information PDF bundle. Topics like Monthly Recurring Revenue, Bounce Rate, Churn Rate can be discussed with this completely editable template. It is available for immediate download depending on the needs and requirements of the user.

Service Level Agreement KPI Dashboard Indicating Violation Count And Overdue Requests Diagrams PDF
This graph or chart is linked to excel, and changes automatically based on data. Just left click on it and select Edit Data. Showcasing this set of slides titled Service Level Agreement KPI Dashboard Indicating Violation Count And Overdue Requests Diagrams PDF. The topics addressed in these templates are Total Requests Category, Total Requests Status, Urgent Requests. All the content presented in this PPT design is completely editable. Download it and make adjustments in color, background, font etc. as per your unique business setting.

Assessment Matrix Indicating Impact Of Technologies On Insider Threat In Cyber Security Use Cases Themes PDF
This slide shows technologies impact matrix for insider threat use cases. It contains details such as firewalls, data loss prevention, SIEM, user behavior analytics, process control system, etc. Showcasing this set of slides titled Assessment Matrix Indicating Impact Of Technologies On Insider Threat In Cyber Security Use Cases Themes PDF. The topics addressed in these templates are Key Insider, Threat, Use Cases, Key Technologies. All the content presented in this PPT design is completely editable. Download it and make adjustments in color, background, font etc. as per your unique business setting.

Key Performance Indicator For Sales And Marketing Business Plan Review Brochure PDF
The following slide showcases components of various department to track record and make further improvement plans. The key departments covered are marketing, sales and workforce and their status and owner. Pitch your topic with ease and precision using this Key Performance Indicator For Sales And Marketing Business Plan Review Brochure PDF. This layout presents information on Marketing, Sales, Workforce. It is also available for immediate download and adjustment. So, changes can be made in the color, design, graphics or any other component to create a unique layout.
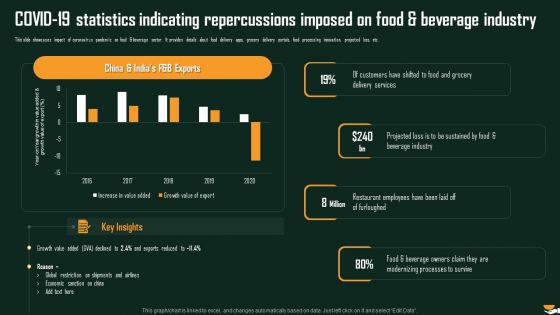
COVID 19 Statistics Indicating Repercussions Imposed On Food And Beverage Industry Demonstration PDF
This slide showcases impact of coronavirus pandemic on food beverage sector. It provides details about food delivery apps, grocery delivery portals, food processing innovation, projected loss, etc. Deliver and pitch your topic in the best possible manner with this COVID 19 Statistics Indicating Repercussions Imposed On Food And Beverage Industry Demonstration PDF. Use them to share invaluable insights on Delivery Services, Beverage Industry, Sustained Food and impress your audience. This template can be altered and modified as per your expectations. So, grab it now.
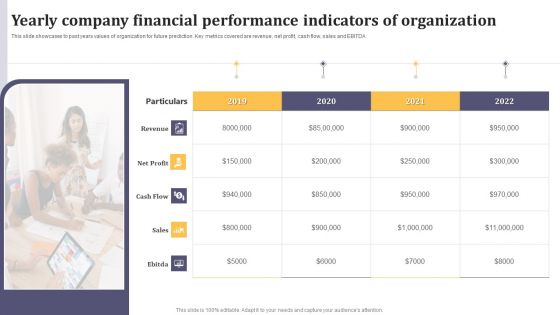
Yearly Company Financial Performance Indicators Of Organization Ppt Infographics Outline PDF
This slide showcases to past years values of organization for future prediction. Key metrics covered are revenue, net profit, cash flow, sales and EBITDA. Persuade your audience using this Yearly Company Financial Performance Indicators Of Organization Ppt Infographics Outline PDF. This PPT design covers five stages, thus making it a great tool to use. It also caters to a variety of topics including Revenue, Net Profit, Cash Flow. Download this PPT design now to present a convincing pitch that not only emphasizes the topic but also showcases your presentation skills.

Company Financial Performance Indicators Dashboard With Liquidity And Turnover Ratios Formats PDF
This graph or chart is linked to excel, and changes automatically based on data. Just left click on it and select Edit Data. Pitch your topic with ease and precision using this Company Financial Performance Indicators Dashboard With Liquidity And Turnover Ratios Formats PDF. This layout presents information on Cash Balance, Days Inventory Outstanding, Days Payable Outstanding. It is also available for immediate download and adjustment. So, changes can be made in the color, design, graphics or any other component to create a unique layout.

5 R2R Key Performance Indicators Ppt PowerPoint Presentation Model Topics PDF
Following slide outlines critical R2R KPIs. Time to close, number of entry corrections, voice of transactions per FTE, growth of CA and process costs are some of the KPIs, which will assist accounts department to measure its overall performance.Showcasing this set of slides titled 5 R2R Key Performance Indicators Ppt PowerPoint Presentation Model Topics PDF. The topics addressed in these templates are Volume Transactions, Process Cost, Entry Corrections. All the content presented in this PPT design is completely editable. Download it and make adjustments in color, background, font etc. as per your unique business setting.
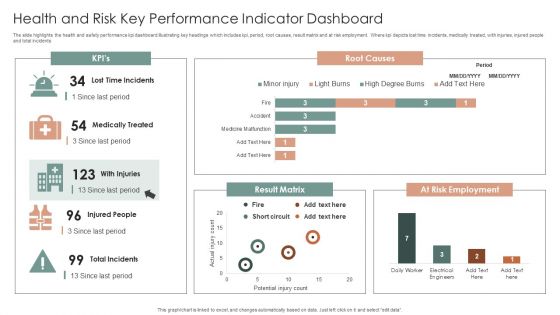
Health And Risk Key Performance Indicator Dashboard Ppt Layouts Graphics Design PDF
The slide highlights the health and safety performance kpi dashboard illustrating key headings which includes kpi, period, root causes, result matrix and at risk employment. Where kpi depicts lost time incidents, medically treated, with injuries, injured people and total incidents. Showcasing this set of slides titled Health And Risk Key Performance Indicator Dashboard Ppt Layouts Graphics Design PDF. The topics addressed in these templates are Root Causes, Result Matrix, At Risk Employment. All the content presented in this PPT design is completely editable. Download it and make adjustments in color, background, font etc. as per your unique business setting.

SLA KPL Dashboard Indicating Active Service Records Ppt Professional Graphics Example PDF
This graph or chart is linked to excel, and changes automatically based on data. Just left click on it and select Edit Data. Pitch your topic with ease and precision using this SLA KPL Dashboard Indicating Active Service Records Ppt Professional Graphics Example PDF. This layout presents information on Active Service Records, Highest Project Values, Highest Values. It is also available for immediate download and adjustment. So, changes can be made in the color, design, graphics or any other component to create a unique layout.

Strategic D And I Performance Indicators Roadmap Ppt PowerPoint Presentation Gallery Clipart PDF
The following slide showcases diversity and inclusion roadmap to attract and retain diverse range of talents. It includes performance improvements, inclusion and diversity. Persuade your audience using this Strategic D And I Performance Indicators Roadmap Ppt PowerPoint Presentation Gallery Clipart PDF. This PPT design covers three stages, thus making it a great tool to use. It also caters to a variety of topics including Performance Improvements, Inclusion, Diversity. Download this PPT design now to present a convincing pitch that not only emphasizes the topic but also showcases your presentation skills.
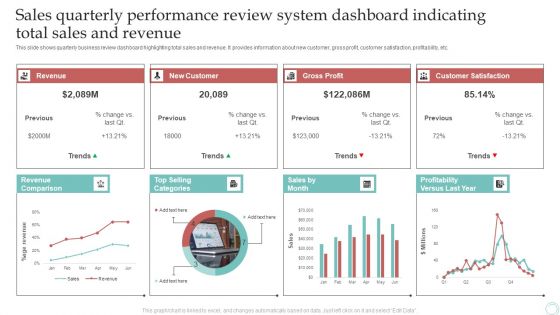
Sales Quarterly Performance Review System Dashboard Indicating Total Sales And Revenue Download PDF
This slide shows quarterly business review dashboard highlighting total sales and revenue. It provides information about new customer, gross profit, customer satisfaction, profitability, etc. Pitch your topic with ease and precision using this Sales Quarterly Performance Review System Dashboard Indicating Total Sales And Revenue Download PDF. This layout presents information on Revenue, New Customer, Gross Profit. It is also available for immediate download and adjustment. So, changes can be made in the color, design, graphics or any other component to create a unique layout.
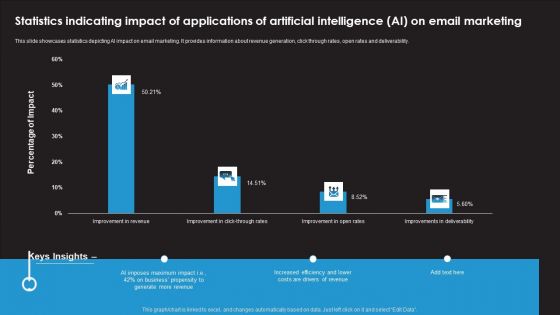
Statistics Indicating Impact Of Applications Of Artificial Intelligence AI On Email Marketing Inspiration PDF
This slide showcases statistics depicting AI impact on email marketing. It provides information about revenue generation, click through rates, open rates and deliverability. Showcasing this set of slides titled Statistics Indicating Impact Of Applications Of Artificial Intelligence AI On Email Marketing Inspiration PDF. The topics addressed in these templates are AI Imposes Maximum Impact, Business Propensity, Increased Efficiency. All the content presented in this PPT design is completely editable. Download it and make adjustments in color, background, font etc. as per your unique business setting.

 Home
Home