Bar Graph
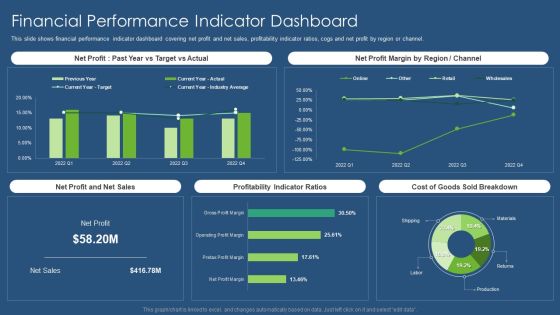
Sustainability Calculation With KPI Financial Performance Indicator Dashboard Infographics PDF Template PDF
This slide shows financial performance indicator dashboard covering net profit and net sales, profitability indicator ratios, cogs and net profit by region or channel. Deliver an awe inspiring pitch with this creative sustainability calculation with kpi financial performance indicator dashboard infographics pdf bundle. Topics like net profit margin, net profit and net sales, profitability indicator ratios, sold breakdown can be discussed with this completely editable template. It is available for immediate download depending on the needs and requirements of the user.

Best Techniques To Enhance New Product Management Efficiency Impact Of Product Differentiation Template PDF
This slide covers impact of product differentiation strategy on customer experience by completing target and improving customer experience rate in twelve months. Deliver an awe inspiring pitch with this creative best techniques to enhance new product management efficiency how to create product demonstration pdf bundle. Topics like impact of product differentiation strategy on customer experience can be discussed with this completely editable template. It is available for immediate download depending on the needs and requirements of the user.
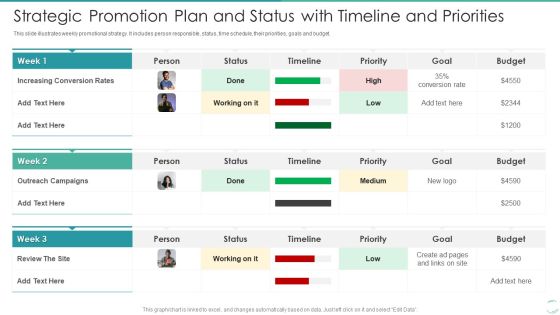
Strategic Promotion Plan And Status With Timeline And Priorities Template PDF
This slide illustrates weekly promotional strategy. It includes person responsible, status, time schedule, their priorities, goals and budget. Pitch your topic with ease and precision using this Strategic Promotion Plan And Status With Timeline And Priorities Template PDF. This layout presents information on Budget, Goal, Increasing Conversion Rates. It is also available for immediate download and adjustment. So, changes can be made in the color, design, graphics or any other component to create a unique layout.

Company Income Bridge With Sales And Marketing Ppt PowerPoint Presentation Gallery Templates PDF
This slide showcase company revenue bridge with sales and marketing which includes gross revenue, gross income, operating income and taxes. Pitch your topic with ease and precision using this Company Income Bridge With Sales And Marketing Ppt PowerPoint Presentation Gallery Templates PDF. This layout presents information on Gross Revenue, Net Revenue, Rev Adjustments. It is also available for immediate download and adjustment. So, changes can be made in the color, design, graphics or any other component to create a unique layout.
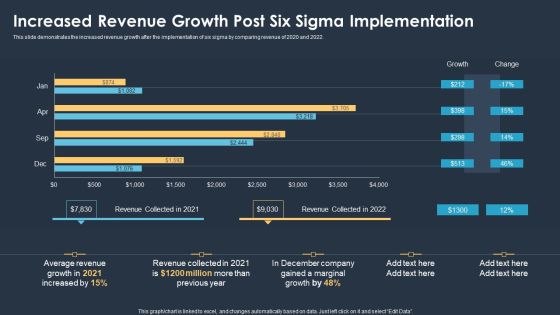
Six Sigma Methodologies For Process Optimization Increased Revenue Growth Post Six Sigma Implementation Template PDF
This slide demonstrates the increased revenue growth after the implementation of six sigma by comparing revenue of 2020 and 2022. Pitch your topic with ease and precision using this Six Sigma Methodologies For Process Optimization Increased Revenue Growth Post Six Sigma Implementation Template PDF. This layout presents information on Average Revenue Growth, Marginal Growth. It is also available for immediate download and adjustment. So, changes can be made in the color, design, graphics or any other component to create a unique layout.

Financial Summary Report For Organizational Activities Ppt Summary Graphics Template PDF
This slide represents financial statement snapshot showcasing organizational activities. It covers public support, expenditure, assets, liabilities and net assets. Pitch your topic with ease and precision using this Financial Summary Report For Organizational Activities Ppt Summary Graphics Template PDF. This layout presents information on Public Support, Other Revenue, Expenses. It is also available for immediate download and adjustment. So, changes can be made in the color, design, graphics or any other component to create a unique layout.

Strategies To Select Effective Trade Off Between Profit And Demand For Optimal Price Template PDF
Make sure to capture your audiences attention in your business displays with our gratis customizable Strategies To Select Effective Trade Off Between Profit And Demand For Optimal Price Template PDF. These are great for business strategies, office conferences, capital raising or task suggestions. If you desire to acquire more customers for your tech business and ensure they stay satisfied, create your own sales presentation with these plain slides.

Methods And Approaches To Assess Liquidity Ratios To Evaluate Company Ability To Pay Short Template PDF
The following slide outlines different liquidity ratios through which financial managers can evaluate the company ability to meet short-term debt. Information covered in this slide is related to current and quick ratio of our company and industry leaders. Presenting this PowerPoint presentation, titled Methods And Approaches To Assess Liquidity Ratios To Evaluate Company Ability To Pay Short Template PDF, with topics curated by our researchers after extensive research. This editable presentation is available for immediate download and provides attractive features when used. Download now and captivate your audience. Presenting this Methods And Approaches To Assess Liquidity Ratios To Evaluate Company Ability To Pay Short Template PDF. Our researchers have carefully researched and created these slides with all aspects taken into consideration. This is a completely customizable Methods And Approaches To Assess Liquidity Ratios To Evaluate Company Ability To Pay Short Template PDF that is available for immediate downloading. Download now and make an impact on your audience. Highlight the attractive features available with our PPTs.

Best Time And Day To Post Content On Facebook Ppt PowerPoint Presentation Diagram Templates PDF
The following slide outlines optimal time and day of week when brands should publish content on Facebook page to reach and engage with maximum number of people. Posting content at right time can assist companies in increasing organic reach and customer engagement. Presenting this PowerPoint presentation, titled Best Time And Day To Post Content On Facebook Ppt PowerPoint Presentation Diagram Templates PDF, with topics curated by our researchers after extensive research. This editable presentation is available for immediate download and provides attractive features when used. Download now and captivate your audience. Presenting this Best Time And Day To Post Content On Facebook Ppt PowerPoint Presentation Diagram Templates PDF. Our researchers have carefully researched and created these slides with all aspects taken into consideration. This is a completely customizable Best Time And Day To Post Content On Facebook Ppt PowerPoint Presentation Diagram Templates PDF that is available for immediate downloading. Download now and make an impact on your audience. Highlight the attractive features available with our PPTs.

Investment Portfolio Report Template With Numbers Ppt PowerPoint Presentation Gallery Grid PDF
This slide showcase the dashboard of investment portfolio. KPIs included in the dashboard are total invested amount, number of investment, rate of return, yearly total investment and rating group wise total investment. Pitch your topic with ease and precision using this investment portfolio report template with numbers ppt powerpoint presentation gallery grid pdf. This layout presents information on total invested amount, number of investment, rate of return. It is also available for immediate download and adjustment. So, changes can be made in the color, design, graphics or any other component to create a unique layout.

Business Cashflow Predictive For Operating Financial And Investing Activities Ppt Inspiration Infographic Template PDF
The following slide highlights the business cashflow forecast with for operating financial and investing activities illustrating key headings which includes key headings which includes cashflow statement, revenue, net income, free cash flow and cash balance. Pitch your topic with ease and precision using this business cashflow predictive for operating financial and investing activities ppt inspiration infographic template pdf. This layout presents information on revenue, net income, free cash flow, cash balance, 2020 to 2024. It is also available for immediate download and adjustment. So, changes can be made in the color, design, graphics or any other component to create a unique layout.
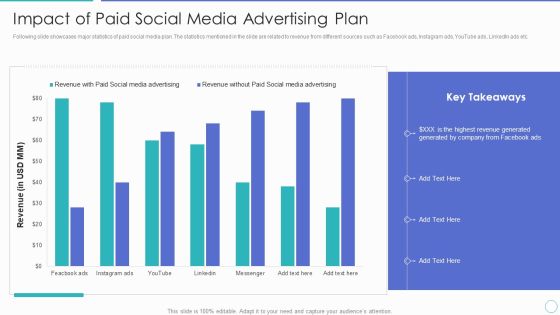
Impact Of Paid Social Media Advertising Plan Ppt PowerPoint Presentation Gallery Template PDF
Following slide showcases major statistics of paid social media plan. The statistics mentioned in the slide are related to revenue from different sources such as Facebook ads, Instagram ads, YouTube ads, LinkedIn ads etc. Pitch your topic with ease and precision using this impact of paid social media advertising plan ppt powerpoint presentation gallery template pdf. This layout presents information on highest revenue generated, revenue with paid social media advertising, revenue without paid social media advertising. It is also available for immediate download and adjustment. So, changes can be made in the color, design, graphics or any other component to create a unique layout.

Backlog Management Dashboard With List Of Projects And Issues Template PDF
This slide showcases project backlog management dashboard highlighting major problems. It provides information about story, task, bug, engaged users, design backlog, activity, additions, sprints, etc. Pitch your topic with ease and precision using this Backlog Management Dashboard With List Of Projects And Issues Template PDF. This layout presents information on Backlog Management Dashboard With List Of Projects And Issues. It is also available for immediate download and adjustment. So, changes can be made in the color, design, graphics or any other component to create a unique layout.

Health And Safety Performance Measurements Dashboard With Employee Stats Template PDF
This slide comprises of many types of activities that have taken place in an organization in terms of the safety and it also shows how the employees performance are going on in terms of safety . It includes training hours, total man-hour , severity of the accidents , etc.Pitch your topic with ease and precision using this Health And Safety Performance Measurements Dashboard With Employee Stats Template PDF This layout presents information on Safety Observation, Injuries Frequency, Unsafe Conditions It is also available for immediate download and adjustment. So, changes can be made in the color, design, graphics or any other component to create a unique layout.

Dashboard Of Property Operations And Maintenance Ppt Infographic Template Objects PDF
This slide focuses on maintenance dashboard for certified reliability engineer which covers team efficiency, cumulative savings, planned maintenance, chiller performance analysis, portfolio comparison, alarm and fault diagnostics, etc. Pitch your topic with ease and precision using this Dashboard Of Property Operations And Maintenance Ppt Infographic Template Objects PDF. This layout presents information on Planned Maintenance Efficiency, Chiller Performance Analysis, Portfolio Comparison Team, Alarm And Fault. It is also available for immediate download and adjustment. So, changes can be made in the color, design, graphics or any other component to create a unique layout.

Business Excellence For Customer Growth And To Enhance Customer Relationships Ppt Infographic Template Styles PDF
This slide covers key drivers to improve customer interactions. It includes parameters such as identifying customer needs, market revenue share growth, supply chain performance, technological improvements, etc. Pitch your topic with ease and precision using this Business Excellence For Customer Growth And To Enhance Customer Relationships Ppt Infographic Template Styles PDF. This layout presents information on Business Excellence, Customer Growth, Customer Relationships. It is also available for immediate download and adjustment. So, changes can be made in the color, design, graphics or any other component to create a unique layout.

Employee Survey Results For Flexible Work Advantages Ppt Infographic Template Guidelines PDF
This slide shows the percentage wise results of survey conducted for employees regarding the advantages of flexible working culture. It includes main categories of adjustable work schedule, no travelling, family time and other advantages such as work life balance and focusing on physical health etc. Pitch your topic with ease and precision using this Employee Survey Results For Flexible Work Advantages Ppt Infographic Template Guidelines PDF. This layout presents information on Key Insights, Family Time, Adjustable Work Schedule, No Travelling. It is also available for immediate download and adjustment. So, changes can be made in the color, design, graphics or any other component to create a unique layout.

Logistics KPI Status Dashboard With Monthly KPI Ppt Infographic Template Layout PDF
The following slide highlights the transportation status dashboard with monthly KPI illustrating order status with customer, order date and delivery date. It shows financial performance for four quarters as well as todays order, inventory and monthly KPI with Inventory, shipping cost for past 30 days. Pitch your topic with ease and precision using this Logistics KPI Status Dashboard With Monthly KPI Ppt Infographic Template Layout PDF. This layout presents information on Order Status, Today Order, Inventory, Monthly KPI. It is also available for immediate download and adjustment. So, changes can be made in the color, design, graphics or any other component to create a unique layout.
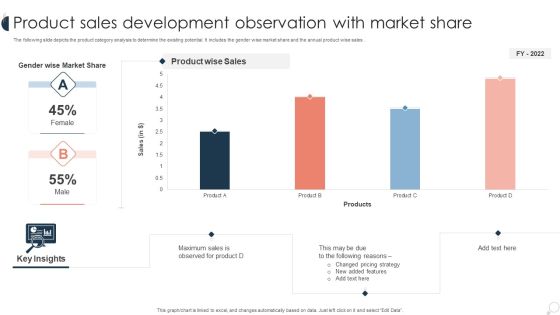
Product Sales Development Observation With Market Share Ppt PowerPoint Presentation Infographic Template Guide PDF
The following slide depicts the product category analysis to determine the existing potential. It includes the gender wise market share and the annual product wise sales . Pitch your topic with ease and precision using this Product Sales Development Observation With Market Share Ppt PowerPoint Presentation Infographic Template Guide PDF. This layout presents information on Changed Pricing, Observed For Product, Product Wise. It is also available for immediate download and adjustment. So, changes can be made in the color, design, graphics or any other component to create a unique layout.

Key Insights Of Digital Marketing Administration Ppt PowerPoint Presentation Styles Graphics Template PDF
The following slide highlights the KPIs of digital marketing to assess ROI. It includes monthly active user rate, customer retention rate at the end of the year, current vs previous active users, quarterly growth rate etc.Pitch your topic with ease and precision using this Key Insights Of Digital Marketing Administration Ppt PowerPoint Presentation Styles Graphics Template PDF. This layout presents information on Possible Reasons, Content Marketing, Growth Rate. It is also available for immediate download and adjustment. So, changes can be made in the color, design, graphics or any other component to create a unique layout.

Patient Health And Risk Key Performance Indicator Dashboard Ppt Infographic Template Summary PDF
The following slide highlights the patient health and safety key performance indicator dashboard illustrating admission by department, admission by cost, patient satisfaction, total patients, operations cost, patient density, total staff, waiting time, treatment satisfaction and treatment confidence. Pitch your topic with ease and precision using this Patient Health And Risk Key Performance Indicator Dashboard Ppt Infographic Template Summary PDF. This layout presents information on Admission By Department, Admission Vs Cost, Patient Satisfaction. It is also available for immediate download and adjustment. So, changes can be made in the color, design, graphics or any other component to create a unique layout.

Cash Flow Metrics To Measure Firm Operations Effectiveness Ppt Outline Infographic Template PDF
This slide showcases yearly cash conversion cycle to determine companys working capital management. It includes DSO, DIO, DPO and CCC that measure the average number of days organization takes to collect payment and pay bills. Pitch your topic with ease and precision using this Cash Flow Metrics To Measure Firm Operations Effectiveness Ppt Outline Infographic Template PDF. This layout presents information on Cash Conversion Cycle, 2019 To 2022, Cash Flow. It is also available for immediate download and adjustment. So, changes can be made in the color, design, graphics or any other component to create a unique layout.
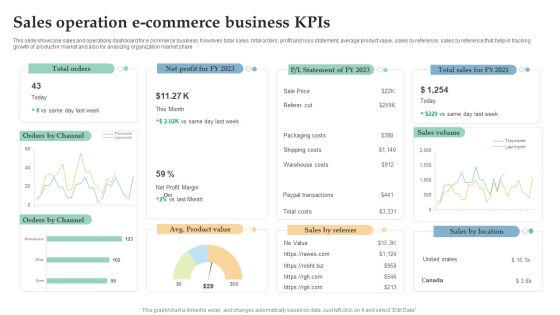
Sales Operation E Commerce Business Kpis Ppt Infographics Design Templates PDF
This slide showcase sales and operations dashboard for e commerce business. It involves total sales, total orders, profit and loss statement, average product value, sales by reference, sales by reference that help in tracking growth of product in market and also for analyzing organization market share. Pitch your topic with ease and precision using this Sales Operation E Commerce Business Kpis Ppt Infographics Design Templates PDF. This layout presents information on Total Orders, Sales Volume, Orders Channel. It is also available for immediate download and adjustment. So, changes can be made in the color, design, graphics or any other component to create a unique layout.

Contact Strategy Impact On Consumer Response Rate Ppt Icon Templates PDF
This slide covers positive customer insights on contact strategy. It enhances customer experience and increases the response and retention rates along with customer engagement. Pitch your topic with ease and precision using this Contact Strategy Impact On Consumer Response Rate Ppt Icon Templates PDF. This layout presents information on Customer Retention Rates, Quick Response Rate, Enhances Customer Experience. It is also available for immediate download and adjustment. So, changes can be made in the color, design, graphics or any other component to create a unique layout.
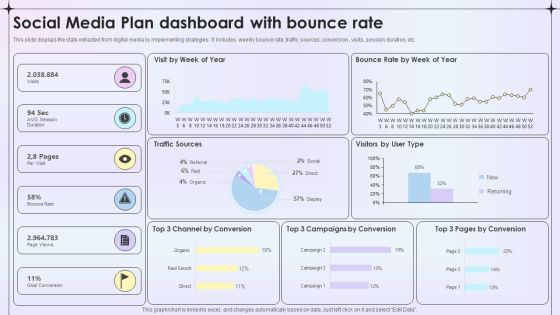
Social Media Plan Dashboard With Bounce Rate Ppt Ideas Graphics Template PDF
This slide displays the stats extracted from digital media by implementing strategies . It includes weekly bounce rate, traffic sources, conversion , visits, session duration, etc. Pitch your topic with ease and precision using this Social Media Plan Dashboard With Bounce Rate Ppt Ideas Graphics Template PDF. This layout presents information on Traffic Sources, Visitors User Type, Goal Conversion. It is also available for immediate download and adjustment. So, changes can be made in the color, design, graphics or any other component to create a unique layout.
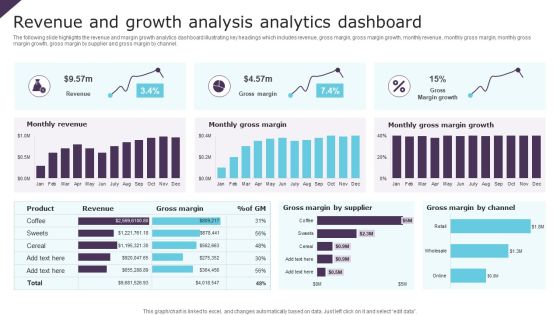
Revenue And Growth Analysis Analytics Dashboard Ppt Infographic Template Brochure PDF
The following slide highlights the revenue and margin growth analytics dashboard illustrating key headings which includes revenue, gross margin, gross margin growth, monthly revenue, monthly gross margin, monthly gross margin growth, gross margin by supplier and gross margin by channel. Pitch your topic with ease and precision using this Revenue And Growth Analysis Analytics Dashboard Ppt Infographic Template Brochure PDF. This layout presents information on Monthly Revenue, Monthly Gross Margin, Gross Margin Growth. It is also available for immediate download and adjustment. So, changes can be made in the color, design, graphics or any other component to create a unique layout.
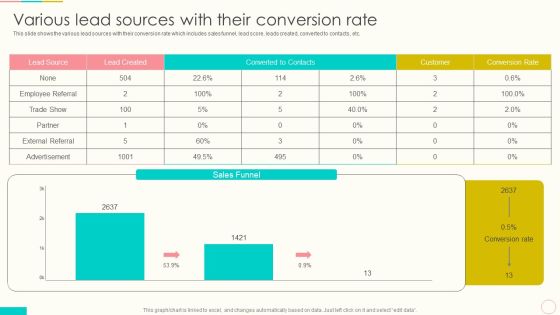
Lead Management To Engage Potential Customers Various Lead Sources With Their Conversion Rate Template PDF
This slide shows the various lead sources with their conversion rate which includes sales funnel, lead score, leads created, converted to contacts, etc. Take your projects to the next level with our ultimate collection of Lead Management To Engage Potential Customers Various Lead Sources With Their Conversion Rate Template PDF. Slidegeeks has designed a range of layouts that are perfect for representing task or activity duration, keeping track of all your deadlines at a glance. Tailor these designs to your exact needs and give them a truly corporate look with your own brand colors they will make your projects stand out from the rest.

CRM Team Dashboard Highlighting Major Web Based Platform Kpis Template PDF
This slide showcases customer relationship management CRM team dashboard indicating web portal KPIs. It provides information about cost per acquisition CPA, signups, channel, spend, etc. Pitch your topic with ease and precision using this CRM Team Dashboard Highlighting Major Web Based Platform Kpis Template PDF. This layout presents information on CRM Team Dashboard Highlighting, Web Based Platform Kpis. It is also available for immediate download and adjustment. So, changes can be made in the color, design, graphics or any other component to create a unique layout.

Kpi Dashboard To Track Applicant Selection Process Ppt PowerPoint Presentation File Graphics Template PDF
This slide shows dashboard which can be used to monitor the progress of recruitment process. It includes metrics such as applications received, shortlisted applicant, selected candidates, etc. Pitch your topic with ease and precision using this Kpi Dashboard To Track Applicant Selection Process Ppt PowerPoint Presentation File Graphics Template PDF. This layout presents information on Applications Received, Shortlisted Candidates, Selected Candidates. It is also available for immediate download and adjustment. So, changes can be made in the color, design, graphics or any other component to create a unique layout.
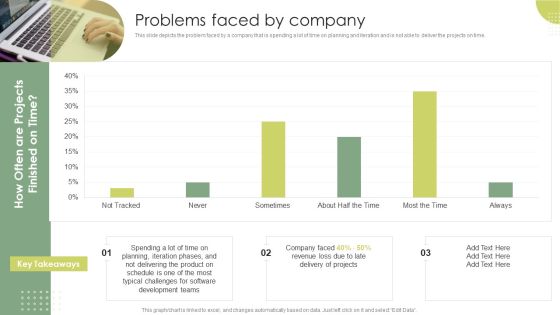
Problems Faced By Company Rapid Application Building RAB Model Template PDF
This slide depicts the problem faced by a company that is spending a lot of time on planning and iteration and is not able to deliver the projects on time.Make sure to capture your audiences attention in your business displays with our gratis customizable Problems Faced By Company Rapid Application Building RAB Model Template PDF. These are great for business strategies, office conferences, capital raising or task suggestions. If you desire to acquire more customers for your tech business and ensure they stay satisfied, create your own sales presentation with these plain slides.

Guide To Mergers And Acquisitions Post Merger And Acquisition Performance Gap Assessment Template PDF
Following slide shows the comparison of current versus target capabilities of the firm post merger and acquisition. It includes information about the companys score as well as a performance rating. Take your projects to the next level with our ultimate collection of Guide To Mergers And Acquisitions Post Merger And Acquisition Performance Gap Assessment Template PDF. Slidegeeks has designed a range of layouts that are perfect for representing task or activity duration, keeping track of all your deadlines at a glance. Tailor these designs to your exact needs and give them a truly corporate look with your own brand colors they will make your projects stand out from the rest.

KPI Dashboard For ESO System Ppt PowerPoint Presentation File Template PDF
This slide covers kpi dashboard for enterprise security operations. It involves details such as active alerts, active automated investigation, devices with major issues and report of daily devices. Pitch your topic with ease and precision using this KPI Dashboard For ESO System Ppt PowerPoint Presentation File Template PDF. This layout presents information on Security Health, Misconfigured, Service Operating Normally. It is also available for immediate download and adjustment. So, changes can be made in the color, design, graphics or any other component to create a unique layout.

Building Management Dashboard Highlighting Power Consumption And Occupancy Rate Template PDF
This slide showcases dashboard that can help organization to keep track of power consumed by machinery and occupancy rate during facility management. Its key components are HVAC, occupancy rate, service requests and temperature. Pitch your topic with ease and precision using this Building Management Dashboard Highlighting Power Consumption And Occupancy Rate Template PDF. This layout presents information on Lighting, Power, Water, Electricity, Temperature. It is also available for immediate download and adjustment. So, changes can be made in the color, design, graphics or any other component to create a unique layout.

Market Analysis Of Smart Farming Tech With Growth Drivers Template PDF
The following slide highlights smart farming tech market analysis with growth drivers to measure progress and track performance. It include growth drivers such as increase demand of weather monitoring system, increase in human resource investment and key insights such as estimated market value, forecasted revenue etc.Pitch your topic with ease and precision using this Market Analysis Of Smart Farming Tech With Growth Drivers Template PDF. This layout presents information on Estimated Growth, Estimated Market Value, Forecasted Revenue. It is also available for immediate download and adjustment. So, changes can be made in the color, design, graphics or any other component to create a unique layout.
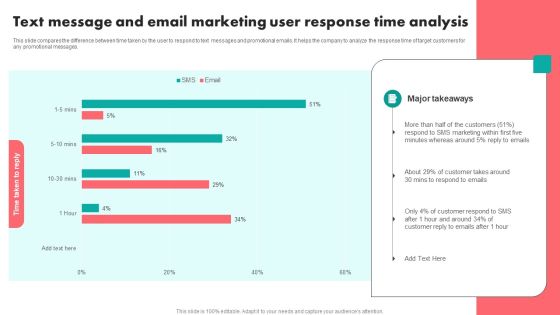
Text Message And Email Marketing User Response Time Analysis Template PDF
This slide compares the difference between time taken by the user to respond to text messages and promotional emails. It helps the company to analyze the response time of target customers for any promotional messages. Pitch your topic with ease and precision using this Text Message And Email Marketing User Response Time Analysis Template PDF. This layout presents information on Text Message, Email Marketing User, Response Time Analysis. It is also available for immediate download and adjustment. So, changes can be made in the color, design, graphics or any other component to create a unique layout.
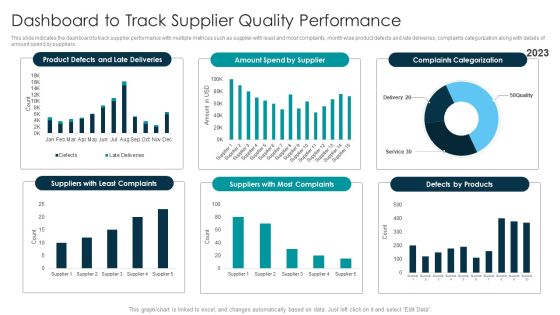
Tactical Approach For Vendor Reskilling Dashboard To Track Supplier Quality Performance Template PDF
This slide indicates the dashboard to track supplier performance with multiple metrices such as supplier with least and most complaints, month wise product defects and late deliveries, complaints categorization along with details of amount spend by suppliers. Make sure to capture your audiences attention in your business displays with our gratis customizable Tactical Approach For Vendor Reskilling Dashboard To Track Supplier Quality Performance Template PDF. These are great for business strategies, office conferences, capital raising or task suggestions. If you desire to acquire more customers for your tech business and ensure they stay satisfied, create your own sales presentation with these plain slides.

Product Marketing Plan To Enhance Organizational Growth Post Strategy Implementation Lead Conversion Rate Template PDF
This slide shows the forecasted positive impact of companys product marketing strategies on lead conversion rate. Additionally, it provides the key insights and reason behind the increase in lead conversion rate of the company.Make sure to capture your audiences attention in your business displays with our gratis customizable Product Marketing Plan To Enhance Organizational Growth Post Strategy Implementation Lead Conversion Rate Template PDF. These are great for business strategies, office conferences, capital raising or task suggestions. If you desire to acquire more customers for your tech business and ensure they stay satisfied, create your own sales presentation with these plain slides.

Retail Store Operations Overview Of Retail Stores Ppt Infographic Template File Formats PDF
This slide provides information regarding retail company in terms of headquarters, revenues, total number of employees, number of stores across USA. It also covers details of common operational challenges faced by stores. Take your projects to the next level with our ultimate collection of Retail Store Operations Overview Of Retail Stores Ppt Infographic Template File Formats PDF. Slidegeeks has designed a range of layouts that are perfect for representing task or activity duration, keeping track of all your deadlines at a glance. Tailor these designs to your exact needs and give them a truly corporate look with your own brand colors theyll make your projects stand out from the rest.

Robotic Process Automation Decreasing Management Efficiency Status In The Company Template PDF
This slide covers the current shipping and logistics management efficiency status in the company in terms of efficient and inefficient percentages. Make sure to capture your audiences attention in your business displays with our gratis customizable Robotic Process Automation Decreasing Management Efficiency Status In The Company Template PDF. These are great for business strategies, office conferences, capital raising or task suggestions. If you desire to acquire more customers for your tech business and ensure they stay satisfied, create your own sales presentation with these plain slides.

Plant Safety Measures Dashboard With Incidents Work Accidents And Near Misses Template PDF
This slide showcases dashboard to monitor plant safety measures performance indicators. Key metrics covered are incident and injury type, root cause, location, contributing factor, employees at risk and investigation. Pitch your topic with ease and precision using this Plant Safety Measures Dashboard With Incidents Work Accidents And Near Misses Template PDF. This layout presents information on Plant Safety Measures Dashboard, Incidents Work Accidents. It is also available for immediate download and adjustment. So, changes can be made in the color, design, graphics or any other component to create a unique layout.
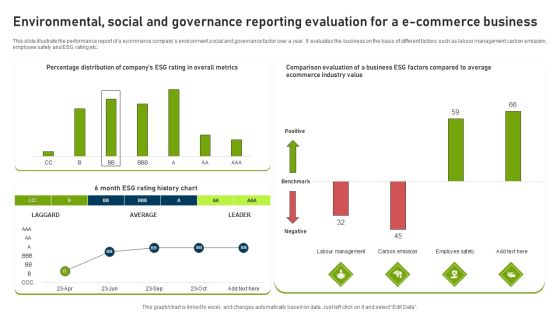
Environmental Social And Governance Reporting Evaluation For A E Commerce Business Template PDF
This slide illustrate the performance report of a ecommerce companys environment,social and governance factor over a year. It evaluates the business on the basis of different factors such as labour management,carbon emission, employee safety and ESG rating etc. Pitch your topic with ease and precision using this Environmental Social And Governance Reporting Evaluation For A E Commerce Business Template PDF. This layout presents information on Comparison Evaluation, Business, Ecommerce Industry Value. It is also available for immediate download and adjustment. So, changes can be made in the color, design, graphics or any other component to create a unique layout.

Criteria Checklist To Select Billing Software For Businesses Ppt PowerPoint Presentation Diagram Templates PDF
Following slide shows checklist to select suitable software based on various features. It includes pointers such as data storing, automate multiple payments, data backup, reporting mechanisms etc. Make sure to capture your audiences attention in your business displays with our gratis customizable Criteria Checklist To Select Billing Software For Businesses Ppt PowerPoint Presentation Diagram Templates PDF. These are great for business strategies, office conferences, capital raising or task suggestions. If you desire to acquire more customers for your tech business and ensure they stay satisfied, create your own sales presentation with these plain slides.
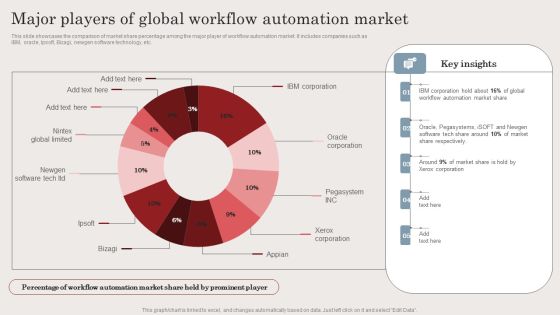
Major Players Of Global Workflow Automation Market Ppt Infographics Design Templates PDF
This slide showcases the comparison of market share percentage among the major player of workflow automation market. It includes companies such as IBM, oracle, Ipsoft, Bizagi, newgen software technology, etc. Take your projects to the next level with our ultimate collection of Major Players Of Global Workflow Automation Market Ppt Infographics Design Templates PDF. Slidegeeks has designed a range of layouts that are perfect for representing task or activity duration, keeping track of all your deadlines at a glance. Tailor these designs to your exact needs and give them a truly corporate look with your own brand colors they will make your projects stand out from the rest.

Business To Business Digital Channel Management B2B Sales Performance Tracking Dashboard Template PDF
This slide represents metric dashboard to track sales performance on e-commerce website. It cover performance indicators such as sales breakdown, order breakdown, recurring sales etc. Take your projects to the next level with our ultimate collection of Business To Business Digital Channel Management B2B Sales Performance Tracking Dashboard Template PDF. Slidegeeks has designed a range of layouts that are perfect for representing task or activity duration, keeping track of all your deadlines at a glance. Tailor these designs to your exact needs and give them a truly corporate look with your own brand colors they will make your projects stand out from the rest.

Business Strategy Consulting Solutions Company Outline Research And Development R And D Expenses Template PDF
This slide shows the research and development expenses incurred by our company in last five years in various areas such as technological change, software implementation, etc. to improve productivity and reduce additional costs. This Business Strategy Consulting Solutions Company Outline Research And Development R And D Expenses Template PDF from Slidegeeks makes it easy to present information on your topic with precision. It provides customization options, so you can make changes to the colors, design, graphics, or any other component to create a unique layout. It is also available for immediate download, so you can begin using it right away. Slidegeeks has done good research to ensure that you have everything you need to make your presentation stand out. Make a name out there for a brilliant performance.

Data Quality Dashboard For Linked Data Integrating Linked Data To Enhance Operational Template PDF
This slide describes the data quality dashboard for linked data by covering details of account information quality, contact details quality, financial data quality, and missing account information.This Data Quality Dashboard For Linked Data Integrating Linked Data To Enhance Operational Template PDF from Slidegeeks makes it easy to present information on your topic with precision. It provides customization options, so you can make changes to the colors, design, graphics, or any other component to create a unique layout. It is also available for immediate download, so you can begin using it right away. Slidegeeks has done good research to ensure that you have everything you need to make your presentation stand out. Make a name out there for a brilliant performance.
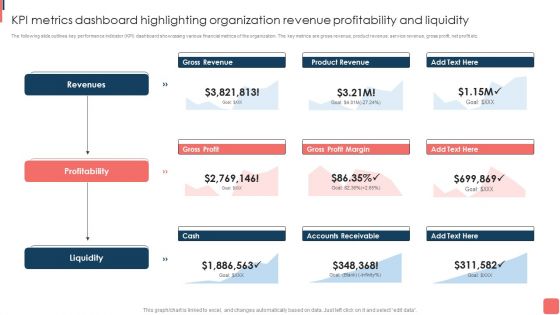
KPI Metrics Dashboard Highlighting Organization Revenue Profitability And Liquidity Template PDF
The following slide outlines key performance indicator KPI dashboard showcasing various financial metrics of the organization. The key metrics are gross revenue, product revenue, service revenue, gross profit, net profit etc. This KPI Metrics Dashboard Highlighting Organization Revenue Profitability And Liquidity Template PDF from Slidegeeks makes it easy to present information on your topic with precision. It provides customization options, so you can make changes to the colors, design, graphics, or any other component to create a unique layout. It is also available for immediate download, so you can begin using it right away. Slidegeeks has done good research to ensure that you have everything you need to make your presentation stand out. Make a name out there for a brilliant performance.

How To Boost Brand Recognition Brand Awareness Metrics Social Or Non Social Media Template PDF
This slide provides information regarding social or non-social media reach as brand awareness metrics. It helps in assessing brand awareness and recall. The slide also include key initiatives to enhance brand reach. This How To Boost Brand Recognition Brand Awareness Metrics Social Or Non Social Media Template PDF from Slidegeeks makes it easy to present information on your topic with precision. It provides customization options, so you can make changes to the colors, design, graphics, or any other component to create a unique layout. It is also available for immediate download, so you can begin using it right away. Slidegeeks has done good research to ensure that you have everything you need to make your presentation stand out. Make a name out there for a brilliant performance.
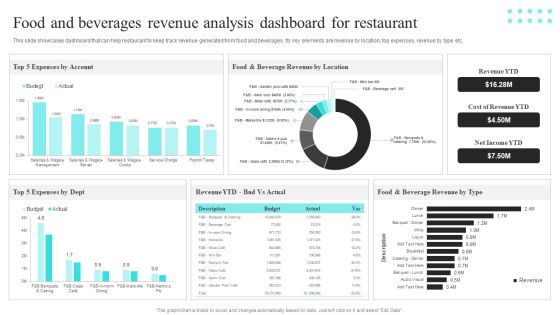
Strategic Promotional Guide For Restaurant Business Advertising Food And Beverages Revenue Analysis Dashboard Template PDF
This slide showcases dashboard that can help restaurant to keep track revenue generated from food and beverages. Its key elements are revenue by location, top expenses, revenue by type etc. This Strategic Promotional Guide For Restaurant Business Advertising Food And Beverages Revenue Analysis Dashboard Template PDF from Slidegeeks makes it easy to present information on your topic with precision. It provides customization options, so you can make changes to the colors, design, graphics, or any other component to create a unique layout. It is also available for immediate download, so you can begin using it right away. Slidegeeks has done good research to ensure that you have everything you need to make your presentation stand out. Make a name out there for a brilliant performance.
Marketers Guide To Data Analysis Optimization KPI Dashboard For Tracking SEO Analytics Template PDF
This slide covers the KPI dashboard for analyzing SEO metrics such as authority score, organic traffic, organic keywords, paid keywords, ref. Domains, site audit, link-building tool, organic traffic, on-page SEO checker, backlink audit, etc. This Marketers Guide To Data Analysis Optimization KPI Dashboard For Tracking SEO Analytics Template PDF from Slidegeeks makes it easy to present information on your topic with precision. It provides customization options, so you can make changes to the colors, design, graphics, or any other component to create a unique layout. It is also available for immediate download, so you can begin using it right away. Slidegeeks has done good research to ensure that you have everything you need to make your presentation stand out. Make a name out there for a brilliant performance.
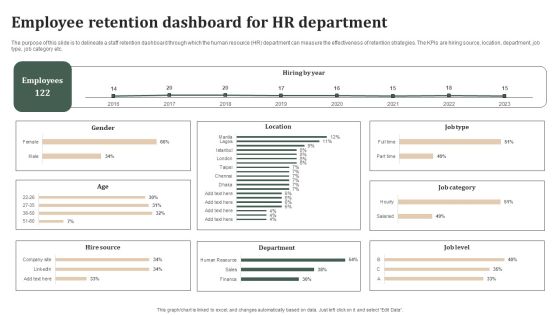
Successful Staff Retention Techniques Employee Retention Dashboard For Hr Department Template PDF
The purpose of this slide is to delineate a staff retention dashboard through which the human resource HR department can measure the effectiveness of retention strategies. The KPIs are hiring source, location, department, job type, job category etc. Take your projects to the next level with our ultimate collection of Successful Staff Retention Techniques Employee Retention Dashboard For Hr Department Template PDF. Slidegeeks has designed a range of layouts that are perfect for representing task or activity duration, keeping track of all your deadlines at a glance. Tailor these designs to your exact needs and give them a truly corporate look with your own brand colors they will make your projects stand out from the rest.

Digital Advertising Plan For Bakery Business Comparing Costs And Returns Template PDF
This slide provides glimpse about comparing costs of old advertising methods and new advertising methods to analyze and compare their effectiveness. It includes quarterly costs, expected returns, actual returns, etc. This Digital Advertising Plan For Bakery Business Comparing Costs And Returns Template PDF from Slidegeeks makes it easy to present information on your topic with precision. It provides customization options, so you can make changes to the colors, design, graphics, or any other component to create a unique layout. It is also available for immediate download, so you can begin using it right away. Slidegeeks has done good research to ensure that you have everything you need to make your presentation stand out. Make a name out there for a brilliant performance.

Definitive Guide To Conduct Digital Marketing Inspection Content Performance Tracking Dashboard For Social Media Template PDF
This slide indicates the content performance tracking dashboard for social media channels providing information regarding the total number of posts, engagement rate, audience sentiments and multiple hashtags performance. This Definitive Guide To Conduct Digital Marketing Inspection Content Performance Tracking Dashboard For Social Media Template PDF from Slidegeeks makes it easy to present information on your topic with precision. It provides customization options, so you can make changes to the colors, design, graphics, or any other component to create a unique layout. It is also available for immediate download, so you can begin using it right away. Slidegeeks has done good research to ensure that you have everything you need to make your presentation stand out. Make a name out there for a brilliant performance.

Corporate Training Program Forecasted Increase In Employees Productivity In Next 5 Years Template PDF
The following slide showcases the expected increase in employees productivity rate in next 5 years. Major reasons behind this forecast are technical trainings provided to employees and better employee management after leadership development training program. This Corporate Training Program Forecasted Increase In Company Revenue In Next 5 Years Demonstration PDF is perfect for any presentation, be it in front of clients or colleagues. It is a versatile and stylish solution for organizing your meetings. The Corporate Training Program Forecasted Increase In Company Revenue In Next 5 Years Demonstration PDF features a modern design for your presentation meetings. The adjustable and customizable slides provide unlimited possibilities for acing up your presentation. Slidegeeks has done all the homework before launching the product for you. So, do not wait, grab the presentation templates today

Customer Base After The Implementation Of The Strategies Ppt Infographic Template Influencers PDF
This slide shows the forecasted customer base of the company from 2020 to 2025. Additionally, it provides key insights such as reason behind the growth, CAGR of the

Formulating Plan And Executing Bid Projects Using Agile IT Determine Burndown Chart For Daily Progress Reporting Rules PDF
This slide provides information regarding release burndown chart as scrum tool for monitoring scrum project progress. Deliver an awe inspiring pitch with this creative formulating plan and executing bid projects using agile it determine burndown chart for daily progress reporting rules pdf bundle. Topics like determine burndown chart for daily progress reporting can be discussed with this completely editable template. It is available for immediate download depending on the needs and requirements of the user.

Determining The Most Important Leadership Skill To Succeed In Digital Workspace Ppt Infographic Template Example Topics PDF
Purpose of this slide is to addresses information statistics about the skills that a leader should have in order to successfully navigate digital transformation. Skills covered are transformative vision, forward thinking, change oriented etc. If you are looking for a format to display your unique thoughts, then the professionally designed Determining The Most Important Leadership Skill To Succeed In Digital Workspace Ppt Infographic Template Example Topics PDF is the one for you. You can use it as a Google Slides template or a PowerPoint template. Incorporate impressive visuals, symbols, images, and other charts. Modify or reorganize the text boxes as you desire. Experiment with shade schemes and font pairings. Alter, share or cooperate with other people on your work. Download Determining The Most Important Leadership Skill To Succeed In Digital Workspace Ppt Infographic Template Example Topics PDF and find out how to give a successful presentation. Present a perfect display to your team and make your presentation unforgettable.
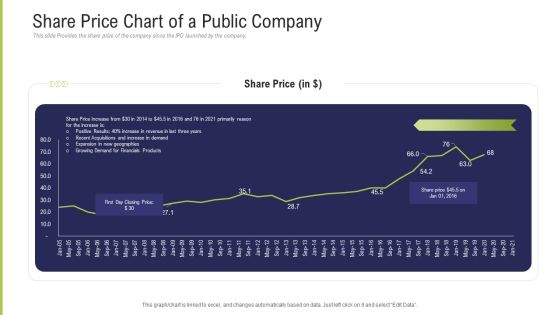
Funding Pitch Deck To Obtain Long Term Debt From Banks Share Price Chart Of A Public Company Topics PDF
This slide Provides the share prize of the company since the IPO launched by the company. Deliver and pitch your topic in the best possible manner with this funding pitch deck to obtain long term debt from banks share price chart of a public company topics pdf. Use them to share invaluable insights on share price chart of a public company and impress your audience. This template can be altered and modified as per your expectations. So, grab it now.
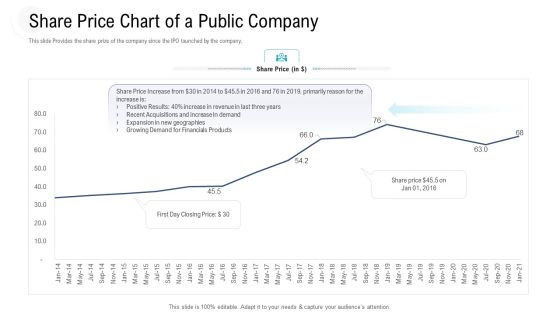
Investor Pitch Deck To Procure Federal Debt From Banks Share Price Chart Of A Public Company Sample PDF
This slide Provides the share prize of the company since the IPO launched by the company. Deliver and pitch your topic in the best possible manner with this investor pitch deck to procure federal debt from banks share price chart of a public company sample pdf. Use them to share invaluable insights on share price chart of a public company and impress your audience. This template can be altered and modified as per your expectations. So, grab it now.
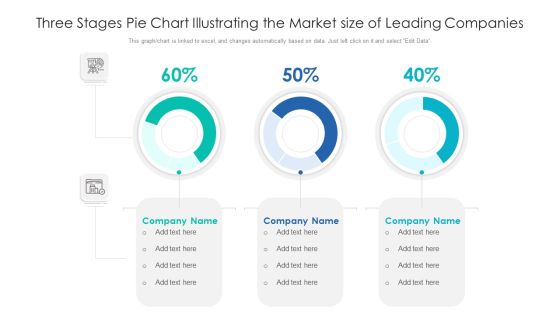
Three Stages Pie Chart Illustrating The Market Size Of Leading Companies Ppt PowerPoint Presentation Gallery Slide PDF
Showcasing this set of slides titled three stages pie chart illustrating the market size of leading companies ppt powerpoint presentation gallery slide pdf. The topics addressed in these templates are three stages pie chart illustrating the market size of leading companies. All the content presented in this PPT design is completely editable. Download it and make adjustments in color, background, font etc. as per your unique business setting.
 Home
Home