Bar Graph
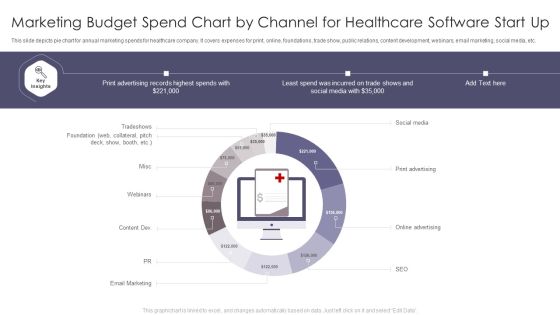
Marketing Budget Spend Chart By Channel For Healthcare Software Start Up Summary PDF
This slide depicts pie chart for annual marketing spends for healthcare company. It covers expenses for print, online, foundations, trade show, public relations, content development, webinars, email marketing, social media, etc. Showcasing this set of slides titled Marketing Budget Spend Chart By Channel For Healthcare Software Start Up Summary PDF. The topics addressed in these templates areTradeshows, Social Media, Print Advertising. All the content presented in this PPT design is completely editable. Download it and make adjustments in color, background, font etc. as per your unique business setting.

Software Budget Spend Pie Chart By Technology Start Ups Designs PDF
This slide depicts pie chart for expenditures on different software by tech companies. It includes developer tools, collaboration, CRM, Business productivity assessment, human resource management, customer support, etc. Showcasing this set of slides titled Software Budget Spend Pie Chart By Technology Start Ups Designs PDF. The topics addressed in these templates are Total Budget, Developer Tools, Total Budget. All the content presented in this PPT design is completely editable. Download it and make adjustments in color, background, font etc. as per your unique business setting.

Stacked Column Chart Techniques For Enhancing Buyer Acquisition Approach Ideas PDF
Get a simple yet stunning designed Stacked Column Chart Techniques For Enhancing Buyer Acquisition Approach Ideas PDF. It is the best one to establish the tone in your meetings. It is an excellent way to make your presentations highly effective. So, download this PPT today from Slidegeeks and see the positive impacts. Our easy-to-edit Stacked Column Chart Techniques For Enhancing Buyer Acquisition Approach Ideas PDF can be your go-to option for all upcoming conferences and meetings. So, what are you waiting for Grab this template today.

Sales Sales By Geographic Region Report With Doughnut Chart Themes PDF
This slide illustrates graphical representation of sales contribution of countries. It includes revenue of FY19 in percentage and numbers and revenue of FY20 in percentage and numbers. Showcasing this set of slides titled Sales Sales By Geographic Region Report With Doughnut Chart Themes PDF. The topics addressed in these templates are Revenue, Doughnut Chart, Geographic Region Report. All the content presented in this PPT design is completely editable. Download it and make adjustments in color, background, font etc. as per your unique business setting.
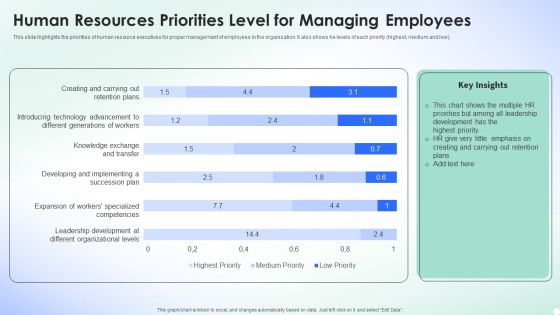
Human Resources Priorities Level For Managing Employees Template PDF
This slide highlights the priorities of human resource executives for proper management of employees in the organisation. It also shows he levels of each priority highest, medium and low. Pitch your topic with ease and precision using this Human Resources Priorities Level For Managing Employees Template PDF. This layout presents information on Leadership Development, Organizational Levels, Implementing. It is also available for immediate download and adjustment. So, changes can be made in the color, design, graphics or any other component to create a unique layout.

Sugar Manufacturing Industry Process Expenditure Ppt Infographic Template Information PDF
This slide covers the data related to the costs that an industry occur while manufacturing sugar. It shows the costing of each step or process shredding, milling, heating, clarification, evaporation, crystallization, etc. Pitch your topic with ease and precision using this Sugar Manufacturing Industry Process Expenditure Ppt Infographic Template Information PDF. This layout presents information on Sugar Manufactring Process, Cost, Sugar Production. It is also available for immediate download and adjustment. So, changes can be made in the color, design, graphics or any other component to create a unique layout.
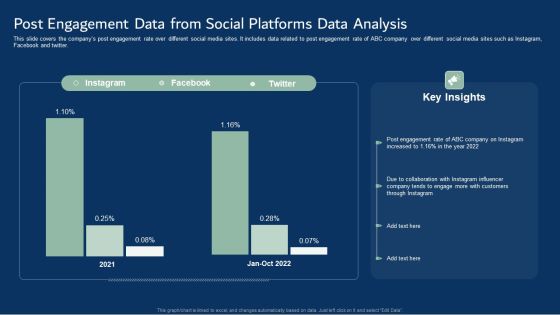
Post Engagement Data From Social Platforms Data Analysis Template PDF
This slide covers the companys post engagement rate over different social media sites. It includes data related to post engagement rate of ABC company over different social media sites such as Instagram, Facebook and twitter. Pitch your topic with ease and precision using this Post Engagement Data From Social Platforms Data Analysis Template PDF. This layout presents information on Post Engagement Data, Social Platforms Data Analysis. It is also available for immediate download and adjustment. So, changes can be made in the color, design, graphics or any other component to create a unique layout.
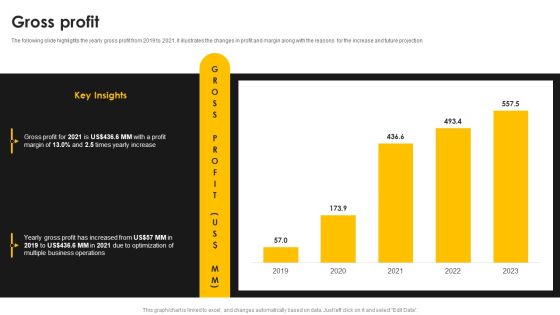
Kantar Consulting Company Outline Gross Profit Template PDF
The following slide highlights the yearly gross profit from 2019 to 2021. it illustrates the changes in profit and margin along with the reasons for the increase and future projection. Take your projects to the next level with our ultimate collection of Kantar Consulting Company Outline Gross Profit Template PDF. Slidegeeks has designed a range of layouts that are perfect for representing task or activity duration, keeping track of all your deadlines at a glance. Tailor these designs to your exact needs and give them a truly corporate look with your own brand colors they will make your projects stand out from the rest.

Financial Highlights For Construction Company Yearly Report Template PDF
This slide showcases report for construction company annual financial highlights that can help in analyzing the financial health of organization and help investors to make informed decisions. It outlines information about turnover, profit before tax, profit after, equity capital and reserves. Pitch your topic with ease and precision using this Financial Highlights For Construction Company Yearly Report Template PDF. This layout presents information on Reserve And Surplus, Profit, Turnover. It is also available for immediate download and adjustment. So, changes can be made in the color, design, graphics or any other component to create a unique layout.

Business Analytics Application Workforce Performance Analysis KPI Dashboard Template PDF
This slide represents the dashboard representing key metrics to analyze the performance of overall workforce. It includes details related to absence rate, benefits satisfaction, engagement index etc. Take your projects to the next level with our ultimate collection of Business Analytics Application Workforce Performance Analysis KPI Dashboard Template PDF. Slidegeeks has designed a range of layouts that are perfect for representing task or activity duration, keeping track of all your deadlines at a glance. Tailor these designs to your exact needs and give them a truly corporate look with your own brand colors theyll make your projects stand out from the rest.
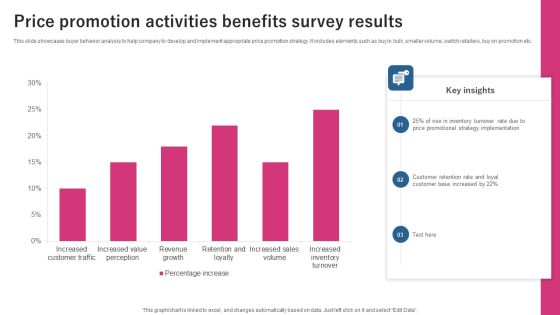
Price Promotion Activities Benefits Survey Results Ppt Inspiration Templates PDF
This slide showcases buyer behavior analysis to help company to develop and implement appropriate price promotion strategy. It includes elements such as buy in bulk, smaller volume, switch retailers, buy on promotion etc. Pitch your topic with ease and precision using this Price Promotion Activities Benefits Survey Results Ppt Inspiration Templates PDF. This layout presents information on Key Price, Promotional Strategy, Implementation. It is also available for immediate download and adjustment. So, changes can be made in the color, design, graphics or any other component to create a unique layout.
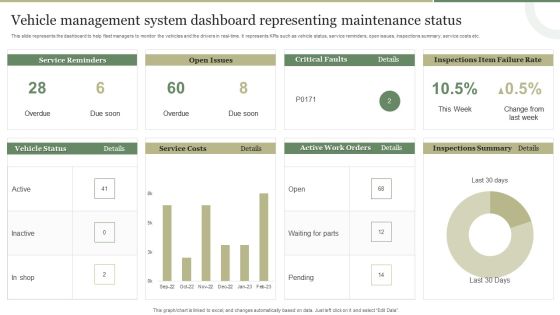
Vehicle Management System Dashboard Representing Maintenance Status Template PDF
This slide represents the dashboard representing the key metrics of the vehicle management system to monitor the vehicles and drivers in real-time. It includes key metrics such as service reminders, fuel costs, open issues, recent comments etc. Pitch your topic with ease and precision using this Vehicle Management System Dashboard Representing Maintenance Status Template PDF This layout presents information on Fuel Costs, Total Cost, Service Reminder, Recent Comments. It is also available for immediate download and adjustment. So, changes can be made in the color, design, graphics or any other component to create a unique layout.
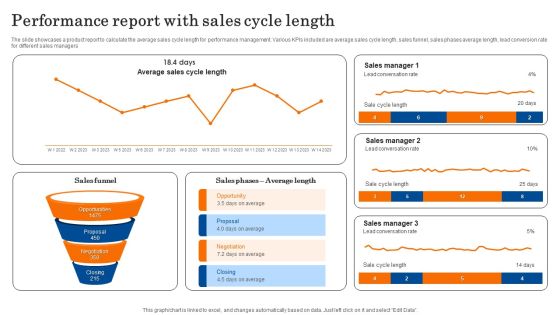
Performance Report With Sales Cycle Length Template PDF
The slide showcases a product report to calculate the average sales cycle length for performance management. Various KPIs included are average sales cycle length, sales funnel, sales phases average length, lead conversion rate for different sales managers. sPitch your topic with ease and precision using this Performance Report With Sales Cycle Length Template PDF. This layout presents information on Sales Manager, Conversation Rate, Opportunity. It is also available for immediate download and adjustment. So, changes can be made in the color, design, graphics or any other component to create a unique layout.
Logistics Management Time Tracking Dashboard With Warehousing Costs Template PDF
This slide showcases shipping dashboard that can help company to deliver the products in stipulated time and keep warehousing operating expenses within pre decided budget. Its also displays perfect order rate and total shipments by country. Pitch your topic with ease and precision using this Logistics Management Time Tracking Dashboard With Warehousing Costs Template PDF. This layout presents information on Warehouse Operating Costs, Perfect Order Rate, On Time Shipments. It is also available for immediate download and adjustment. So, changes can be made in the color, design, graphics or any other component to create a unique layout.

Dashboard Depicting Performance Metrics Of Customer Service Template PDF
This slide showcases dashboard depicting major customer service KPIs. The performance metrics covered are search exit rate, CSAT, average first response time, tickets solved, etc. Take your projects to the next level with our ultimate collection of Dashboard Depicting Performance Metrics Of Customer Service Template PDF. Slidegeeks has designed a range of layouts that are perfect for representing task or activity duration, keeping track of all your deadlines at a glance. Tailor these designs to your exact needs and give them a truly corporate look with your own brand colors they will make your projects stand out from the rest.
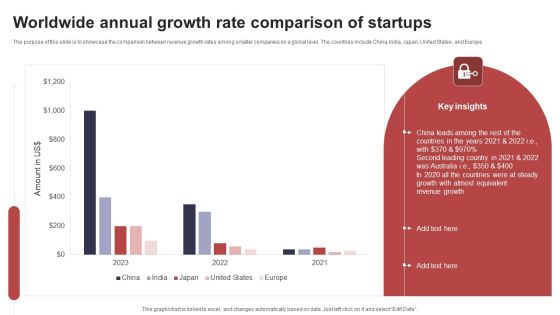
Worldwide Annual Growth Rate Comparison Of Startups Template PDF
The purpose of this slide is to showcase the comparison between revenue growth rates among smaller companies on a global level. The countries include China, India, Japan, United States, and Europe. Pitch your topic with ease and precision using this Worldwide Annual Growth Rate Comparison Of Startups Template PDF. This layout presents information on China Leads Among, Almost Equivalent, Revenue Growth. It is also available for immediate download and adjustment. So, changes can be made in the color, design, graphics or any other component to create a unique layout.

Major Abilities Required For Effective Corporate Communication Template PDF
The slide demonstrates a survey report highlighting the major communication skills required to share information within the organization. Various skills involved are non-verbal communication, written communication, emotional intelligence, etc. Pitch your topic with ease and precision using this Major Abilities Required For Effective Corporate Communication Template PDF. This layout presents information on Effective Communication, Skill Required, Boosts Teamwork. It is also available for immediate download and adjustment. So, changes can be made in the color, design, graphics or any other component to create a unique layout.
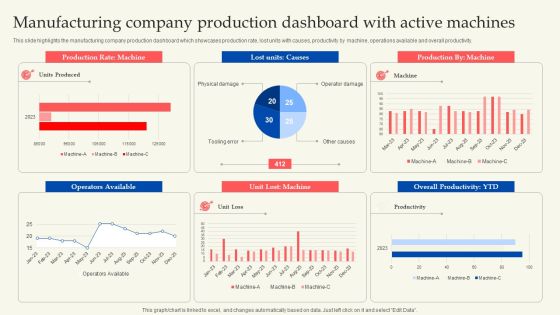
Manufacturing Company Production Dashboard With Active Machines Template PDF
This slide highlights the manufacturing company production dashboard which showcases production rate, lost units with causes, productivity by machine, operations available and overall productivity. Take your projects to the next level with our ultimate collection of Manufacturing Company Production Dashboard With Active Machines Template PDF. Slidegeeks has designed a range of layouts that are perfect for representing task or activity duration, keeping track of all your deadlines at a glance. Tailor these designs to your exact needs and give them a truly corporate look with your own brand colors they will make your projects stand out from the rest.

Vendor Quality Performance KPI Dashboard For Distributors Template PDF
This slide exhibits vendor performance annual dashboard that track supply chain strategies and reduce cost and increase margins. It includes elements such as purchasing value, quality performance, supplier wise purchase value, etc. Pitch your topic with ease and precision using this Vendor Quality Performance KPI Dashboard For Distributors Template PDF. This layout presents information on Purchase Value, Quality Performance, Supplier Wise Purchase Value. It is also available for immediate download and adjustment. So, changes can be made in the color, design, graphics or any other component to create a unique layout.
Global Medicare Outpatients Inpatients Kpi Dashboard Template PDF
This slide shows global healthcare KPIs related to outpatients-inpatients through dashboard. It include Key performance indicators such as average global patients, average treatment cost etc. Pitch your topic with ease and precision using this Global Medicare Outpatients Inpatients Kpi Dashboard Template PDF. This layout presents information on Average Treatment Cost, Average Global Patients, Average Available Staff. It is also available for immediate download and adjustment. So, changes can be made in the color, design, graphics or any other component to create a unique layout.
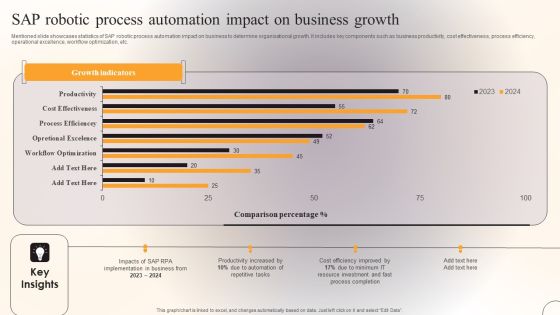
SAP Robotic Process Automation Impact On Business Growth Template PDF
Mentioned slide showcases statistics of SAP robotic process automation impact on business to determine organisational growth. It includes key components such as business productivity, cost effectiveness, process efficiency, operational excellence, workflow optimization, etc. Pitch your topic with ease and precision using this SAP Robotic Process Automation Impact On Business Growth Template PDF. This layout presents information on Productivity, Process Completion, Resource Investment. It is also available for immediate download and adjustment. So, changes can be made in the color, design, graphics or any other component to create a unique layout.

Chart For Online Bullying Incidents By Gender Ppt PowerPoint Presentation Summary Layout PDF
Showcasing this set of slides titled chart for online bullying incidents by gender ppt powerpoint presentation summary layout pdf. The topics addressed in these templates are verbal abuse or threats, bullying, harassment including sexual, unwanted sexual attention, physical violence. All the content presented in this PPT design is completely editable. Download it and make adjustments in color, background, font etc. as per your unique business setting.

Marketers Trends Chart With Real Time Mobile Transaction Ppt PowerPoint Presentation Outline Model PDF
Showcasing this set of slides titled marketers trends chart with real time mobile transaction ppt powerpoint presentation outline model pdf. The topics addressed in these templates are internet of things, real time mobile transactions, wearable technology, virtual augmented reality. All the content presented in this PPT design is completely editable. Download it and make adjustments in color, background, font etc. as per your unique business setting.
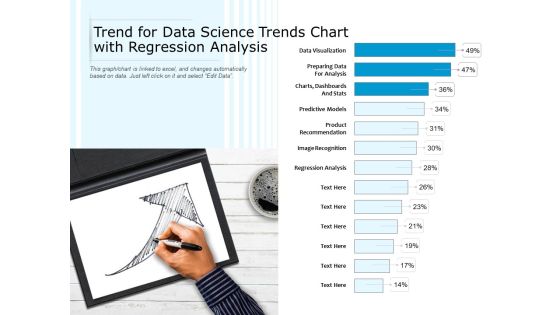
Trend For Data Science Trends Chart With Regression Analysis Ppt PowerPoint Presentation Visual Aids Layouts PDF
Showcasing this set of slides titled trend for data science trends chart with regression analysis ppt powerpoint presentation visual aids layouts pdf. The topics addressed in these templates are data visualization, preparing data for analysis, dashboards and stats, predictive models. All the content presented in this PPT design is completely editable. Download it and make adjustments in color, background, font etc. as per your unique business setting.
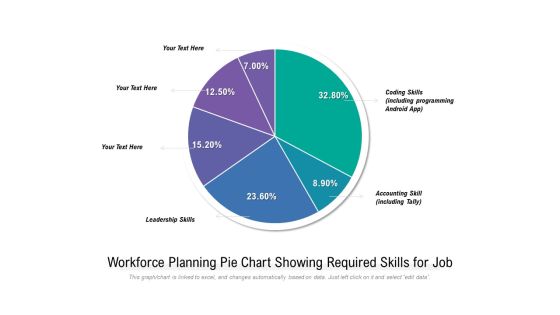
Workforce Planning Pie Chart Showing Required Skills For Job Ppt PowerPoint Presentation Infographics Example Introduction PDF
Showcasing this set of slides titled workforce planning pie chart showing required skills for job ppt powerpoint presentation infographics example introduction pdf. The topics addressed in these templates are Leadership Skills, Accounting Skill Including Tally, Coding Skills, Including Programming Android App. All the content presented in this PPT design is completely editable. Download it and make adjustments in color, background, font etc. as per your unique business setting.

Chart Illustrating The Various Steps Of New Business Funding Ppt PowerPoint Presentation Show Gridlines PDF
Showcasing this set of slides titled chart illustrating the various steps of new business funding ppt powerpoint presentation show gridlines pdf. The topics addressed in these templates are friend, family investment, business angels accelerators, next phase is categorized into following. All the content presented in this PPT design is completely editable. Download it and make adjustments in colour, background, font etc. as per your unique business setting.

Business Profile Of It Company With Financial Charts Ppt PowerPoint Presentation Model Ideas PDF
Deliver and pitch your topic in the best possible manner with this business profile of it company with financial charts ppt powerpoint presentation model ideas pdf. Use them to share invaluable insights on the company reported strong financials in last five years, operating income, net income and impress your audience. This template can be altered and modified as per your expectations. So, grab it now.
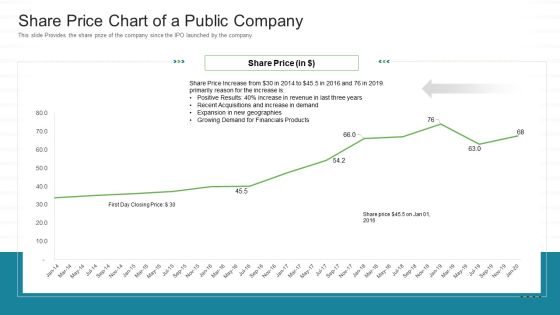
Investor Pitch Stock Market Launch Financial Institutions Share Price Chart Of A Public Company Sample PDF
This slide Provides the share prize of the company since the IPO launched by the company. Deliver and pitch your topic in the best possible manner with this investor pitch stock market launch financial institutions share price chart of a public company sample pdf. Use them to share invaluable insights on growing demand, financials products, share price and impress your audience. This template can be altered and modified as per your expectations. So, grab it now.
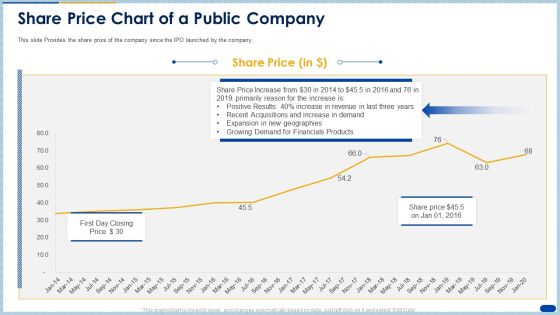
Raising Capital Banking Organizations Post Initial Offering Share Price Chart Of A Public Company Slides PDF
This slide Provides the share prize of the company since the IPO launched by the company. Deliver an awe inspiring pitch with this creative raising capital banking organizations post initial offering share price chart of a public company slides pdf bundle. Topics like growing demand, financials products, revenue can be discussed with this completely editable template. It is available for immediate download depending on the needs and requirements of the user.
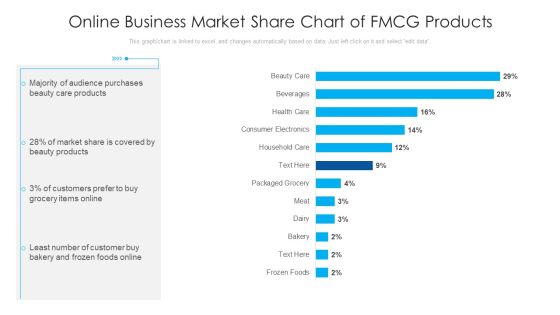
Online Business Market Share Chart Of Fmcg Products Ppt PowerPoint Presentation Portfolio Format Ideas PDF
Showcasing this set of slides titled online business market share chart of fmcg products ppt powerpoint presentation portfolio format ideas pdf. The topics addressed in these templates are majority of audience purchases, grocery items online, beauty care products. All the content presented in this PPT design is completely editable. Download it and make adjustments in color, background, font etc. as per your unique business setting.
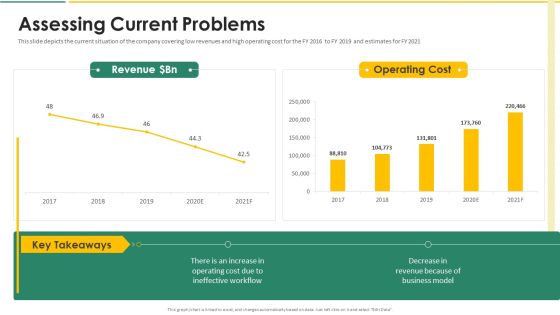
Organization Chart And Corporate Model Transformation Assessing Current Problems Information PDF
This slide depicts the current situation of the company covering low revenues and high operating cost for the FY 2016 to FY 2019 and estimates for FY 2021. Deliver an awe inspiring pitch with this creative organization chart and corporate model transformation assessing current problems information pdf bundle. Topics like revenue dollar bn, operating cost can be discussed with this completely editable template. It is available for immediate download depending on the needs and requirements of the user.
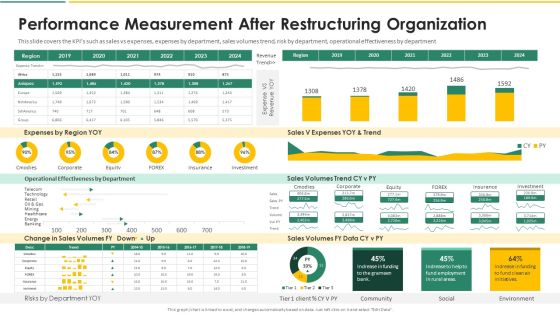
Organization Chart And Corporate Model Transformation Performance Measurement After Slides PDF
This slide covers the KPIs such as sales vs expenses, expenses by department, sales volumes trend, risk by department, operational effectiveness by department. Deliver and pitch your topic in the best possible manner with this organization chart and corporate model transformation performance measurement after slides pdf. Use them to share invaluable insights on operational effectiveness by department, expenses by region yoy, sales volumes trend and impress your audience. This template can be altered and modified as per your expectations. So, grab it now.
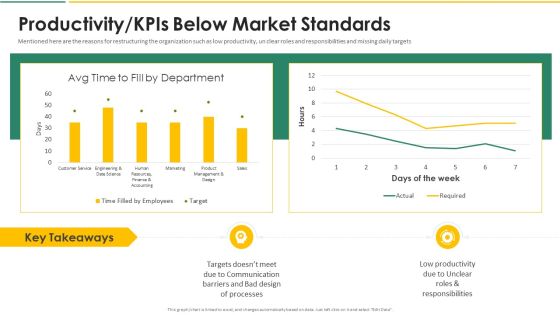
Organization Chart And Corporate Model Transformation Productivity Kpis Below Market Standards Summary PDF
Mentioned here are the reasons for restructuring the organization such as low productivity, un clear roles and responsibilities and missing daily targets. Deliver an awe inspiring pitch with this creative organization chart and corporate model transformation productivity kpis below market standards summary pdf bundle. Topics like service, data science, target, processes, roles and responsibilities can be discussed with this completely editable template. It is available for immediate download depending on the needs and requirements of the user.
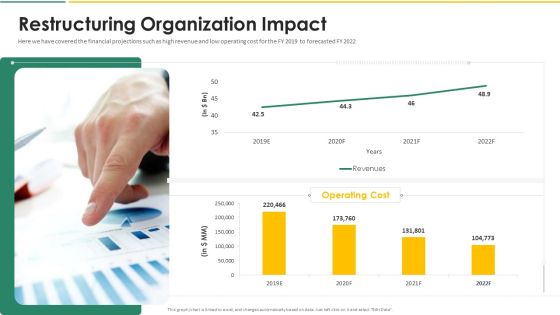
Organization Chart And Corporate Model Transformation Restructuring Organization Impact Structure PDF
Here we have covered the financial projections such as high revenue and low operating cost for the FY 2019 to forecasted FY 2022. Deliver and pitch your topic in the best possible manner with this organization chart and corporate model transformation restructuring organization impact structure pdf. Use them to share invaluable insights on restructuring organization impact and impress your audience. This template can be altered and modified as per your expectations. So, grab it now.

Organization Chart And Corporate Model Transformation Restructuring Organization Results Elements PDF
This is an analysis carried out to capture the overall experience of the Restructuring Organization process. On the views such as strongly agree, agree, disagree, strongly disagree. Deliver an awe inspiring pitch with this creative organization chart and corporate model transformation restructuring organization results elements pdf bundle. Topics like effective, involvement, organizations can be discussed with this completely editable template. It is available for immediate download depending on the needs and requirements of the user.

Brand Comparative Analysis Chart With Market Size And Pricing Model Pictures PDF
This slide illustrates comparative analysis of brands of XYZ product. It includes their market size, key features of these brands.Showcasing this set of slides titled Brand Comparative Analysis Chart With Market Size And Pricing Model Pictures PDF. The topics addressed in these templates are Pricing Model, Competitive Pricing, Market Size. All the content presented in this PPT design is completely editable. Download it and make adjustments in color, background, font etc. as per your unique business setting.
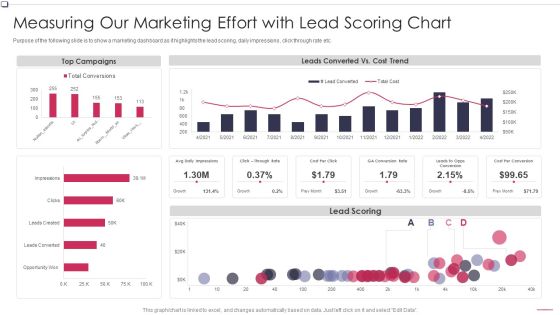
Measuring Our Marketing Chart Business To Business Promotion Sales Lead Professional PDF
Purpose of the following slide is to show a marketing dashboard as it highlights the lead scoring, daily impressions , click through rate etc. Deliver an awe inspiring pitch with this creative Measuring Our Marketing Chart Business To Business Promotion Sales Lead Professional PDF bundle. Topics like Lead Scoring, Leads Converted, Top Campaigns can be discussed with this completely editable template. It is available for immediate download depending on the needs and requirements of the user.
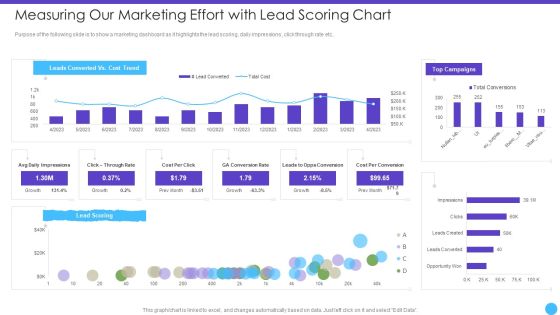
Sales Lead Qualification Rating Framework Measuring Our Marketing Effort With Lead Scoring Chart Mockup PDF
Purpose of the following slide is to show a marketing dashboard as it highlights the lead scoring, daily impressions , click through rate etc.Deliver an awe inspiring pitch with this creative Sales Lead Qualification Rating Framework Measuring Our Marketing Effort With Lead Scoring Chart Mockup PDF bundle. Topics like Leads Converted, Top Campaigns, Cost Conversion can be discussed with this completely editable template. It is available for immediate download depending on the needs and requirements of the user.

Chart Showing Most Popular Payment Methods Used In USA Market Ppt File Deck PDF
This slide shows the payment methods used worldwide for trade monthly. It includes bank transfers, check, cash and credit card. Showcasing this set of slides titled Chart Showing Most Popular Payment Methods Used In USA Market Ppt File Deck PDF. The topics addressed in these templates are Cyber Security Practices, Bank Transfers, 2022 To 2023. All the content presented in this PPT design is completely editable. Download it and make adjustments in color, background, font etc. as per your unique business setting.
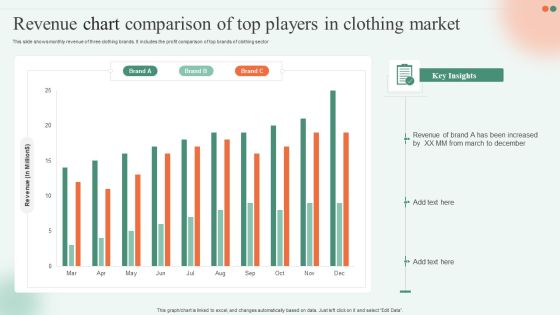
Revenue Chart Comparison Of Top Players In Clothing Market Ppt Infographics Skills PDF
This slide shows monthly revenue of three clothing brands. It includes the profit comparison of top brands of clothing sector Showcasing this set of slides titled Revenue Chart Comparison Of Top Players In Clothing Market Ppt Infographics Skills PDF. The topics addressed in these templates are Revenue, Brand, Key Insights. All the content presented in this PPT design is completely editable. Download it and make adjustments in color, background, font etc. as per your unique business setting.
Stock Market Chart For Analyzing Investment Behavior Ppt Icon Summary PDF
This slides shows the amount invested in stock market in last six years. It includes the comparison of investment in equity and debentures. Showcasing this set of slides titled Stock Market Chart For Analyzing Investment Behavior Ppt Icon Summary PDF. The topics addressed in these templates are Investment Stocks, 2018 To 2023, Higher Returns. All the content presented in this PPT design is completely editable. Download it and make adjustments in color, background, font etc. as per your unique business setting.

Continent Inflation Rate Percentage Column Chart With Key Insights Topics PDF
This slide illustrates percentage of inflation rate in continents to increase value of investment returns. It includes parts such as continents and inflation rate percentage.Showcasing this set of slides titled Continent Inflation Rate Percentage Column Chart With Key Insights Topics PDF. The topics addressed in these templates are Developing Countries, Covid Restrictions, Food Supplies. All the content presented in this PPT design is completely editable. Download it and make adjustments in color, background, font etc. as per your unique business setting.
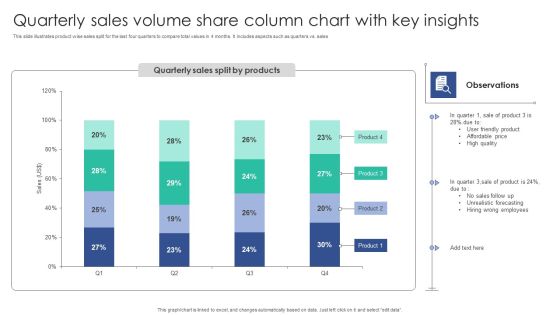
Quarterly Sales Volume Share Column Chart With Key Insights Structure PDF
This slide illustrates product wise sales split for the last four quarters to compare total values in 4 months. It includes aspects such as quarters vs. salesShowcasing this set of slides titled Quarterly Sales Volume Share Column Chart With Key Insights Structure PDF. The topics addressed in these templates are Unrealistic Forecasting, Wrong Employees, Friendly Product. All the content presented in this PPT design is completely editable. Download it and make adjustments in color, background, font etc. as per your unique business setting.

Clustered Column Chart Opening Retail Store In Untapped Industry For Sales Growth Mockup PDF
Want to ace your presentation in front of a live audience Our Clustered Column Chart Opening Retail Store In Untapped Industry For Sales Growth Mockup PDF can help you do that by engaging all the users towards you.. Slidegeeks experts have put their efforts and expertise into creating these impeccable powerpoint presentations so that you can communicate your ideas clearly. Moreover, all the templates are customizable, and easy-to-edit and downloadable. Use these for both personal and commercial use.

Intelligent Manufacturing Column Chart Ppt PowerPoint Presentation File Example File PDF
The Intelligent Manufacturing Column Chart Ppt PowerPoint Presentation File Example File PDF is a compilation of the most recent design trends as a series of slides. It is suitable for any subject or industry presentation, containing attractive visuals and photo spots for businesses to clearly express their messages. This template contains a variety of slides for the user to input data, such as structures to contrast two elements, bullet points, and slides for written information. Slidegeeks is prepared to create an impression.

Identifying And Increasing Brand Awareness Column Chart Ppt Pictures Brochure PDF
Want to ace your presentation in front of a live audience Our Identifying And Increasing Brand Awareness Column Chart Ppt Pictures Brochure PDF can help you do that by engaging all the users towards you. Slidegeeks experts have put their efforts and expertise into creating these impeccable powerpoint presentations so that you can communicate your ideas clearly. Moreover, all the templates are customizable, and easy-to-edit and downloadable. Use these for both personal and commercial use.

Column Chart Data Driven Promotional Guide To Increase Return On Investment Microsoft PDF
Want to ace your presentation in front of a live audience Our Column Chart Data Driven Promotional Guide To Increase Return On Investment Microsoft PDF can help you do that by engaging all the users towards you. Slidegeeks experts have put their efforts and expertise into creating these impeccable powerpoint presentations so that you can communicate your ideas clearly. Moreover, all the templates are customizable, and easy-to-edit and downloadable. Use these for both personal and commercial use.
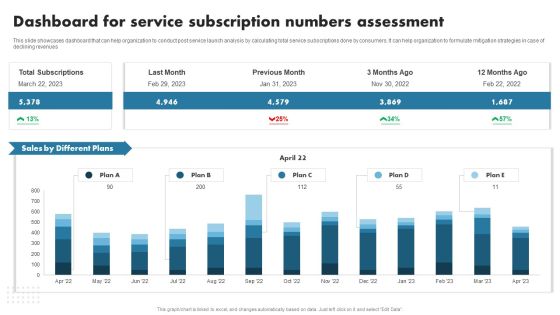
Enhancing Customer Outreach Dashboard For Service Subscription Numbers Template PDF
This slide showcases dashboard that can help organization to conduct post service launch analysis by calculating total service subscriptions done by consumers. It can help organization to formulate mitigation strategies in case of declining revenues. This Enhancing Customer Outreach Dashboard For Service Subscription Numbers Template PDF from Slidegeeks makes it easy to present information on your topic with precision. It provides customization options, so you can make changes to the colors, design, graphics, or any other component to create a unique layout. It is also available for immediate download, so you can begin using it right away. Slidegeeks has done good research to ensure that you have everything you need to make your presentation stand out. Make a name out there for a brilliant performance.

Comparative Analysis Of Budgeted And Actual Sales Template PDF
The following slide depicts the analysis of projected and actual sales performance post risk management to evaluate its success. It mainly includes revenue generated during 2021 and 2022 along with gross profit margin etc. This Comparative Analysis Of Budgeted And Actual Sales Template PDF from Slidegeeks makes it easy to present information on your topic with precision. It provides customization options, so you can make changes to the colors, design, graphics, or any other component to create a unique layout. It is also available for immediate download, so you can begin using it right away. Slidegeeks has done good research to ensure that you have everything you need to make your presentation stand out. Make a name out there for a brilliant performance.
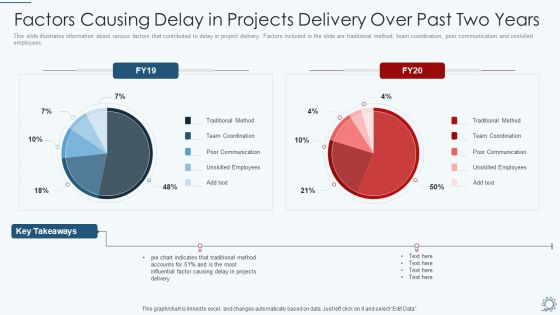
Development And Operations Pipeline IT Factors Causing Delay In Projects Delivery Over Past Two Years Infographics PDF
This slide illustrates information about various factors that contributed to delay in project delivery. Factors included in the slide are traditional method, team coordination, poor communication and unskilled employees. Deliver and pitch your topic in the best possible manner with this development and operations pipeline it factors causing delay in projects delivery over past two years infographics pdf. Use them to share invaluable insights on communication, team coordination, traditional method and impress your audience. This template can be altered and modified as per your expectations. So, grab it now.

Annual Sales Team Performance And Collaboration Dashboard Themes PDF
This slide signifies the dashboard on sales team performance and coordination. It includes total revenue generated, employee performance pie chart, Products sold and income by customer location Showcasing this set of slides titled Annual Sales Team Performance And Collaboration Dashboard Themes PDF The topics addressed in these templates are Annual Sales, Team Performance, Collaboration Dashboard All the content presented in this PPT design is completely editable. Download it and make adjustments in color, background, font etc. as per your unique business setting.

5 Years Comparative Analysis Chart Ppt PowerPoint Presentation Complete Deck With Slides
Improve your presentation delivery using this 5 Years Comparative Analysis Chart Ppt PowerPoint Presentation Complete Deck With Slides. Support your business vision and objectives using this well-structured PPT deck. This template offers a great starting point for delivering beautifully designed presentations on the topic of your choice. Comprising twenty slides this professionally designed template is all you need to host discussion and meetings with collaborators. Each slide is self-explanatory and equipped with high-quality graphics that can be adjusted to your needs. Therefore, you will face no difficulty in portraying your desired content using this PPT slideshow. This PowerPoint slideshow contains every important element that you need for a great pitch. It is not only editable but also available for immediate download and utilization. The color, font size, background, shapes everything can be modified to create your unique presentation layout. Therefore, download it now.

Russia Ukraine Ethereum Price Chart Before The Russia Invasion Of Ukraine Graphics PDF
The purpose of this slide is to exhibit day-to-day movement of Ethereum before the Russia Ukraine crisis. The statistics mentioned in the slide is related to the price movement from Jan 24 to Feb 21, 2022. Deliver an awe inspiring pitch with this creative russia ukraine ethereum price chart before the russia invasion of ukraine graphics pdf bundle. Topics like ethereum price can be discussed with this completely editable template. It is available for immediate download depending on the needs and requirements of the user.

HR Budget Breakdown Pie Chart Ppt PowerPoint Presentation Gallery Designs Download PDF
The following slide depicts the category wise breakdown of HR budget to make it easier to assess major expenses and scope for improvement. It includes heads such as compensation and benefits, learning and development, rewards and incentives etc. Showcasing this set of slides titled HR Budget Breakdown Pie Chart Ppt PowerPoint Presentation Gallery Designs Download PDF. The topics addressed in these templates are Recruitment And Onboarding, Employee Health And Wellness Programs, Employee Relation And Talent Management, Incentives And Rewards. All the content presented in this PPT design is completely editable. Download it and make adjustments in color, background, font etc. as per your unique business setting.
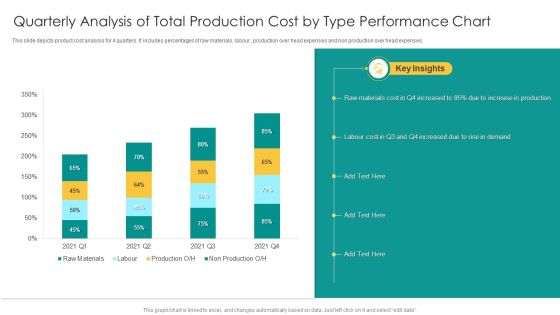
Quarterly Analysis Of Total Production Cost By Type Performance Chart Summary PDF
This slide depicts product cost analysis for 4 quarters. It includes percentages of raw materials, labour , production over head expenses and non production over head expenses. Showcasing this set of slides titled Quarterly Analysis Of Total Production Cost By Type Performance Chart Summary PDF. The topics addressed in these templates are Raw Materials Cost, Increase Production, Rise Demand. All the content presented in this PPT design is completely editable. Download it and make adjustments in color, background, font etc. as per your unique business setting.

Market Chart Showing Revenue Breakdown Of FMCG Company Ppt Layouts Layouts PDF
This slide shows the percentage of revenue generated in fast moving consumable goods industry from different segments which are food products, households, personal, baby and hair care, OTC products and others. Showcasing this set of slides titled Market Chart Showing Revenue Breakdown Of FMCG Company Ppt Layouts Layouts PDF. The topics addressed in these templates are Food Products, Personal Care, Households. All the content presented in this PPT design is completely editable. Download it and make adjustments in color, background, font etc. as per your unique business setting.

Integrating Naas Service Model To Enhance Area Chart Ppt File Images PDF
Slidegeeks is here to make your presentations a breeze with Integrating Naas Service Model To Enhance Area Chart Ppt File Images PDF With our easy-to-use and customizable templates, you can focus on delivering your ideas rather than worrying about formatting. With a variety of designs to choose from, youre sure to find one that suits your needs. And with animations and unique photos, illustrations, and fonts, you can make your presentation pop. So whether youre giving a sales pitch or presenting to the board, make sure to check out Slidegeeks first.

Soft Drinks Brand Preference Column Chart With Key Insights Clipart PDF
This slide shows survey results of soft drinks consumption by different age groups of consumers. Major brands covered are coke, Pepsi, coke zero, and Pepsi max to visualize soda consumption.Showcasing this set of slides titled Soft Drinks Brand Preference Column Chart With Key Insights Clipart PDF. The topics addressed in these templates are Survey Consumers, Personalized Advertisements, Emotional Connect. All the content presented in this PPT design is completely editable. Download it and make adjustments in color, background, font etc. as per your unique business setting.
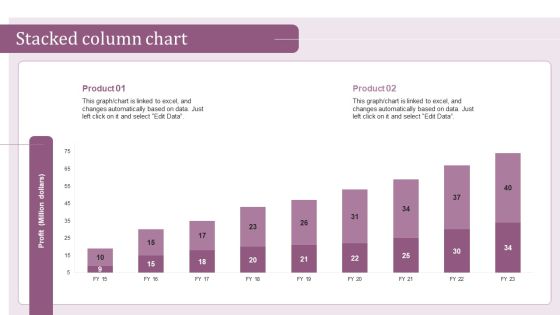
Internal Hiring Handbook Stacked Column Chart Ppt PowerPoint Presentation File Graphics Example PDF
This modern and well-arranged Internal Hiring Handbook Stacked Column Chart Ppt PowerPoint Presentation File Graphics Example PDF provides lots of creative possibilities. It is very simple to customize and edit with the Powerpoint Software. Just drag and drop your pictures into the shapes. All facets of this template can be edited with Powerpoint, no extra software is necessary. Add your own material, put your images in the places assigned for them, adjust the colors, and then you can show your slides to the world, with an animated slide included.

Effective Manufacturing Planning And Control Administration System Clustered Column Chart Themes PDF
Retrieve professionally designed Effective Manufacturing Planning And Control Administration System Clustered Column Chart Themes PDF to effectively convey your message and captivate your listeners. Save time by selecting pre-made slideshows that are appropriate for various topics, from business to educational purposes. These themes come in many different styles, from creative to corporate, and all of them are easily adjustable and can be edited quickly. Access them as PowerPoint templates or as Google Slides themes. You don not have to go on a hunt for the perfect presentation because Slidegeeks got you covered from everywhere.
 Home
Home