Bar Graph

Business Strategy Plan Template 3d Man Sitting On Bar Graph Basic Concepts
Delight Them With Our Business Strategy Plan Template 3d Man Sitting On Bar Graph Basic Concepts Powerpoint Templates. Your Audience Will Be Ecstatic. Our Computer Powerpoint Templates Are Created Cost Effective. They Understand The Need For Economy.

Business Diagram Bar Graph For Result Display On Mobile Presentation Template
This Power Point template has been designed with graphic of bar graph on mobile phone. This business diagram can be used to make business reports. Download this Power Point slide to build quality presentation for your viewers.
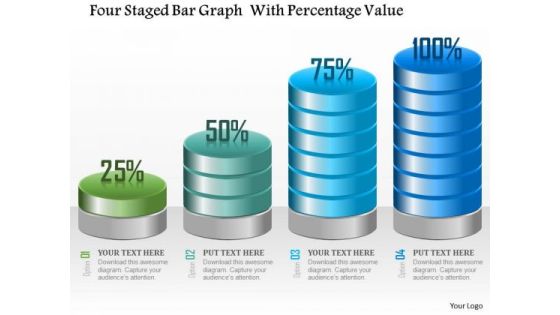
Business Diagram Four Staged Bar Graph With Percentage Value Presentation Template
Four staged bar graph with percentage value has been used to craft this power point template. This PPT contains the concept of making financial timeline and result analysis. This PPT can be used for business and finance related presentations.

Business Diagram Globe Bar Graph And Bulb For International Business Diagram Presentation Template
Graphic of globe and bar graph with bulb has been used to craft this power point template diagram. This PPT diagram contains the concept of international business growth analysis. Use this PPT for global business and sales related presentations.

Magnifier With Tools And Bar Graph Ppt PowerPoint Presentation Portfolio Templates
This is a magnifier with tools and bar graph ppt powerpoint presentation portfolio templates. This is a four stage process. The stages in this process are magnifier, search, marketing, strategy, business.
Growth Arrow On Bar Graph Icon Ppt Powerpoint Presentation Infographic Template Clipart
This is a growth arrow on bar graph icon ppt powerpoint presentation infographic template clipart. This is a three stage process. The stages in this process are financial statements icon, accounting ratio icon, balance sheet icon.
Bar Graph Icon Showing Operating Rhythm Ppt Powerpoint Presentation Ideas Templates
This is a bar graph icon showing operating rhythm ppt powerpoint presentation ideas templates. This is a three stage process. The stages in this process are six sigma, operating rhythm, business rhythm.

Bar Graph With Upward Arrow For Financial Success Ppt PowerPoint Presentation Infographic Template Model
This is a bar graph with upward arrow for financial success ppt powerpoint presentation infographic template model. This is a five stage process. The stages in this process are rising arrow, growing arrow, increasing arrow.

Stock Photo Business Concepts Make New And Sales Bar Graph Images Graphics
Document The Process On Our Stock Photo Business Concepts Make New And Sales Bar Graph Images Graphics Powerpoint Templates. Make A Record Of Every Detail. Satiate Desires With Our sales Powerpoint Templates. Give Them All They Want And More.
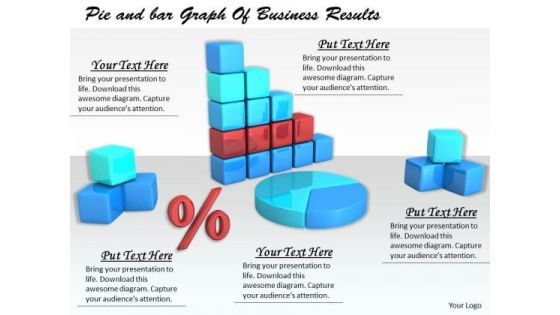
Stock Photo Business Strategy Examples Pie And Bar Graph Of Results Images
Plan For All Contingencies With Our Stock Photo Business Strategy Examples Pie And Bar Graph Of Results Images Powerpoint Templates. Douse The Fire Before It Catches. Generate Camaraderie With Our sales Powerpoint Templates. Good Wishes Will Come Raining Down.
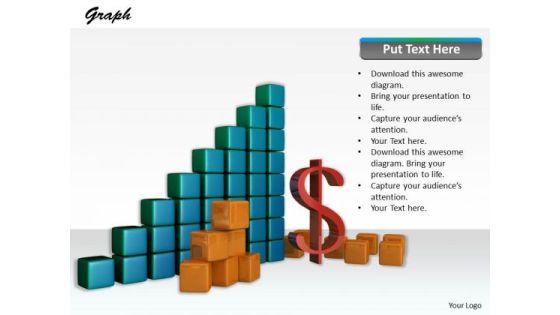
Stock Photo Modern Marketing Concepts See The Financial Bar Graph Business Images
Be The Dramatist With Our Stock Photo Modern Marketing Concepts See The Financial Bar Graph Business Images Powerpoint Templates. Script Out The Play Of Words. Put Our sales Powerpoint Templates Into The Draw. Your Thoughts Will Win The Lottery.

Stock Photo Business Growth Bar Graph And Arrow And Tablet PowerPoint Slide
This PowerPoint template has been designed with graphic of bar graph and arrow with tablet. This unique image slide depicts the concept of business growth and success. Use this image slide to build exclusive presentation for your viewers.

Stock Photo Bar Graph With Cubes For Financial Data PowerPoint Slide
Graphic of bar graph and cubes are used to decorate this image template. This PPT contains the concept of financial data analysis. Use this PPT for finance and business related presentations.

Business Outcomes Vector Icons Showing Pie And Bar Graph Ppt Powerpoint Presentation File Graphic Images
This is a business outcomes vector icons showing pie and bar graph ppt powerpoint presentation file graphic images. This is a three stage process. The stages in this process are business outcomes, business results, business output.
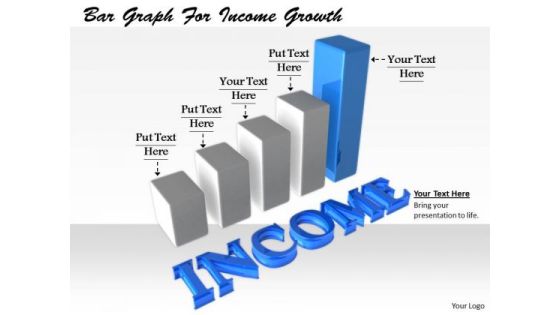
Stock Photo Business Management Strategy Bar Graph For Income Growth Stock Images
Experiment With Your Thoughts As You Desire. Our stock photo business management strategy bar graph for income growth stock images Will Be All For It. Stand On Your Own Feet With Our finance. You Will Discover Personal Power.

Bar Graph With Arrow For Career Planning Ppt PowerPoint Presentation Gallery
This is a bar graph with arrow for career planning ppt powerpoint presentation gallery. This is a six stage process. The stages in this process are business, finance, marketing, strategy, planning, success, arrow.

Stock Market Trend Dollar Sign On Bar Graph Ppt Powerpoint Presentation Show Deck
This is a stock market trend dollar sign on bar graph ppt powerpoint presentation show deck. This is a four stage process. The stages in this process are stock market, financial market, bull market.

Bar Graph To Present Financial Information Ppt PowerPoint Presentation Show Tips
This is a bar graph to present financial information ppt powerpoint presentation show tips. This is a four stage process. The stages in this process are stock market, financial markets, bull market.

Financial Analysis Vector Bar Graph With Magnifying Glass Ppt PowerPoint Presentation Gallery Design Ideas
This is a financial analysis vector bar graph with magnifying glass ppt powerpoint presentation gallery design ideas. This is a four stage process. The stages in this process are marketing analytics, marketing performance, marketing discovery.

Worldwide Market Trends Mobile With Bar Graph And Globe Ppt PowerPoint Presentation Styles Demonstration
This is a worldwide market trends mobile with bar graph and globe ppt powerpoint presentation styles demonstration. This is a four stage process. The stages in this process are marketing analytics, marketing performance, marketing discovery.

Bar Graph With Downward Arrow For Business Failure Ppt PowerPoint Presentation Inspiration Graphics
This is a bar graph with downward arrow for business failure ppt powerpoint presentation inspiration graphics. This is a four stage process. The stages in this process are business failure, unsuccessful business, business non success.

Downward Arrow On Bar Graph For Financial Loss Ppt PowerPoint Presentation Infographics Sample
This is a downward arrow on bar graph for financial loss ppt powerpoint presentation infographics sample. This is a three stage process. The stages in this process are business failure, unsuccessful business, business non success.
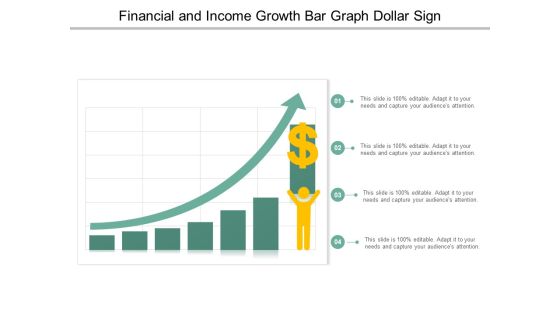
Financial And Income Growth Bar Graph Dollar Sign Ppt PowerPoint Presentation Professional Shapes
This is a financial and income growth bar graph dollar sign ppt powerpoint presentation professional shapes. This is a four stage process. The stages in this process are growth, increase sales, increase revenue.
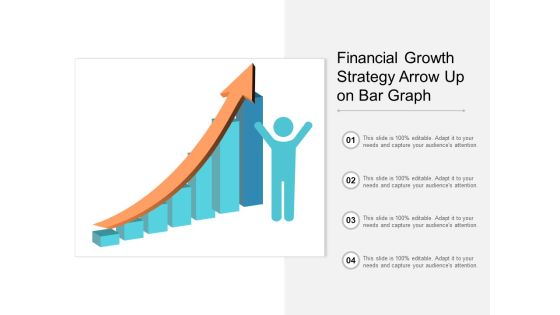
Financial Growth Strategy Arrow Up On Bar Graph Ppt PowerPoint Presentation Gallery Example
This is a financial growth strategy arrow up on bar graph ppt powerpoint presentation gallery example. This is a four stage process. The stages in this process are growth, increase sales, increase revenue.
Profit Growth Bar Graph With Rising Arrow And Dollar Sign Ppt PowerPoint Presentation Icon Designs
This is a profit growth bar graph with rising arrow and dollar sign ppt powerpoint presentation icon designs. This is a five stage process. The stages in this process are growth, increase sales, increase revenue.

Growth Arrow On Bar Graph Vector Ppt Powerpoint Presentation Layouts Master Slide
This is a growth arrow on bar graph vector ppt powerpoint presentation layouts master slide. This is a three stage process. The stages in this process are increasing arrows, improving arrows, growing arrows.

Economic Growth Arrow With Bar Graph On Human Hand Ppt PowerPoint Presentation Infographics Ideas
This is a economic growth arrow with bar graph on human hand ppt powerpoint presentation infographics ideas. This is a four stage process. The stages in this process are rising arrow, growing arrow, increasing arrow.
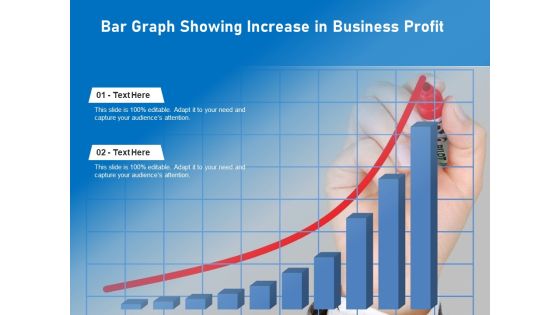
Bar Graph Showing Increase In Business Profit Ppt PowerPoint Presentation Infographic Template Show PDF
Persuade your audience using this bar graph showing increase in business profit ppt powerpoint presentation infographic template show pdf. This PPT design covers two stages, thus making it a great tool to use. It also caters to a variety of topics including bar graph showing increase in business profit. Download this PPT design now to present a convincing pitch that not only emphasizes the topic but also showcases your presentation skills.
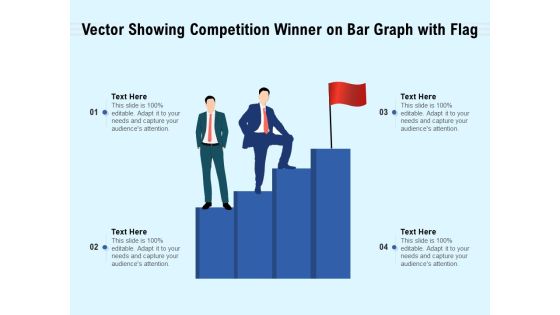
Vector Showing Competition Winner On Bar Graph With Flag Ppt PowerPoint Presentation File Sample PDF
Presenting vector showing competition winner on bar graph with flag ppt powerpoint presentation file sample pdf to dispense important information. This template comprises four stages. It also presents valuable insights into the topics including vector showing competition winner on bar graph with flag. This is a completely customizable PowerPoint theme that can be put to use immediately. So, download it and address the topic impactfully.

Bar Graph With Arrows For Data Representation Vector Icon Ppt PowerPoint Presentation Summary Picture PDF
Presenting bar graph with arrows for data representation vector icon ppt powerpoint presentation summary picture pdf to dispense important information. This template comprises three stages. It also presents valuable insights into the topics including bar graph with arrows for data representation vector icon. This is a completely customizable PowerPoint theme that can be put to use immediately. So, download it and address the topic impactfully.
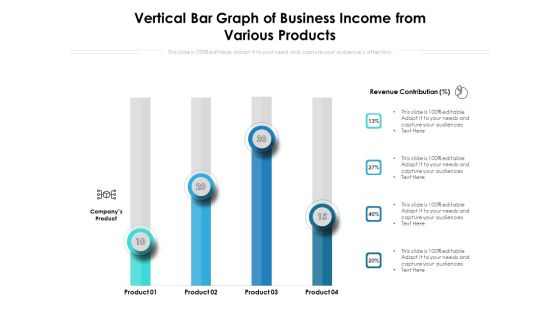
Vertical Bar Graph Of Business Income From Various Products Ppt PowerPoint Presentation File Introduction PDF
Persuade your audience using this vertical bar graph of business income from various products ppt powerpoint presentation file introduction pdf. This PPT design covers four stages, thus making it a great tool to use. It also caters to a variety of topics including vertical bar graph of business income from various products. Download this PPT design now to present a convincing pitch that not only emphasizes the topic but also showcases your presentation skills.
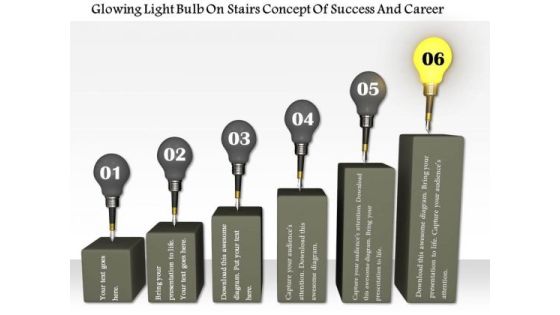
Stock Photo Glowing Bulb On Top Of Bar Graph PowerPoint Slide
This conceptual image slide displays bulbs on bar graph. This image slide has been crafted with graphic of bar graph and bulbs and individual glowing bulb. This image slide depicts success and carrier. Use this image slide to express views on leadership, teamwork, success, achievements and growth in your presentations. This image slide may also be used to represent different business strategies. Create beautiful presentations using this image slide.

Stock Photo Blue Bar Graph With Growth Arrow For Business PowerPoint Slide
This image slide displays bar graph with growth arrow. This image has been designed with graphic of blue colored bar graph embedded with growth arrow . Use this image slide, in your presentations to express views on finance, growth and achievements. This image slide may also be used to exhibit any information which requires visual presentation in your presentations. This image slide will enhance the quality of your presentations.

Stock Photo Colorful Bar Graph For Business Result Display PowerPoint Slide
This image slide displays bar graph. This image has been designed with graphic of 3d multicolor bar graph of solid cylinder shape. Use this image slide, in your presentations to express views on finance, growth and success. This image slide may also be used to exhibit any information which requires visual presentation in your presentations. This image slide will enhance the quality of your presentations.

Bar Graph With Eye For Future Planning Ppt PowerPoint Presentation Icon Outline PDF
Persuade your audience using this bar graph with eye for future planning ppt powerpoint presentation icon outline pdf. This PPT design covers three stages, thus making it a great tool to use. It also caters to a variety of topics including bar graph with eye for future planning. Download this PPT design now to present a convincing pitch that not only emphasizes the topic but also showcases your presentation skills.

Businessman With Bar Graph Vector Icon Ppt PowerPoint Presentation File Deck PDF
Persuade your audience using this businessman with bar graph vector icon ppt powerpoint presentation file deck pdf. This PPT design covers three stages, thus making it a great tool to use. It also caters to a variety of topics including businessman with bar graph vector icon. Download this PPT design now to present a convincing pitch that not only emphasizes the topic but also showcases your presentation skills.
Handshake With Bar Graph Vector Icon Ppt PowerPoint Presentation File Clipart PDF
Persuade your audience using this handshake with bar graph vector icon ppt powerpoint presentation file clipart pdf. This PPT design covers two stages, thus making it a great tool to use. It also caters to a variety of topics including handshake with bar graph vector icon. Download this PPT design now to present a convincing pitch that not only emphasizes the topic but also showcases your presentation skills.

Business Financial Growth Bar Graph With Dollar Symbol Icon Ppt PowerPoint Presentation File Ideas PDF
Persuade your audience using this business financial growth bar graph with dollar symbol icon ppt powerpoint presentation file ideas pdf. This PPT design covers one stages, thus making it a great tool to use. It also caters to a variety of topics including business financial growth bar graph with dollar symbol icon. Download this PPT design now to present a convincing pitch that not only emphasizes the topic but also showcases your presentation skills.
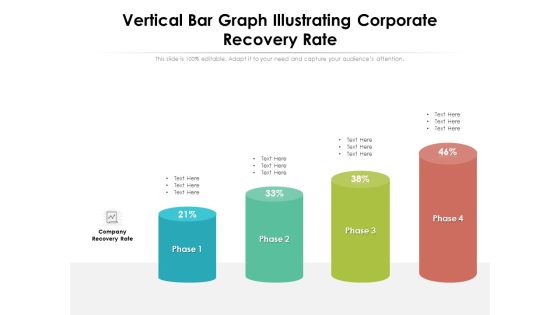
Vertical Bar Graph Illustrating Corporate Recovery Rate Ppt PowerPoint Presentation File Design Inspiration PDF
Persuade your audience using this vertical bar graph illustrating corporate recovery rate ppt powerpoint presentation file design inspiration pdf. This PPT design covers four stages, thus making it a great tool to use. It also caters to a variety of topics including vertical bar graph illustrating corporate recovery rate. Download this PPT design now to present a convincing pitch that not only emphasizes the topic but also showcases your presentation skills.
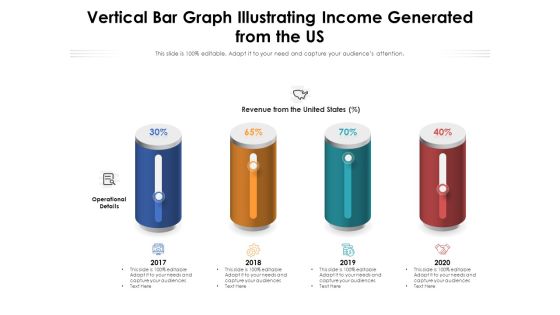
Vertical Bar Graph Illustrating Income Generated From The US Ppt PowerPoint Presentation Gallery Structure PDF
Persuade your audience using this vertical bar graph illustrating income generated from the us ppt powerpoint presentation gallery structure pdf. This PPT design covers four stages, thus making it a great tool to use. It also caters to a variety of topics including vertical bar graph illustrating income generated from the us. Download this PPT design now to present a convincing pitch that not only emphasizes the topic but also showcases your presentation skills.

Business Goal With Bar Graph Vector Icon Ppt Inspiration Rules PDF
Persuade your audience using this business goal with bar graph vector icon ppt inspiration rules pdf. This PPT design covers three stages, thus making it a great tool to use. It also caters to a variety of topics including business goal with bar graph vector icon. Download this PPT design now to present a convincing pitch that not only emphasizes the topic but also showcases your presentation skills.
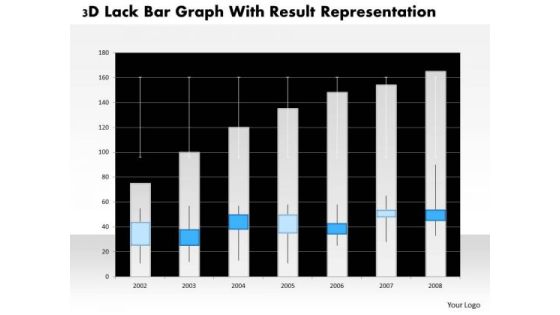
Business Diagram 3d Lack Bar Graph With Result Representation PowerPoint Slide
This business diagram has graphic of 3d lack bar graph. This diagram is a data visualization tool that gives you a simple way to present statistical information. This slide helps your audience examine and interpret the data you present.

Bar Graph Yearly Along Earth PowerPoint Templates And PowerPoint Themes 1012
Bar Graph Yearly Along Earth PowerPoint Templates And PowerPoint Themes 1012-This PowerPoint Template shows the Annual growth Chart from 2006 to 2013 in the Graphical manner. It imitates the concept of Money, Business, Profit, Loss etc. Use this Template for Increasing and decreasing Bar Graph. Clarity of thought has been the key to your growth. Use our templates to illustrate your ability-Bar Graph Yearly Along Earth PowerPoint Templates And PowerPoint Themes 1012-This PowerPoint template can be used for presentations relating to-Bar graph showing the growth of profits, business, finance, success, earth, globe

Bar Graph With Dollar Marketing PowerPoint Templates And PowerPoint Themes 1012
Bar Graph with Dollar Marketing PowerPoint Templates And PowerPoint Themes 1012-Emphatically define your message with our above template which contains a graphic of bar graph with dollar notes. This image clearly defines the concept of business statistics and financial reviews. Our stunning image makes your presentations professional showing that you care about even the smallest details. Create captivating presentations to deliver comparative and weighted arguments.-Bar Graph with Dollar Marketing PowerPoint Templates And PowerPoint Themes 1012-This PowerPoint template can be used for presentations relating to-Business graph and dollar, money, finance, success, business, marketing
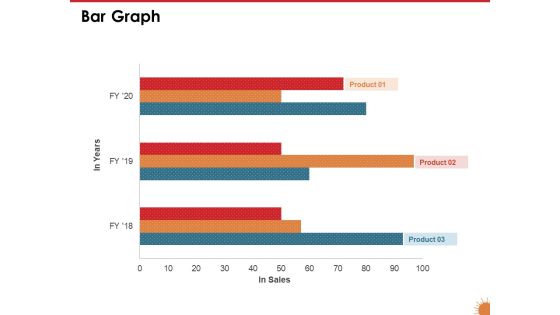
Impact Of COVID 19 On The Hospitality Industry Bar Graph Portrait PDF
Presenting this set of slides with name impact of covid 19 on the hospitality industry bar graph portrait pdf. The topics discussed in these slide is bar chart. This is a completely editable PowerPoint presentation and is available for immediate download. Download now and impress your audience.

Charity Fundraising Marketing Plan Bar Graph Ppt PowerPoint Presentation File Example Introduction PDF
Find highly impressive Charity Fundraising Marketing Plan Bar Graph Ppt PowerPoint Presentation File Example Introduction PDF on Slidegeeks to deliver a meaningful presentation. You can save an ample amount of time using these presentation templates. No need to worry to prepare everything from scratch because Slidegeeks experts have already done a huge research and work for you. You need to download Charity Fundraising Marketing Plan Bar Graph Ppt PowerPoint Presentation File Example Introduction PDF for your upcoming presentation. All the presentation templates are 100 percent editable and you can change the color and personalize the content accordingly. Download now.

Bar Graph Depicting Liquidity Ratio Analysis For 5 Years Graphics PDF
This showcases bar graph that can help organization to compare the liquidity ratios and take mitigation actions in case of decline. It showcases comparison of cash, quick and current ratio for a period of 5 financial years. Showcasing this set of slides titled Bar Graph Depicting Liquidity Ratio Analysis For 5 Years Graphics PDF. The topics addressed in these templates are Organization To Compare, The Liquidity Ratios, Mitigation Action Decline. All the content presented in this PPT design is completely editable. Download it and make adjustments in color, background, font etc. as per your unique business setting.

Bar Graph On Bright Background Business PowerPoint Templates Ppt Backgrounds For Slides 1212
We present our Bar Graph On Bright Background Business PowerPoint Templates PPT Backgrounds For Slides 1212.Use our Future PowerPoint Templates because let this slide illustrates others piggyback on you to see well over the horizon. Present our Success PowerPoint Templates because the Venn graphic comprising interlinking circles geometrically demonstate how various functions operating independantly, to a large extent, are essentially interdependant. Download and present our Signs PowerPoint Templates because like your thoughts arrows are inherently precise and true. Download and present our Marketing PowerPoint Templates because The marketplace is the merger of your dreams and your ability. Use our Business PowerPoint Templates because like the famed William Tell, they put aside all emotions and concentrate on the target.Use these PowerPoint slides for presentations relating to Bright bar graph, business, future, success, signs, marketing. The prominent colors used in the PowerPoint template are Yellow, Black, Gray. Customers tell us our Bar Graph On Bright Background Business PowerPoint Templates PPT Backgrounds For Slides 1212 are readymade to fit into any presentation structure. Presenters tell us our graph PowerPoint templates and PPT Slides will help them to explain complicated concepts. Use our Bar Graph On Bright Background Business PowerPoint Templates PPT Backgrounds For Slides 1212 are Lush. PowerPoint presentation experts tell us our graph PowerPoint templates and PPT Slides are Fabulous. Customers tell us our Bar Graph On Bright Background Business PowerPoint Templates PPT Backgrounds For Slides 1212 are Great. Presenters tell us our future PowerPoint templates and PPT Slides are Efficacious.

Business Revenue Bar Graph With Business Operational Expenditure Details Summary PDF
This slide represents business revenue bar graph with OPEX details which can be referred by companies to earn more revenue by controlling expenditures. It also provides information about marketing and sales, research and development, administration, total revenue, etc. Pitch your topic with ease and precision using this Business Revenue Bar Graph With Business Operational Expenditure Details Summary PDF. This layout presents information on Cost Of Marketing, Sales, Highest Amount. It is also available for immediate download and adjustment. So, changes can be made in the color, design, graphics or any other component to create a unique layout.

Business Diagram Globe With Bar Graph For Business Strategy Plan Presentation Template
This power point template diagram has been crafted with graphic of globe and bar graph. This PPT diagram contains the concept of business strategy and business plans for global market. Use this PPT for business and marketing related presentations.

Stock Photo Computer And Bar Graph For Result Analysis PowerPoint Slide
This Power point template has been crafted with graphic of computer and bar graph. This PPT contains the concept of technology and result analysis. Use this PPT for your business and technology related presentations.

Success Bar Graph With Growth Arrow New Year PowerPoint Templates Ppt Backgrounds For Slides 1112
We present our Success Bar Graph With Growth Arrow New Year PowerPoint Templates PPT Backgrounds For Slides 1112.Present our New Year PowerPoint Templates because this is a time to reflect and retrospect on successes and failures. Present our Arrows PowerPoint Templates because you have to coordinate and motivate your team. Download and present our Business PowerPoint Templates because this layout helps you to bring some important aspects of your business process to the notice of all concerned. Streamline the flow of information across the board. Download our Finance PowerPoint Templates because you can Highlight the key components of your entire manufacturing/ business process. Download our Success PowerPoint Templates because you can Ring them out loud with your brilliant ideas.Use these PowerPoint slides for presentations relating to Bar graph with growth arrow, new year, success, business, finance, arrows. The prominent colors used in the PowerPoint template are Yellow, Black, Gray. Professionals tell us our Success Bar Graph With Growth Arrow New Year PowerPoint Templates PPT Backgrounds For Slides 1112 are Energetic. Presenters tell us our success PowerPoint templates and PPT Slides are Spectacular. We assure you our Success Bar Graph With Growth Arrow New Year PowerPoint Templates PPT Backgrounds For Slides 1112 are Liberated. You can be sure our success PowerPoint templates and PPT Slides are Youthful. PowerPoint presentation experts tell us our Success Bar Graph With Growth Arrow New Year PowerPoint Templates PPT Backgrounds For Slides 1112 are Breathtaking. Use our business PowerPoint templates and PPT Slides are Romantic.

Business Bar Graph Profit And Growth PowerPoint Templates Ppt Backgrounds For Slides 1212
We present our Business Bar Graph Profit And Growth PowerPoint Templates PPT Backgrounds For Slides 1212.Download our Business PowerPoint Templates because the majestic tiger lord of all it surveys.It exudes power even when it is in repose. Use our Marketing PowerPoint Templates because customer satisfaction is a mantra of the marketplace. Building a loyal client base is an essential element of your business. Download and present our Success PowerPoint Templates because your quest has taken you well onto the path of success. Use our Globe PowerPoint Templates because you should explain the process by which you intend to right it. Present our Arrows PowerPoint Templates because it Draws the universal impact to highlight the similarities with your organizational structure and plans.Use these PowerPoint slides for presentations relating to Bar graph showing rise in profits business growth with globe, business, success, marketing, arrows, globe. The prominent colors used in the PowerPoint template are White, Blue light, Red. Professionals tell us our Business Bar Graph Profit And Growth PowerPoint Templates PPT Backgrounds For Slides 1212 are Radiant. We assure you our with PowerPoint templates and PPT Slides look good visually. PowerPoint presentation experts tell us our Business Bar Graph Profit And Growth PowerPoint Templates PPT Backgrounds For Slides 1212 are Energetic. Presenters tell us our in PowerPoint templates and PPT Slides are Energetic. The feedback we get is that our Business Bar Graph Profit And Growth PowerPoint Templates PPT Backgrounds For Slides 1212 are Nice. You can be sure our with PowerPoint templates and PPT Slides are Endearing.

Business Education PowerPoint Templates Business Bar Graph Data Driven Ppt Slides
Business Education PowerPoint Templates Business bar graph data driven PPT Slides-This PowerPoint slide is a data driven Columns Chart. The number of columns depend on the data.-Business Editable PowerPoint Templates Business beveled column chart PPT Slides-This ppt can be used for concepts relating to-chart,, graph, growth, investment, , market, percentage, , presentation report, results, statistics, stock, success and business.

Bar Graph Showing Increase In Annual Cost Ppt PowerPoint Presentation Infographic Template Inspiration PDF
Presenting this set of slides with name bar graph showing increase in annual cost ppt powerpoint presentation infographic template inspiration pdf. The topics discussed in these slides are 2015 to 2020. This is a completely editable PowerPoint presentation and is available for immediate download. Download now and impress your audience.
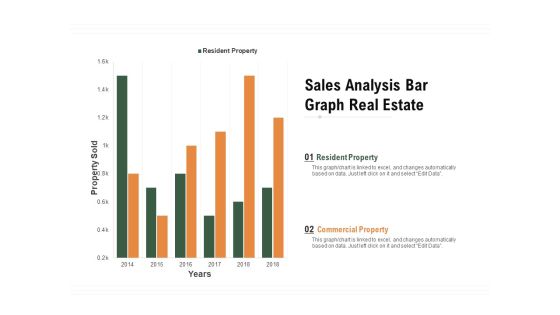
Sales Analysis Bar Graph Real Estate Ppt PowerPoint Presentation Infographic Template Show PDF
Pitch your topic with ease and precision using this sales analysis bar graph real estate ppt powerpoint presentation infographic template show pdf. This layout presents information on resident property, commercial property, property sold, 2014 to 2018. It is also available for immediate download and adjustment. So, changes can be made in the color, design, graphics or any other component to create a unique layout.

Bar Graph Depicting Hike In Price Rate In Recent Years Ppt PowerPoint Presentation Gallery Guidelines PDF
Showcasing this set of slides titled bar graph depicting hike in price rate in recent years ppt powerpoint presentation gallery guidelines pdf. The topics addressed in these templates are prices, target, inflation rate. All the content presented in this PPT design is completely editable. Download it and make adjustments in color, background, font etc. as per your unique business setting.
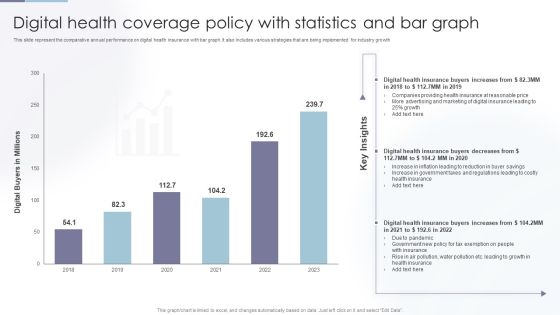
Digital Health Coverage Policy With Statistics And Bar Graph Clipart PDF
Showcasing this set of slides titled Digital Health Coverage Policy With Statistics And Bar Graph Clipart PDF. The topics addressed in these templates are Digital Health, Health Insurance, Insurance At Reasonable. All the content presented in this PPT design is completely editable. Download it and make adjustments in color, background, font etc. as per your unique business setting.

Bar Graph Showing Car Production Report Ppt PowerPoint Presentation Outline Master Slide PDF
Presenting this set of slides with name bar graph showing car production report ppt powerpoint presentation outline master slide pdf. The topics discussed in these slides are sedan model, hatchbacks model, 2017 to 2020. This is a completely editable PowerPoint presentation and is available for immediate download. Download now and impress your audience.

Bar Graph Showing Sales Projections Ppt PowerPoint Presentation Styles Graphics Download PDF
Presenting this set of slides with name bar graph showing sales projections ppt powerpoint presentation styles graphics download pdf. The topics discussed in these slides are Sales, Forecasted Sales. This is a completely editable PowerPoint presentation and is available for immediate download. Download now and impress your audience.

 Home
Home