Bar Graph
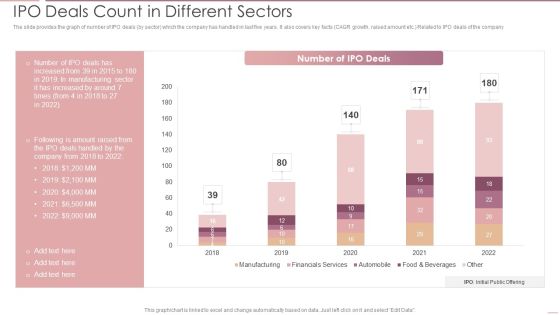
Investment Banking Security Underwriting Pitchbook IPO Deals Count In Different Sectors Mockup PDF
The slide provides the graph of number of IPO deals by sector which the company has handled in last five years. It also covers key facts CAGR growth, raised amount etc. Related to IPO deals of the company.Deliver and pitch your topic in the best possible manner with this Investment Banking Security Underwriting Pitchbook IPO Deals Count In Different Sectors Mockup PDF Use them to share invaluable insights on Manufacturing, Automobile, Financials Services and impress your audience. This template can be altered and modified as per your expectations. So, grab it now.

IT Services Business Profile Operating Profit And Margin Sample PDF
This slide illustrates a graph of operating profit in US doller and operating margin in percentage for IT company illustrating growth trend in last five years from 2018 to 2022. It also showcases operating profit contribution by services and solutions. Deliver an awe inspiring pitch with this creative IT Services Business Profile Operating Profit And Margin Sample PDF bundle. Topics like Operating Profit, Services can be discussed with this completely editable template. It is available for immediate download depending on the needs and requirements of the user.

Software Services Business Profile Operating Profit And Margin Ppt PowerPoint Presentation Gallery Inspiration PDF
This slide illustrates a graph of operating profit in US dollar and operating margin in percentage for software company illustrating growth trend in last five years from 2018 to 2022. It also showcases operating profit contribution by services and solutions. Deliver and pitch your topic in the best possible manner with this Software Services Business Profile Operating Profit And Margin Ppt PowerPoint Presentation Gallery Inspiration PDF. Use them to share invaluable insights on Operating Profit, Services Operating Profit, Solutions Operating Profit and impress your audience. This template can be altered and modified as per your expectations. So, grab it now.
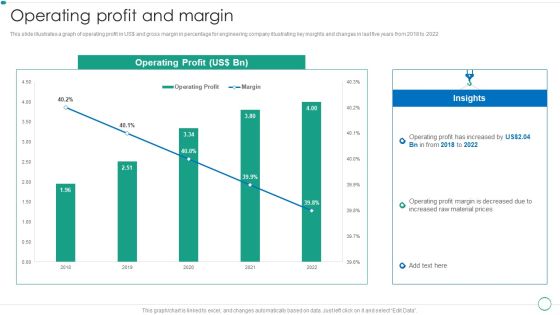
Real Estate Construction And Engineering Company Profile Operating Profit And Margin Designs PDF
This slide illustrates a graph of operating profit in US and gross margin in percentage for engineering company illustrating key insights and changes in last five years from 2018 to 2022.Deliver and pitch your topic in the best possible manner with this Real Estate Construction And Engineering Company Profile Operating Profit And Margin Designs PDF. Use them to share invaluable insights on Operating Profit, Insights, Material Prices and impress your audience. This template can be altered and modified as per your expectations. So, grab it now.
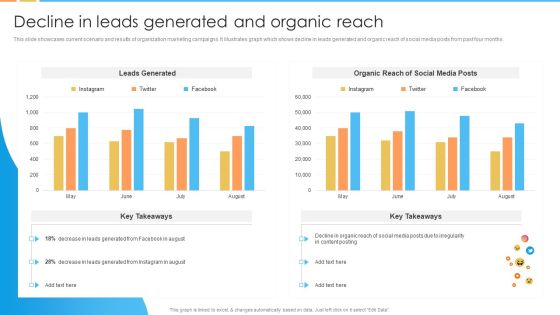
Digital Marketing Guide For B2B Firms Decline In Leads Generated And Organic Reach Pictures PDF
This slide showcases current scenario and results of organization marketing campaigns. It illustrates graph which shows decline in leads generated and organic reach of social media posts from past four months.Deliver and pitch your topic in the best possible manner with this Digital Marketing Guide For B2B Firms Decline In Leads Generated And Organic Reach Pictures PDF. Use them to share invaluable insights on Leads Generated, Organic Reach, Leads Generated and impress your audience. This template can be altered and modified as per your expectations. So, grab it now.
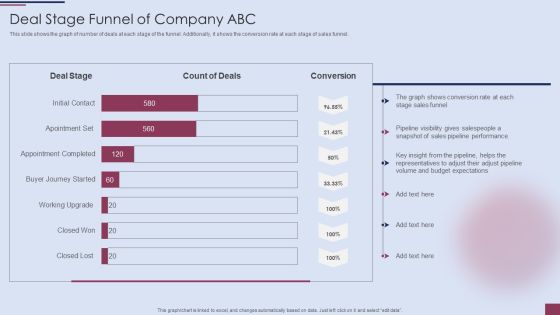
Sales Process Management To Boost Business Effectiveness Deal Stage Funnel Of Company ABC Mockup PDF
This slide shows the graph of number of deals at each stage of the funnel. Additionally, it shows the conversion rate at each stage of sales funnel.Deliver and pitch your topic in the best possible manner with this Sales Process Management To Boost Business Effectiveness Deal Stage Funnel Of Company ABC Mockup PDF. Use them to share invaluable insights on Shows Conversion, Sales Funnel, Pipeline Performance and impress your audience. This template can be altered and modified as per your expectations. So, grab it now.

Real Estate Developers Funding Alternatives Global Real Estate Investment Volume In 2022 Brochure PDF
This slide portrays informational stats about global real estate investment volume for 2022. Here the graph shows that real estate investment volume will fall by 38 percentage. Deliver and pitch your topic in the best possible manner with this Real Estate Developers Funding Alternatives Global Real Estate Investment Volume In 2022 Brochure PDF. Use them to share invaluable insights on Real Estate Investment, Border Capital and impress your audience. This template can be altered and modified as per your expectations. So, grab it now.

Software Products And Solutions Firm Details Operating Profit And Margin Mockup PDF
This slide illustrates a graph of operating profit in US dollar and operating margin in percentage for software company illustrating growth trend in last five years from 2018 to 2022. It also showcases operating profit contribution by services and solutions. Deliver an awe inspiring pitch with this creative Software Products And Solutions Firm Details Operating Profit And Margin Mockup PDF bundle. Topics like Operating Profit, Services Operating Profit, Solutions Operating Profit can be discussed with this completely editable template. It is available for immediate download depending on the needs and requirements of the user.
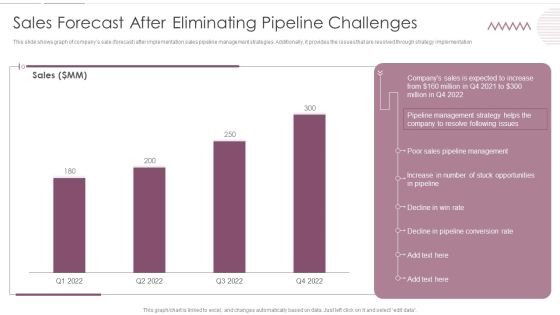
Sales Management Pipeline For Effective Lead Generation Sales Forecast After Eliminating Pipeline Challenges Inspiration PDF
This slide shows graph of companys sale forecast after implementation sales pipeline management strategies. Additionally, it provides the issues that are resolved through strategy implementation. Deliver and pitch your topic in the best possible manner with this Sales Management Pipeline For Effective Lead Generation Sales Forecast After Eliminating Pipeline Challenges Inspiration PDF. Use them to share invaluable insights on Sales Pipeline Management, Opportunities, Pipeline Conversion Rate and impress your audience. This template can be altered and modified as per your expectations. So, grab it now.

Business Software Development Company Profile Gross Profit And Margin Microsoft PDF
This slide illustrates a graph of gross profit in US dollar and gross margin in percentage for software company illustrating growth trend in last five years from 2018 to 2022. It also showcases gross profit contribution by services and solutions. Deliver and pitch your topic in the best possible manner with this Business Software Development Company Profile Gross Profit And Margin Microsoft PDF. Use them to share invaluable insights on Total Gross Profit, Services Gross Profit, Solutions Gross Profit and impress your audience. This template can be altered and modified as per your expectations. So, grab it now.

Business Software Development Company Profile Operating Profit And Margin Summary PDF
This slide illustrates a graph of operating profit in US dollar and operating margin in percentage for software company illustrating growth trend in last five years from 2018 to 2022. It also showcases operating profit contribution by services and solutions. Deliver and pitch your topic in the best possible manner with this Business Software Development Company Profile Operating Profit And Margin Summary PDF. Use them to share invaluable insights on Operating Profit, Services Operating Profit, Solutions Operating Profit and impress your audience. This template can be altered and modified as per your expectations. So, grab it now.

Project Metrics Dashboard Depicting Issue Description Rules PDF
This slide focuses on the project management dashboard which covers the name of the company, department, project manager, statuses with tally, priorities using pie graph describing not started, in progress and closed projects and describes the issues such as timing, milestones, etc. Showcasing this set of slides titled Project Metrics Dashboard Depicting Issue Description Rules PDF. The topics addressed in these templates are Project Metrics, Dashboard Depicting. All the content presented in this PPT design is completely editable. Download it and make adjustments in color, background, font etc. as per your unique business setting.

Infotech Solutions Research And Development Company Summary Net Profit And Margin Information PDF
This slide illustrates a graph of net profit in US dollar and net margin in percentage for IT company illustrating growth trend in last five years from 2018 to 2022. It also showcases net profit contribution by services and solutions. Deliver and pitch your topic in the best possible manner with this Infotech Solutions Research And Development Company Summary Net Profit And Margin Information PDF. Use them to share invaluable insights on Profit Contribution, Services, Net Profit and impress your audience. This template can be altered and modified as per your expectations. So, grab it now.

Average Transactional Value Per User In Fintech Market Download PDF
This slide portrays informational stats on average transactional value per user in FinTech market. Here the graph shows that digital payment segment will record a an average transaction of dollar 3,556 per user. Deliver and pitch your topic in the best possible manner with this Average Transactional Value Per User In Fintech Market Download PDF. Use them to share invaluable insights on Digital Payments Segments, Average Transaction Value, Finance and impress your audience. This template can be altered and modified as per your expectations. So, grab it now.
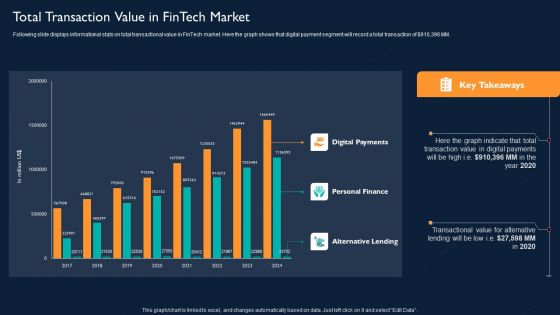
Technology Investment To Enhance Business Growth Total Transaction Value In Fintech Market Portrait PDF
Following slide displays informational stats on total transactional value in FinTech market. Here the graph shows that digital payment segment will record a total transaction of dollar 910,396 MM. Deliver an awe inspiring pitch with this creative Technology Investment To Enhance Business Growth Total Transaction Value In Fintech Market Portrait PDF bundle. Topics like Digital Payments, Transactional Value, Digital Payments, Personal Finance can be discussed with this completely editable template. It is available for immediate download depending on the needs and requirements of the user.

Emerging Software Development Trends Analysis Statistical Diagrams PDF
This slide shows the statistical graph representing the data related to emerging trends in the software development. It shows the change in usage of AI native apps, mix hybrid and native and AI hybrid for different years. Deliver and pitch your topic in the best possible manner with this Emerging Software Development Trends Analysis Statistical Diagrams PDF. Use them to share invaluable insights on Emerging Software Development, Trends Analysis Statistical and impress your audience. This template can be altered and modified as per your expectations. So, grab it now.
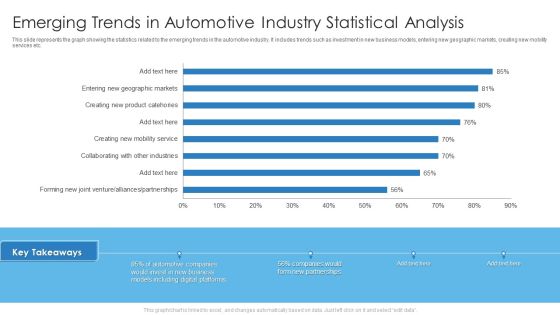
Emerging Trends In Automotive Industry Statistical Analysis Mockup PDF
This slide represents the graph showing the statistics related to the emerging trends in the automotive industry. It includes trends such as investment in new business models, entering new geographic markets, creating new mobility services etc. Deliver an awe inspiring pitch with this creative Emerging Trends In Automotive Industry Statistical Analysis Mockup PDF bundle. Topics like Emerging Trends In Automotive, Industry Statistical Analysis can be discussed with this completely editable template. It is available for immediate download depending on the needs and requirements of the user.
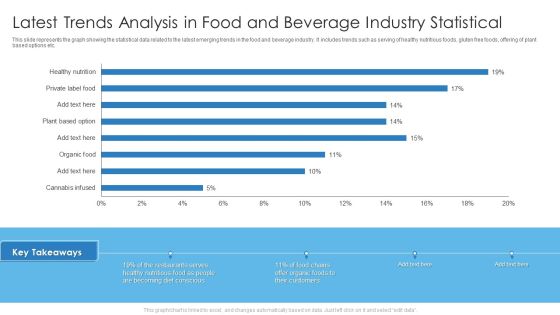
Latest Trends Analysis In Food And Beverage Industry Statistical Graphics PDF
This slide represents the graph showing the statistical data related to the latest emerging trends in the food and beverage industry. It includes trends such as serving of healthy nutritious foods, gluten free foods, offering of plant based options etc. Deliver and pitch your topic in the best possible manner with this Latest Trends Analysis In Food And Beverage Industry Statistical Graphics PDF. Use them to share invaluable insights on Latest Trends Analysis, Food And Beverage, Industry Statistical and impress your audience. This template can be altered and modified as per your expectations. So, grab it now.

Social Media Influencer Marketing Trend Analysis Statistical Themes PDF
This slide shows the graph representing the statistical data related to the emerging trends in the field of social media influencer marketing. It shows the upcoming trends in influencer marketing in the near future. Deliver an awe inspiring pitch with this creative Social Media Influencer Marketing Trend Analysis Statistical Themes PDF bundle. Topics like Social Media Influencer, Marketing Trend Analysis Statistical can be discussed with this completely editable template. It is available for immediate download depending on the needs and requirements of the user.

B2B Content Marketing Latest Trend Analysis Statistical Icons PDF
This slide shows the graph representing the statistical data related to latest trends emerging in the field of content marketing. It includes trends such as blog posts, email newsletters, case studies, videos, virtual events, infographics etc. Deliver an awe inspiring pitch with this creative B2B Content Marketing Latest Trend Analysis Statistical Icons PDF bundle. Topics like B2b Content Marketing, Latest Trend Analysis Statistical can be discussed with this completely editable template. It is available for immediate download depending on the needs and requirements of the user.
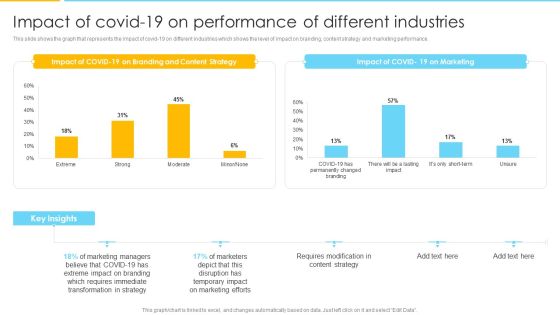
Optimizing Ecommerce Marketing Plan To Improve Sales Impact Of Covid 19 On Performance Of Different Industries Formats PDF
This slide shows the graph that represents the impact of covid 19 on different industries which shows the level of impact on branding, content strategy and marketing performance. Deliver an awe inspiring pitch with this creative Optimizing Ecommerce Marketing Plan To Improve Sales Impact Of Covid 19 On Performance Of Different Industries Formats PDF bundle. Topics like Transformation In Strategy, Marketing Managers, Content Strategy can be discussed with this completely editable template. It is available for immediate download depending on the needs and requirements of the user.

IT Application Services Company Outline Net Profit And Margin Structure PDF
This slide illustrates a graph of net profit in US dollar and net margin in percentage for IT company illustrating growth trend in last five years from 2018 to 2022. It also showcases net profit contribution by services and solutions. Deliver and pitch your topic in the best possible manner with this IT Application Services Company Outline Net Profit And Margin Structure PDF. Use them to share invaluable insights on Net Profit Margin, Services, Margin and impress your audience. This template can be altered and modified as per your expectations. So, grab it now.

Merger And Acquisition Buying Strategy For Business Growth Mergers And Acquisitions By Sector Designs PDF
The slide illustrates the graph of number of merger and acquisition deals by sector that the company has completed in last five years. It also covers key facts CAGR growth, deal value etc. related to merger and acquisition deals of the company. Deliver an awe inspiring pitch with this creative Merger And Acquisition Buying Strategy For Business Growth Mergers And Acquisitions By Sector Designs PDF bundle. Topics like Acquisition Value, Financials Services Sector can be discussed with this completely editable template. It is available for immediate download depending on the needs and requirements of the user.
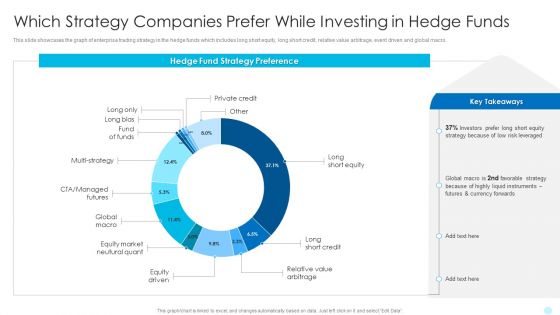
Which Strategy Companies Prefer While Investing In Hedge Funds Hedge Fund Performance Information PDF
This slide showcases the graph of enterprise trading strategy in the hedge funds which includes long short equity, long short credit, relative value arbitrage, event driven and global macro. Deliver an awe inspiring pitch with this creative Which Strategy Companies Prefer While Investing In Hedge Funds Hedge Fund Performance Information PDF bundle. Topics like Hedge Fund Strategy Preference, Relative Value Arbitrage, Private Credit can be discussed with this completely editable template. It is available for immediate download depending on the needs and requirements of the user.
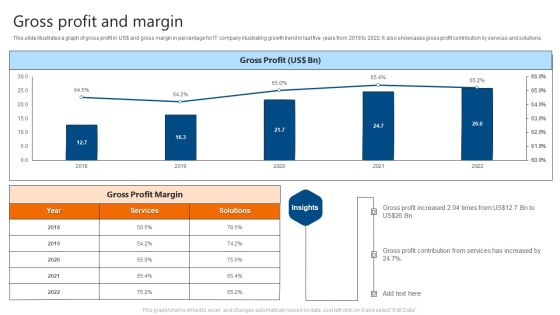
Gross Profit And Margin IT Software Development Company Profile Slides PDF
This slide illustrates a graph of gross profit in US doller and gross margin in percentage for IT company illustrating growth trend in last five years from 2018 to 2022. It also showcases gross profit contribution by services and solutions. Deliver and pitch your topic in the best possible manner with this Gross Profit And Margin IT Software Development Company Profile Slides PDF. Use them to share invaluable insights on Gross Profit, Margin and impress your audience. This template can be altered and modified as per your expectations. So, grab it now.

Operating Profit And Margin IT Software Development Company Profile Guidelines PDF
This slide illustrates a graph of operating profit in US doller and operating margin in percentage for IT company illustrating growth trend in last five years from 2018 to 2022. It also showcases operating profit contribution by services and solutions. Deliver and pitch your topic in the best possible manner with this Operating Profit And Margin IT Software Development Company Profile Guidelines PDF. Use them to share invaluable insights on Operating Profit, Operating Profit Margin and impress your audience. This template can be altered and modified as per your expectations. So, grab it now.
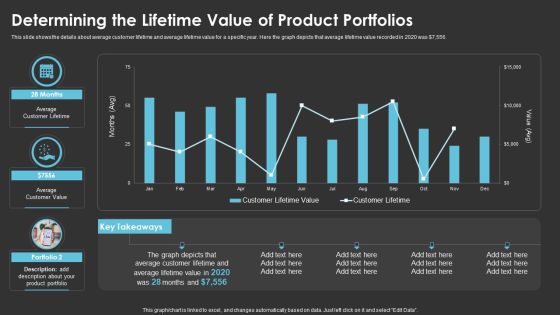
Method To Introduce New Product Offerings In The Industry Determining The Lifetime Value Of Product Portfolios Information PDF
This slide shows the details about average customer lifetime and average lifetime value for a specific year. Here the graph depicts that average lifetime value recorded in 2020 was dollar 7,556. Deliver an awe inspiring pitch with this creative Method To Introduce New Product Offerings In The Industry Determining The Lifetime Value Of Product Portfolios Information PDF bundle. Topics like Average Customer Lifetime, Product Portfolio can be discussed with this completely editable template. It is available for immediate download depending on the needs and requirements of the user.

Buy Side Merger And Acquisition Pitch Book Mergers And Acquisitions By Sector Summary PDF
The slide illustrates the graph of number of merger and acquisition deals by sector that the company has completed in last five years. It also covers key facts CAGR growth, deal value etc. related to merger and acquisition deals of the company. Deliver an awe inspiring pitch with this creative Buy Side Merger And Acquisition Pitch Book Mergers And Acquisitions By Sector Summary PDF bundle. Topics like Financials Services, Acquisition Value can be discussed with this completely editable template. It is available for immediate download depending on the needs and requirements of the user.
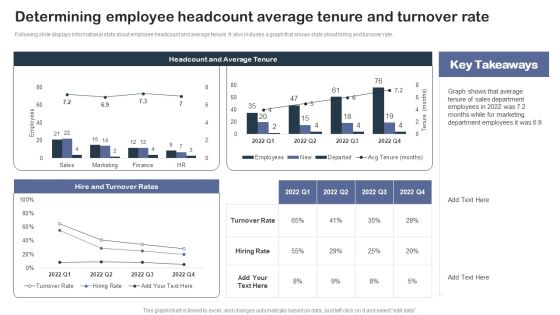
Staff Succession Planning And Development Determining Employee Headcount Average Elements PDF
Following slide displays informational stats about employee headcount and average tenure. It also includes a graph that shows stats about hiring and turnover rate.Get a simple yet stunning designed Staff Succession Planning And Development Determining Employee Headcount Average Elements PDF. It is the best one to establish the tone in your meetings. It is an excellent way to make your presentations highly effective. So, download this PPT today from Slidegeeks and see the positive impacts. Our easy-to-edit Staff Succession Planning And Development Determining Employee Headcount Average Elements PDF can be your go-to option for all upcoming conferences and meetings. So, what are you waiting for Grab this template today.

Buy Side Advisory Services In M And A Management Vs Consensus Revenue Forecast Ideas PDF
The graph depicts a revenue comparison between management and consensus. It shows historical 2015 to 2020 and projected revenue 2021 to 2024.Want to ace your presentation in front of a live audience Our Buy Side Advisory Services In M And A Management Vs Consensus Revenue Forecast Ideas PDF can help you do that by engaging all the users towards you. Slidegeeks experts have put their efforts and expertise into creating these impeccable powerpoint presentations so that you can communicate your ideas clearly. Moreover, all the templates are customizable, and easy-to-edit and downloadable. Use these for both personal and commercial use.

Inbound Leads Generation And Conversion Analytics Ppt Summary Show PDF
This slide covers record of prospects visits and leads generated using different sources. It includes sources such as organic search, referrals, social media, email marketing, paid search, direct traffic, etc. along with total visits, conversion rates, contacts generated, customers count, conversion rates and graph depicting monthly visits using these sources. Showcasing this set of slides titled Inbound Leads Generation And Conversion Analytics Ppt Summary Show PDF. The topics addressed in these templates are Organic Search, Referrals, Social Media. All the content presented in this PPT design is completely editable. Download it and make adjustments in color, background, font etc. as per your unique business setting.

Determining Current And Future Qualification Demand Investment In Latest Technology To Ensure Formats PDF
Following slide shows informational stats on employees current and future qualification demand. Here the graph shows that there will be a huge increase in the demand for employees having qualification in data science after five years.Want to ace your presentation in front of a live audience Our Determining Current And Future Qualification Demand Investment In Latest Technology To Ensure Formats PDF can help you do that by engaging all the users towards you.. Slidegeeks experts have put their efforts and expertise into creating these impeccable powerpoint presentations so that you can communicate your ideas clearly. Moreover, all the templates are customizable, and easy-to-edit and downloadable. Use these for both personal and commercial use.
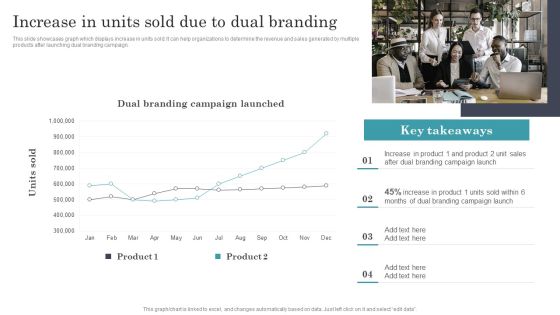
Developing Dual Branding Campaign For Brand Marketing Increase In Units Sold Due To Dual Branding Sample PDF
This slide showcases graph which displays increase in units sold. It can help organizations to determine the revenue and sales generated by multiple products after launching dual branding campaign. Want to ace your presentation in front of a live audience Our Developing Dual Branding Campaign For Brand Marketing Increase In Units Sold Due To Dual Branding Sample PDF can help you do that by engaging all the users towards you. Slidegeeks experts have put their efforts and expertise into creating these impeccable powerpoint presentations so that you can communicate your ideas clearly. Moreover, all the templates are customizable, and easy to edit and downloadable. Use these for both personal and commercial use.
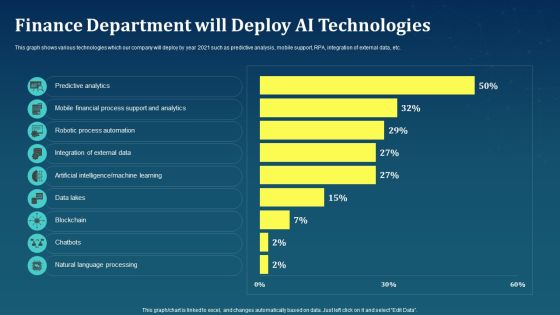
Finance Department Will Deploy AI Technologies AI For Brand Administration Graphics PDF
This graph shows various technologies which our company will deploy by year 2021 such as predictive analysis, mobile support, RPA, integration of external data, etc.Present like a pro with Finance Department Will Deploy AI Technologies AI For Brand Administration Graphics PDF Create beautiful presentations together with your team, using our easy-to-use presentation slides. Share your ideas in real-time and make changes on the fly by downloading our templates. So whether you are in the office, on the go, or in a remote location, you can stay in sync with your team and present your ideas with confidence. With Slidegeeks presentation got a whole lot easier. Grab these presentations today.
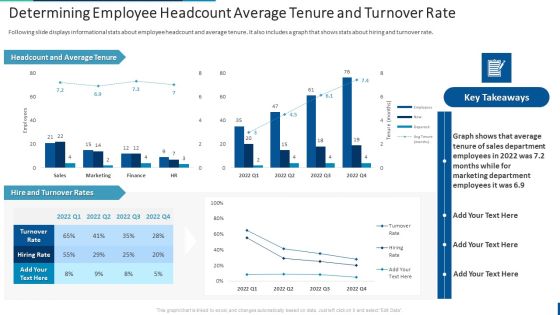
Internal Employee Succession Determining Employee Headcount Average Tenure Inspiration PDF
Following slide displays informational stats about employee headcount and average tenure. It also includes a graph that shows stats about hiring and turnover rate. Present like a pro with Internal Employee Succession Determining Employee Headcount Average Tenure Inspiration PDF Create beautiful presentations together with your team, using our easy-to-use presentation slides. Share your ideas in real-time and make changes on the fly by downloading our templates. So whether youre in the office, on the go, or in a remote location, you can stay in sync with your team and present your ideas with confidence. With Slidegeeks presentation got a whole lot easier. Grab these presentations today.

Annual Installation Data For Industrial Automation Machines Microsoft PDF
The slide illustrates a number of industrial data installed in companies for implementing automated intensive production tasks. The graph shows number of units installed in past and current years with estimated installation of robots. Showcasing this set of slides titled Annual Installation Data For Industrial Automation Machines Microsoft PDF. The topics addressed in these templates are Annual Installation Data, Industrial Automation Machines. All the content presented in this PPT design is completely editable. Download it and make adjustments in color, background, font etc. as per your unique business setting.

Quarterly Business Performance Sales Performance Review Clipart PDF
The following slide highlights the quarter wise sales performance to analyse the trend. It includes elements such as product wise sales revenue graph along with comparison of planned VS actual results etc. Showcasing this set of slides titled Quarterly Business Performance Sales Performance Review Clipart PDF. The topics addressed in these templates are Quarterly Business, Performance Sales Performance. All the content presented in this PPT design is completely editable. Download it and make adjustments in color, background, font etc. as per your unique business setting.

Comparison Of Budgeted And Actual Expenses Stages To Develop Demand Generation Tactics Information PDF
The slides shows graphical comparison of companys planned and actual promotional expenses. Further, it shows the graph of budget deviation by month. Want to ace your presentation in front of a live audience Our Comparison Of Budgeted And Actual Expenses Stages To Develop Demand Generation Tactics Information PDF can help you do that by engaging all the users towards you. Slidegeeks experts have put their efforts and expertise into creating these impeccable powerpoint presentations so that you can communicate your ideas clearly. Moreover, all the templates are customizable, and easy-to-edit and downloadable. Use these for both personal and commercial use.
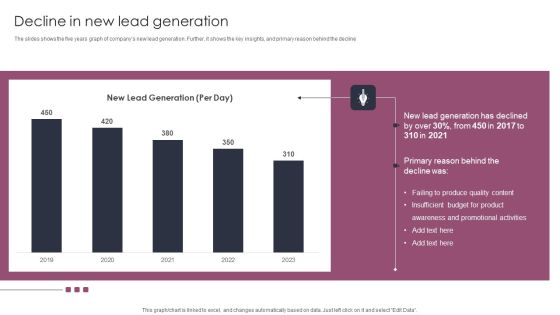
Decline In New Lead Generation Stages To Develop Demand Generation Tactics Topics PDF
The slides shows the five years graph of companys new lead generation. Further, it shows the key insights, and primary reason behind the decline. Present like a pro with Decline In New Lead Generation Stages To Develop Demand Generation Tactics Topics PDF Create beautiful presentations together with your team, using our easy-to-use presentation slides. Share your ideas in real-time and make changes on the fly by downloading our templates. So whether you are in the office, on the go, or in a remote location, you can stay in sync with your team and present your ideas with confidence. With Slidegeeks presentation got a whole lot easier. Grab these presentations today.
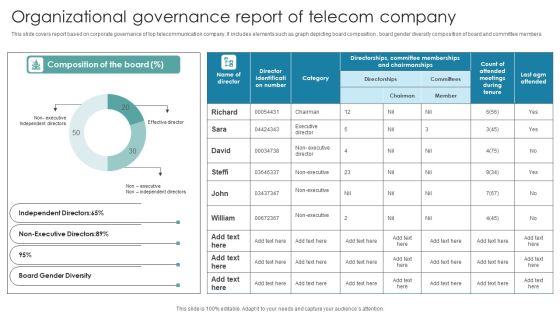
Organizational Governance Report Of Telecom Company Topics PDF
This slide covers report based on corporate governance of top telecommunication company. It includes elements such as graph depicting board composition , board gender diversity composition of board and committee members. Showcasing this set of slides titled Organizational Governance Report Of Telecom Company Topics PDF. The topics addressed in these templates are Report Of Telecom Company, Organizational Governance. All the content presented in this PPT design is completely editable. Download it and make adjustments in color, background, font etc. as per your unique business setting.
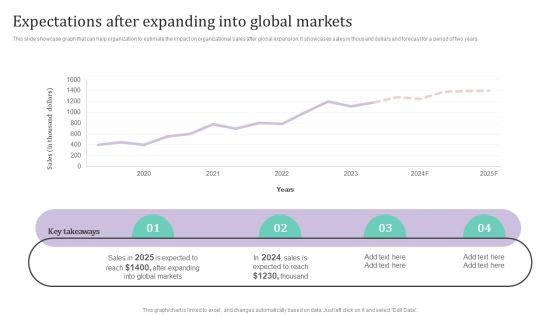
Expectations After Expanding Into Global Markets Ppt PowerPoint Presentation Diagram Lists PDF
This slide showcase graph that can help organization to estimate the impact on organizational sales after global expansion. It showcases sales in thousand dollars and forecast for a period of two years.Want to ace your presentation in front of a live audience Our Expectations After Expanding Into Global Markets Ppt PowerPoint Presentation Diagram Lists PDF can help you do that by engaging all the users towards you.. Slidegeeks experts have put their efforts and expertise into creating these impeccable powerpoint presentations so that you can communicate your ideas clearly. Moreover, all the templates are customizable, and easy-to-edit and downloadable. Use these for both personal and commercial use.
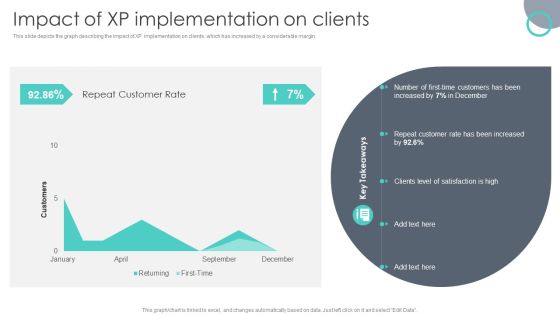
Extreme Programming Methodology Impact Of XP Implementation On Clients Themes PDF
This slide depicts the graph describing the impact of XP implementation on clients, which has increased by a considerable margin. Want to ace your presentation in front of a live audience Our Extreme Programming Methodology Impact Of XP Implementation On Clients Themes PDF can help you do that by engaging all the users towards you. Slidegeeks experts have put their efforts and expertise into creating these impeccable powerpoint presentations so that you can communicate your ideas clearly. Moreover, all the templates are customizable, and easy to edit and downloadable. Use these for both personal and commercial use.
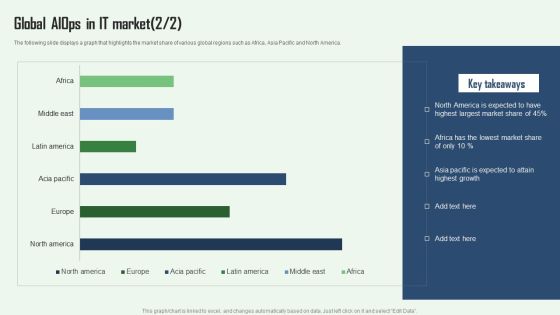
Global Aiops In IT Market Aiops Integration Summary Report Designs PDF
The following slide displays a graph that highlights the market share of various global regions such as Africa, Asia Pacific and North America. This Global Aiops In IT Market Aiops Integration Summary Report Designs PDF is perfect for any presentation, be it in front of clients or colleagues. It is a versatile and stylish solution for organizing your meetings. The Global Aiops In IT Market Aiops Integration Summary Report Designs PDF features a modern design for your presentation meetings. The adjustable and customizable slides provide unlimited possibilities for acing up your presentation. Slidegeeks has done all the homework before launching the product for you. So, do not wait, grab the presentation templates today.

Media Advertising Social Media Interaction With ROI Slides PDF
This slide shows the graph depicting the rising revenue after switching into new digital channels as compared with previous year. This Media Advertising Social Media Interaction With ROI Slides PDF is perfect for any presentation, be it in front of clients or colleagues. It is a versatile and stylish solution for organizing your meetings. The Media Advertising Social Media Interaction With ROI Slides PDF features a modern design for your presentation meetings. The adjustable and customizable slides provide unlimited possibilities for acing up your presentation. Slidegeeks has done all the homework before launching the product for you. So, do not wait, grab the presentation templates today

Global Sales Of Top Healthcare Equipment Companies Clipart PDF
This slide shows sales graph of top 10 global players in field of medical sales with their revenue for the year of 2023. It include determinants of sales, sales revenue of global players for 2023 etc. Showcasing this set of slides titled Global Sales Of Top Healthcare Equipment Companies Clipart PDF. The topics addressed in these templates are Total Market, Medical Device, Registered Players. All the content presented in this PPT design is completely editable. Download it and make adjustments in color, background, font etc. as per your unique business setting.

Consulting Firm Business Profile EBITDA Mockup PDF
This slide illustrates a graph of EBITDA for Kantar company showing growth trend in from 2021. It also showcases key insights for EBITDA highlighting estimated EBITDA for 2022 and 2023 Present like a pro with Consulting Firm Business Profile EBITDA Mockup PDF Create beautiful presentations together with your team, using our easy to use presentation slides. Share your ideas in real time and make changes on the fly by downloading our templates. So whether you are in the office, on the go, or in a remote location, you can stay in sync with your team and present your ideas with confidence. With Slidegeeks presentation got a whole lot easier. Grab these presentations today.

Major Challenges In Growth And Development Program Guidelines PDF
The following slide highlights the major challenges faced by an organization in executing training and development program to enhance productivity and retain top talent. The graph constitutes of major causes such as insufficient time, lack of resources, costly process etc. Showcasing this set of slides titled Major Challenges In Growth And Development Program Guidelines PDF. The topics addressed in these templates are Major Challenges In Growth, Development Program. All the content presented in this PPT design is completely editable. Download it and make adjustments in color, background, font etc. as per your unique business setting.

Debt To Equity Financial Ratios Chart Comparison Download PDF
This slide illustrates debt to equity ratio graph that can help to evaluate total debt and financial liabilities against the total shareholders equity. It showcases comparison for a period of last four quarters Pitch your topic with ease and precision using this debt to equity financial ratios chart comparison download pdf. This layout presents information on debt to equity financial ratios chart comparison. It is also available for immediate download and adjustment. So, changes can be made in the color, design, graphics or any other component to create a unique layout.
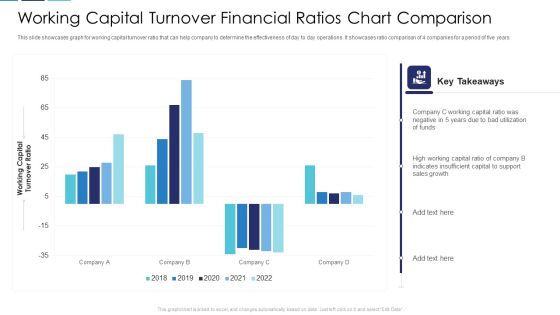
Working Capital Turnover Financial Ratios Chart Comparison Clipart PDF
This slide showcases graph for working capital turnover ratio that can help company to determine the effectiveness of day to day operations. It showcases ratio comparison of 4 companies for a period of five years Pitch your topic with ease and precision using this working capital turnover financial ratios chart comparison clipart pdf. This layout presents information on working capital turnover financial ratios chart comparison. It is also available for immediate download and adjustment. So, changes can be made in the color, design, graphics or any other component to create a unique layout.

Company Turnover Financial Ratios Chart Comparison Icons PDF
This slide illustrates graph for turnover ratios that are accounts receivable, inventory turnover, accounts payable turnover, fixed asset turnover and total assets turnover ratio. It showcases comparison of three companies. Pitch your topic with ease and precision using this company turnover financial ratios chart comparison icons pdf. This layout presents information on company turnover financial ratios chart comparison. It is also available for immediate download and adjustment. So, changes can be made in the color, design, graphics or any other component to create a unique layout.
Six Months Business Valuation Chart Ppt Styles Icons PDF
This slide shows the 6 months graph to measure company valuation. It is representing that highest valuation of company was calculated in the month of June due to increase in sales. Pitch your topic with ease and precision using this Six Months Business Valuation Chart Ppt Styles Icons PDF. This layout presents information on Increase Sales, Company Valuation. It is also available for immediate download and adjustment. So, changes can be made in the color, design, graphics or any other component to create a unique layout.

Financial Chart For Current And Quick Financial Ratios Comparison Brochure PDF
This slide showcases current and quick ratio graph that can help to evaluate companys liquidity and and assess the company abilities to pay off debt. It also showcases comparison of ratio with previous financial year Pitch your topic with ease and precision using this financial chart for current and quick financial ratios comparison brochure pdf. This layout presents information on financial chart for current and quick financial ratios comparison. It is also available for immediate download and adjustment. So, changes can be made in the color, design, graphics or any other component to create a unique layout.

Usage Trend Chart Of Skincare Product Market Ppt Slides Graphics Download PDF
This slide shows market trend graph of skincare product usage in four quarters. It also indicates that product A is most preferred by the customers. Pitch your topic with ease and precision using this Usage Trend Chart Of Skincare Product Market Ppt Slides Graphics Download PDF. This layout presents information on Trend Product, Skincare Product, Quarter Due. It is also available for immediate download and adjustment. So, changes can be made in the color, design, graphics or any other component to create a unique layout.
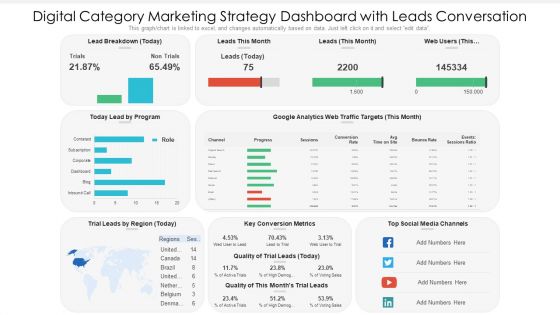
Digital Category Marketing Strategy Dashboard With Leads Conversation Ppt PowerPoint Presentation Slides Information PDF
This graph chart is linked to excel, and changes automatically based on data. Just left click on it and select edit data. Pitch your topic with ease and precision using this digital category marketing strategy dashboard with leads conversation ppt powerpoint presentation slides information pdf. This layout presents information on key conversion metrics, social media channels, lead by program. It is also available for immediate download and adjustment. So, changes can be made in the color, design, graphics or any other component to create a unique layout.
Finance Metrics Dashboard Illustrating Account Payables Icons PDF
This graph or chart is linked to excel, and changes automatically based on data. Just left click on it and select edit data. Pitch your topic with ease and precision using this Total Income Budget, Total Expenses Balance, Net Profit Quick, Ratio Current Ratio. This layout presents information on Account Payable Age, Average Creditor Days, Cash On Hand. It is also available for immediate download and adjustment. So, changes can be made in the color, design, graphics or any other component to create a unique layout.

Client Helpline Dashboard At Valet Information Dsk Ppt Gallery Slide Portrait PDF
This graph or chart is linked to excel, and changes automatically based on data. Just left click on it and select Edit Data. Pitch your topic with ease and precision using this Client Helpline Dashboard At Valet Information Dsk Ppt Gallery Slide Portrait PDF. This layout presents information on Valet Damage Claims, Valet Wait Times, Information Desk. It is also available for immediate download and adjustment. So, changes can be made in the color, design, graphics or any other component to create a unique layout.

Client Helpline Dashboard With Retention Rate Ppt Gallery Ideas PDF
This graph or chart is linked to excel, and changes automatically based on data. Just left click on it and select Edit Data. Pitch your topic with ease and precision using this Client Helpline Dashboard With Retention Rate Ppt Gallery Ideas PDF. This layout presents information on Cost per Support 2022, Total Requests, Total Revenue 2022, Avg Requests Answered. It is also available for immediate download and adjustment. So, changes can be made in the color, design, graphics or any other component to create a unique layout.

Firm KPI Dashboard With Average Click Through Rate Ppt Inspiration Sample PDF
This graph or chart is linked to excel, and changes automatically based on data. Just left click on it and select Edit Data. Pitch your topic with ease and precision using this Firm KPI Dashboard With Average Click Through Rate Ppt Inspiration Sample PDF. This layout presents information on Total Clicks, Total Impressive, Average CTR, Average Position. It is also available for immediate download and adjustment. So, changes can be made in the color, design, graphics or any other component to create a unique layout.

Firm KPI Dashboard With Schedule Performance Index Ppt Visual Aids PDF
This graph or chart is linked to excel, and changes automatically based on data. Just left click on it and select Edit Data. Pitch your topic with ease and precision using this Firm KPI Dashboard With Schedule Performance Index Ppt Visual Aids PDF. This layout presents information on Project Cost Performance, Project Planning Stage, Monitor And Control. It is also available for immediate download and adjustment. So, changes can be made in the color, design, graphics or any other component to create a unique layout.

Service Level Agreement KPI Dashboard With Current Risk Statistics Topics PDF
This graph or chart is linked to excel, and changes automatically based on data. Just left click on it and select Edit Data. Pitch your topic with ease and precision using this Service Level Agreement KPI Dashboard With Current Risk Statistics Topics PDF. This layout presents information on Current Risk SLAS, Current Breached Slas, Personal Active SLA It is also available for immediate download and adjustment. So, changes can be made in the color, design, graphics or any other component to create a unique layout.

Company Financial Performance Indicators Dashboard With Liquidity And Turnover Ratios Formats PDF
This graph or chart is linked to excel, and changes automatically based on data. Just left click on it and select Edit Data. Pitch your topic with ease and precision using this Company Financial Performance Indicators Dashboard With Liquidity And Turnover Ratios Formats PDF. This layout presents information on Cash Balance, Days Inventory Outstanding, Days Payable Outstanding. It is also available for immediate download and adjustment. So, changes can be made in the color, design, graphics or any other component to create a unique layout.

Power Plant Energy Production Dashboard For Consumption Statistics Download PDF
This graph or chart is linked to excel, and changes automatically based on data. Just left click on it and select edit data. Pitch your topic with ease and precision using this Multiple Country Energy Consumption Statistics Comparison Dashboard Formats PDF. This layout presents information on August Year 2022, Return on Investments, Power Plan Detail . It is also available for immediate download and adjustment. So, changes can be made in the color, design, graphics or any other component to create a unique layout.
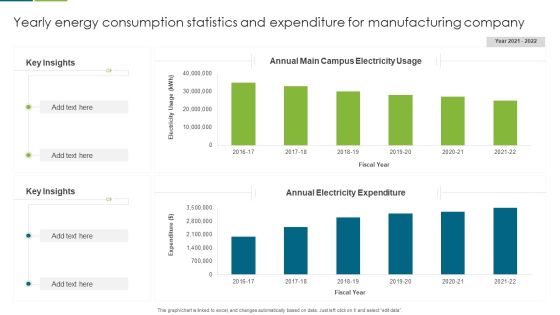
Yearly Energy Consumption Statistics And Expenditure For Manufacturing Company Guidelines PDF
This graph or chart is linked to excel, and changes automatically based on data. Just left click on it and select edit data. Pitch your topic with ease and precision using this Yearly Energy Consumption Statistics And Expenditure For Manufacturing Company Guidelines PDF. This layout presents information on Key Insights, Annual Electricity Expenditure, Annual Main Campus, Electricity Usage. It is also available for immediate download and adjustment. So, changes can be made in the color, design, graphics or any other component to create a unique layout.

SLA KPL Dashboard Illustrating Risk And Active Services Ppt Portfolio Design Inspiration PDF
This graph or chart is linked to excel, and changes automatically based on data. Just left click on it and select Edit Data. Pitch your topic with ease and precision using this SLA KPL Dashboard Illustrating Risk And Active Services Ppt Portfolio Design Inspiration PDF. This layout presents information on My Active SLAs, Database Group, Priority. It is also available for immediate download and adjustment. So, changes can be made in the color, design, graphics or any other component to create a unique layout.
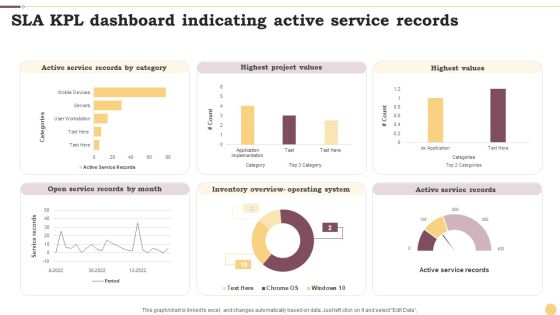
SLA KPL Dashboard Indicating Active Service Records Ppt Professional Graphics Example PDF
This graph or chart is linked to excel, and changes automatically based on data. Just left click on it and select Edit Data. Pitch your topic with ease and precision using this SLA KPL Dashboard Indicating Active Service Records Ppt Professional Graphics Example PDF. This layout presents information on Active Service Records, Highest Project Values, Highest Values. It is also available for immediate download and adjustment. So, changes can be made in the color, design, graphics or any other component to create a unique layout.

Kanban Structure To Track Proposed Active And Completed Activities Ppt Outline Slide Portrait PDF
This graph or chart is linked to excel, and changes automatically based on data. Just left click on it and select Edit Data. Pitch your topic with ease and precision using this Kanban Structure To Track Proposed Active And Completed Activities Ppt Outline Slide Portrait PDF. This layout presents information on Project Lead Time, Cycle Time, Completed. It is also available for immediate download and adjustment. So, changes can be made in the color, design, graphics or any other component to create a unique layout.

Kanban Structure With Task Count And Cycle Time Ppt Layouts Background Designs PDF
This graph or chart is linked to excel, and changes automatically based on data. Just left click on it and select Edit Data. Pitch your topic with ease and precision using this Kanban Structure With Task Count And Cycle Time Ppt Layouts Background Designs PDF. This layout presents information on Required Project Design, Project Design Approval, Construct. It is also available for immediate download and adjustment. So, changes can be made in the color, design, graphics or any other component to create a unique layout.
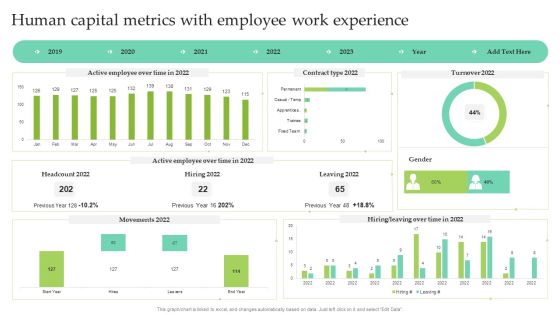
Human Capital Metrics With Employee Work Experience Ppt Show Images PDF
This graph or chart is linked to excel, and changes automatically based on data. Just left click on it and select Edit Data. Pitch your topic with ease and precision using this Human Capital Metrics With Employee Work Experience Ppt Show Images PDF. This layout presents information on Active Employee, Over Time, Contract Type 2022, Leaving 2022. It is also available for immediate download and adjustment. So, changes can be made in the color, design, graphics or any other component to create a unique layout.

Search Engine Optimization Services Dashboard With Google Ranking Ppt Gallery Demonstration PDF
This slide covers the different SEO services and the impact of them on the business. It includes the number of website visitors, Google ranking , site audit score, audience growth graph and many more things. Pitch your topic with ease and precision using this Search Engine Optimization Services Dashboard With Google Ranking Ppt Gallery Demonstration PDF. This layout presents information on Audience Growth Paid, Adwords Conversions Score. It is also available for immediate download and adjustment. So, changes can be made in the color, design, graphics or any other component to create a unique layout.

Yearly Saas Cloud Security Expenditure Analysis Ppt PowerPoint Presentation File Deck PDF
The following slide depicts the annual spending of organizations on SaaS security services to prevent data breaches. It constitutes of graph representing the varying expenditure based of the size of the company. Pitch your topic with ease and precision using this Yearly Saas Cloud Security Expenditure Analysis Ppt PowerPoint Presentation File Deck PDF. This layout presents information on Saas Investment, Employees. It is also available for immediate download and adjustment. So, changes can be made in the color, design, graphics or any other component to create a unique layout.
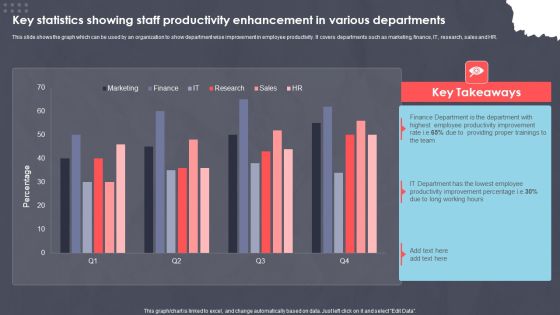
Key Statistics Showing Staff Productivity Enhancement In Various Departments Ppt PowerPoint Presentation Slides Portrait PDF
This slide shows the graph which can be used by an organization to show department wise improvement in employee productivity. It covers departments such as marketing, finance, IT, research, sales and HR. Pitch your topic with ease and precision using this Key Statistics Showing Staff Productivity Enhancement In Various Departments Ppt PowerPoint Presentation Slides Portrait PDF. This layout presents information on XXXXXXXXXXXXXXXXXXXXXXXXX. It is also available for immediate download and adjustment. So, changes can be made in the color, design, graphics or any other component to create a unique layout.
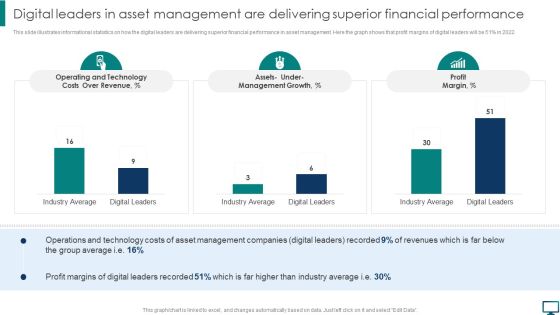
Digital Leaders In Asset Management Are Delivering Superior Financial Performance Topics PDF
This slide illustrates informational statistics on how the digital leaders are delivering superior financial performance in asset management. Here the graph shows that profit margins of digital leaders will be 51 percent in 2022. Take your projects to the next level with our ultimate collection of Digital Leaders In Asset Management Are Delivering Superior Financial Performance Topics PDF. Slidegeeks has designed a range of layouts that are perfect for representing task or activity duration, keeping track of all your deadlines at a glance. Tailor these designs to your exact needs and give them a truly corporate look with your own brand colors they will make your projects stand out from the rest.

Transforming Business With AI Company Brand Value Over Time Clipart PDF
This graph shows the current situation of our company, where it lies according to other brands. This leads to implementing AI in the organization. Take your projects to the next level with our ultimate collection of Transforming Business With AI Company Brand Value Over Time Clipart PDF. Slidegeeks has designed a range of layouts that are perfect for representing task or activity duration, keeping track of all your deadlines at a glance. Tailor these designs to your exact needs and give them a truly corporate look with your own brand colors they will make your projects stand out from the rest.
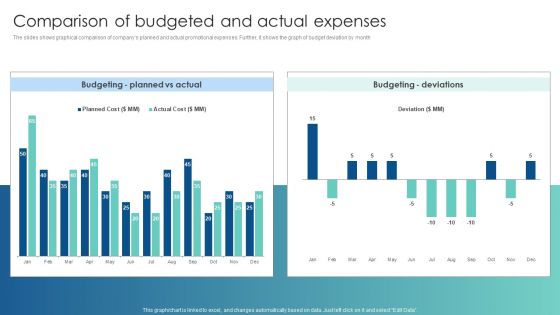
Comparison Of Budgeted And Actual Expenses Customer Acquisition Through Advertising Clipart PDF
The slides shows graphical comparison of companys planned and actual promotional expenses. Further, it shows the graph of budget deviation by month. Take your projects to the next level with our ultimate collection of Comparison Of Budgeted And Actual Expenses Customer Acquisition Through Advertising Clipart PDF. Slidegeeks has designed a range of layouts that are perfect for representing task or activity duration, keeping track of all your deadlines at a glance. Tailor these designs to your exact needs and give them a truly corporate look with your own brand colors they well make your projects stand out from the rest.
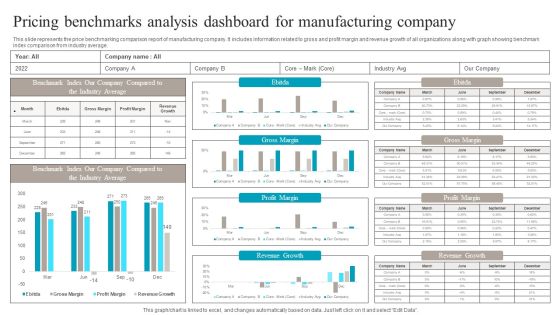
Pricing Benchmarks Analysis Dashboard For Manufacturing Company Structure PDF
This slide represents the price benchmarking comparison report of manufacturing company. It includes information related to gross and profit margin and revenue growth of all organizations along with graph showing benchmark index comparison from industry average. Pitch your topic with ease and precision using this Pricing Benchmarks Analysis Dashboard For Manufacturing Company Structure PDF. This layout presents information on Pricing Benchmarks Analysis, Dashboard For Manufacturing Company. It is also available for immediate download and adjustment. So, changes can be made in the color, design, graphics or any other component to create a unique layout.
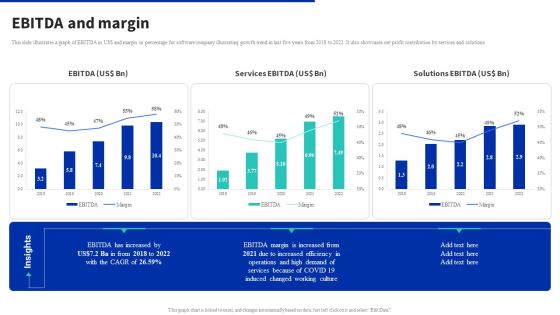
Digital Products Company Outline Ebitda And Margin Inspiration PDF
This slide illustrates a graph of EBITDA in US dollar and margin in percentage for software company illustrating growth trend in last five years from 2018 to 2022. It also showcases net profit contribution by services and solutions. Take your projects to the next level with our ultimate collection of Digital Products Company Outline Ebitda And Margin Inspiration PDF. Slidegeeks has designed a range of layouts that are perfect for representing task or activity duration, keeping track of all your deadlines at a glance. Tailor these designs to your exact needs and give them a truly corporate look with your own brand colors they will make your projects stand out from the rest.
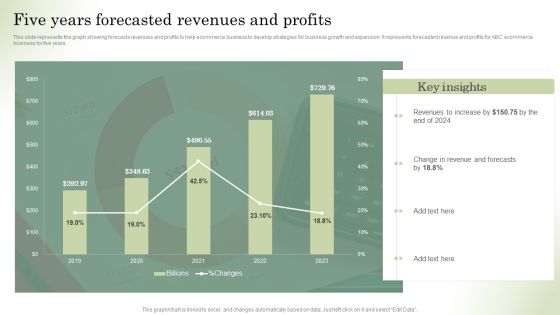
Optimizing Online Stores Five Years Forecasted Revenues And Profits Ideas PDF
This slide represents the graph showing forecasts revenues and profits to help ecommerce business to develop strategies for business growth and expansion. It represents forecasted revenue and profits for ABC ecommerce business for five years. Make sure to capture your audiences attention in your business displays with our gratis customizable Optimizing Online Stores Five Years Forecasted Revenues And Profits Ideas PDF. These are great for business strategies, office conferences, capital raising or task suggestions. If you desire to acquire more customers for your tech business and ensure they stay satisfied, create your own sales presentation with these plain slides.

Cloud Content Delivery Network Cost Reduction Post CDN Implementation Themes PDF
This slide demonstrates the graph about how bandwidth costs are reduced by 99 percent after the implementation of the content delivery network. This Cloud Content Delivery Network Cost Reduction Post CDN Implementation Themes PDF from Slidegeeks makes it easy to present information on your topic with precision. It provides customization options, so you can make changes to the colors, design, graphics, or any other component to create a unique layout. It is also available for immediate download, so you can begin using it right away. Slidegeeks has done good research to ensure that you have everything you need to make your presentation stand out. Make a name out there for a brilliant performance.

Strategic Global Expansion Business Plan Evaluating Growth Rate Of Target Market Topics PDF
This slide showcases graph that can help organization to evaluate growth rate of target market. It can help company to identify potential and suitability of target market for expanding operations globally. Take your projects to the next level with our ultimate collection of Strategic Global Expansion Business Plan Evaluating Growth Rate Of Target Market Topics PDF. Slidegeeks has designed a range of layouts that are perfect for representing task or activity duration, keeping track of all your deadlines at a glance. Tailor these designs to your exact needs and give them a truly corporate look with your own brand colors they will make your projects stand out from the rest.

Implementing An Effective Ecommerce Management Framework Five Years Forecasted Revenues And Profits Ideas PDF
This slide represents the graph showing forecasts revenues and profits to help ecommerce business to develop strategies for business growth and expansion. It represents forecasted revenue and profits for ABC ecommerce business for five years. Make sure to capture your audiences attention in your business displays with our gratis customizable Implementing An Effective Ecommerce Management Framework Five Years Forecasted Revenues And Profits Ideas PDF. These are great for business strategies, office conferences, capital raising or task suggestions. If you desire to acquire more customers for your tech business and ensure they stay satisfied, create your own sales presentation with these plain slides.

Enterprise Consumer Technology Management Financial Overview Fy 18 Demonstration PDF
The purpose of the following slide is to analyze the financial performance of the organization. The provided graph highlight the revenues, Gross profit and net profit margin of the organization for the year 2016,17,18 and 19. Take your projects to the next level with our ultimate collection of Enterprise Consumer Technology Management Financial Overview Fy 18 Demonstration PDF. Slidegeeks has designed a range of layouts that are perfect for representing task or activity duration, keeping track of all your deadlines at a glance. Tailor these designs to your exact needs and give them a truly corporate look with your own brand colors they will make your projects stand out from the rest.

Monthly Leads Report And Customer Relationship Management Dashboard With Revenue Information PDF
This slide illustrates graphical representation of CRM leads data. It includes revenue, open leads, won leads, cold leads, monthly leads report and leads dough nut graph etc. Pitch your topic with ease and precision using this Monthly Leads Report And Customer Relationship Management Dashboard With Revenue Information PDF. This layout presents information on Monthly Leads Report, Customer Relationship Management, Dashboard With Revenue. It is also available for immediate download and adjustment. So, changes can be made in the color, design, graphics or any other component to create a unique layout.
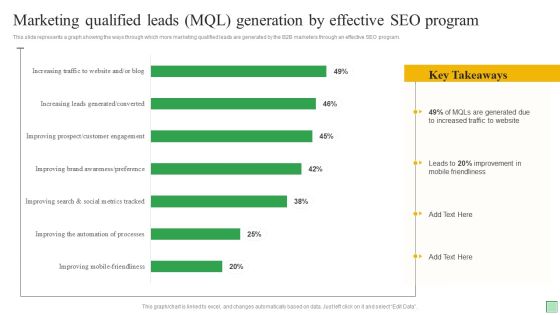
Marketing Qualified Leads MQL Generation By Effective SEO Program Ppt Slides Example Topics PDF
This slide represents a graph showing the ways through which more marketing qualified leads are generated by the B2B marketers through an effective SEO program. Pitch your topic with ease and precision using this Marketing Qualified Leads MQL Generation By Effective SEO Program Ppt Slides Example Topics PDF. This layout presents information on Mobile Friendliness, Due To Increased, Traffic To Website. It is also available for immediate download and adjustment. So, changes can be made in the color, design, graphics or any other component to create a unique layout.

Virtual Customer Healthcare Trends Among Different Generations Professional PDF
The below slide depicts the consumer trends in healthcare industry. The graph includes the data for the past two years comparing the percentage of change in the virtual visits among different generations. Pitch your topic with ease and precision using this Virtual Customer Healthcare Trends Among Different Generations Professional PDF. This layout presents information on Millennial, Baby Boomers, Seniors. It is also available for immediate download and adjustment. So, changes can be made in the color, design, graphics or any other component to create a unique layout.

Human Resource Metrics With New Hire Turnover Professional PDF
This slide showcases human resource dashboard that can help to track the KPIs that are time to fill, quality of hire, hiring source and new hire turnover. It also illustrates the performance score graph that can help to evaluate the recruitment efficiency of different HR employees. Pitch your topic with ease and precision using this Human Resource Metrics With New Hire Turnover Professional PDF. This layout presents information on Hiring Source, New Hire Turnover, Hr Employees Performance Score. It is also available for immediate download and adjustment. So, changes can be made in the color, design, graphics or any other component to create a unique layout.

Statistical Relationship Between Organic Growth Procedure And Profitability Rules PDF
This slide showcases graph depicting relationship between organic growth process and profit . It includes annual growth , annual profits , frequent , occasional and no researches etc. Pitch your topic with ease and precision using this Statistical Relationship Between Organic Growth Procedure And Profitability Rules PDF. This layout presents information on Key Insights, Frequency, Profitability. It is also available for immediate download and adjustment. So, changes can be made in the color, design, graphics or any other component to create a unique layout.
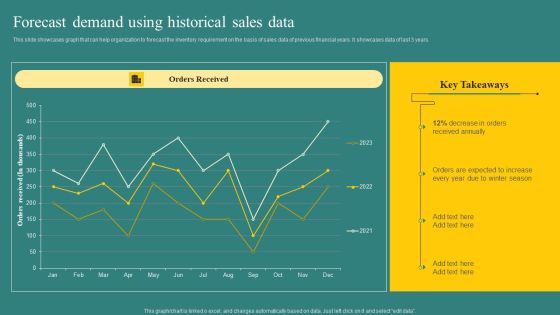
Forecast Demand Using Historical Sales Data Background PDF
This slide showcases graph that can help organization to forecast the inventory requirement on the basis of sales data of previous financial years. It showcases data of last 3 years. Take your projects to the next level with our ultimate collection of Forecast Demand Using Historical Sales Data Background PDF. Slidegeeks has designed a range of layouts that are perfect for representing task or activity duration, keeping track of all your deadlines at a glance. Tailor these designs to your exact needs and give them a truly corporate look with your own brand colors they will make your projects stand out from the rest.

Adopting Multiple Tactics To Improve Inventory Optimization Evaluating Increase In Warehouse Indirect And Direct Cost Background PDF
This slide showcases graph that can help organization in analyzing the rise of warehouse costs. It also shows reasons for increase in warheouse costs that are rise in inventory wastage and delay in order fulfillment. Make sure to capture your audiences attention in your business displays with our gratis customizable Adopting Multiple Tactics To Improve Inventory Optimization Evaluating Increase In Warehouse Indirect And Direct Cost Background PDF. These are great for business strategies, office conferences, capital raising or task suggestions. If you desire to acquire more customers for your tech business and ensure they stay satisfied, create your own sales presentation with these plain slides.

Procurement Strategies For Reducing Stock Wastage Forecast Demand Using Historical Sales Data Designs PDF
This slide showcases graph that can help organization to forecast the inventory requirement on the basis of sales data of previous financial years. It showcases data of last 3 years. Take your projects to the next level with our ultimate collection of Procurement Strategies For Reducing Stock Wastage Forecast Demand Using Historical Sales Data Designs PDF. Slidegeeks has designed a range of layouts that are perfect for representing task or activity duration, keeping track of all your deadlines at a glance. Tailor these designs to your exact needs and give them a truly corporate look with your own brand colors they will make your projects stand out from the rest.
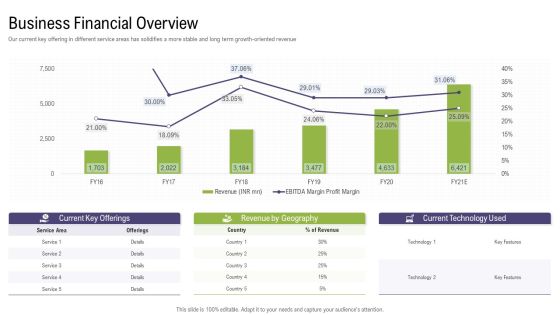
Mergers And Acquisitions Synergy Business Financial Overview Template PDF
Deliver an awe-inspiring pitch with this creative mergers and acquisitions synergy business financial overview template pdf. bundle. Topics like current key offerings, current key offerings, current technology used can be discussed with this completely editable template. It is available for immediate download depending on the needs and requirements of the user.
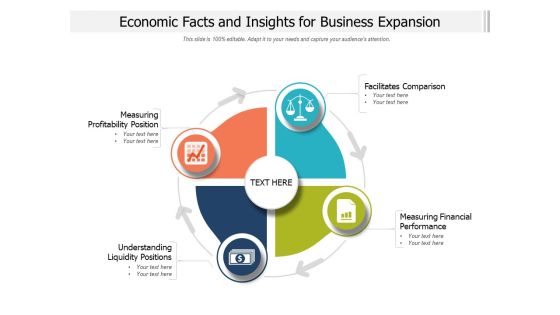
Economic Facts And Insights For Business Expansion Ppt PowerPoint Presentation Infographic Template Slide Portrait PDF
Pitch your topic with ease and precision using this economic facts and insights for business expansion ppt powerpoint presentation infographic template slide portrait pdf. This layout presents information on facilitates comparison, measuring financial performance, understanding liquidity positions, measuring profitability position. It is also available for immediate download and adjustment. So, changes can be made in the color, design, graphics or any other component to create a unique layout.

Deploying Online Marketing Website Promotion Dashboard Highlighting Advertisement Themes PDF
This slide represents website promotion dashboard. It covers total visits, average session duration, bounce rate, page views etc. Find a pre-designed and impeccable Deploying Online Marketing Website Promotion Dashboard Highlighting Advertisement Themes PDF. The templates can ace your presentation without additional effort. You can download these easy-to-edit presentation templates to make your presentation stand out from others. So, what are you waiting for Download the template from Slidegeeks today and give a unique touch to your presentation.

Deploying AML Transaction Monitoring Analyzing Impact On Key Operations And Workflows Demonstration PDF
This slide showcases assessing impact on major operations and workflows. It provides information about customer understanding, knowledge, data management, financial risk management, customer relationship management, client onboarding, etc. Slidegeeks is one of the best resources for PowerPoint templates. You can download easily and regulate Deploying AML Transaction Monitoring Analyzing Impact On Key Operations And Workflows Demonstration PDF for your personal presentations from our wonderful collection. A few clicks is all it takes to discover and get the most relevant and appropriate templates. Use our Templates to add a unique zing and appeal to your presentation and meetings. All the slides are easy to edit and you can use them even for advertisement purposes.

Recommendation Techniques Introduction To Recommender System Used By Amazon Demonstration PDF
This slide talks about the ways in which Amazon uses artificial intelligence to provide personalized recommendations. These ways include Amazon Alexa, Amazon GO, etc. The purpose of this slide is to illustrate how recommendation engine has elevated the sales of Amazon. Find a pre-designed and impeccable Recommendation Techniques Introduction To Recommender System Used By Amazon Demonstration PDF. The templates can ace your presentation without additional effort. You can download these easy-to-edit presentation templates to make your presentation stand out from others. So, what are you waiting for Download the template from Slidegeeks today and give a unique touch to your presentation.

Balance Sheet And Cash Flow Marketing Research Services Management Business Designs Pdf
The slide showcases the balance sheet and cash flow statement of last six years to represent the current financial position of the organization. Boost your pitch with our creative Balance Sheet And Cash Flow Marketing Research Services Management Business Designs Pdf. Deliver an awe-inspiring pitch that will mesmerize everyone. Using these presentation templates you will surely catch everyones attention. You can browse the ppts collection on our website. We have researchers who are experts at creating the right content for the templates. So you do not have to invest time in any additional work. Just grab the template now and use them.
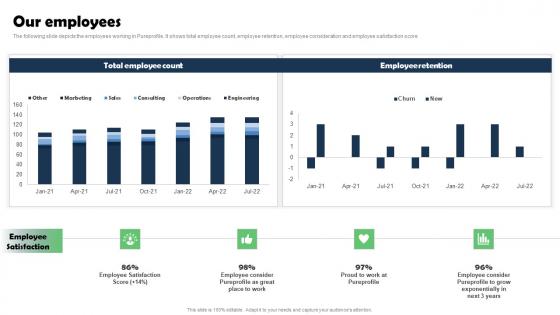
Our Employees Marketing Research Services Management Business Themes Pdf
The following slide depicts the employees working in Pureprofile. It shows total employee count, employee retention, employee consideration and employee satisfaction score. Slidegeeks has constructed Our Employees Marketing Research Services Management Business Themes Pdf after conducting extensive research and examination. These presentation templates are constantly being generated and modified based on user preferences and critiques from editors. Here, you will find the most attractive templates for a range of purposes while taking into account ratings and remarks from users regarding the content. This is an excellent jumping-off point to explore our content and will give new users an insight into our top-notch PowerPoint Templates.

Customer Journey Touchpoint Kpi Dashboard Slides PDF
This template covers touchpoint dashboard with different customer journey stages. It also includes detailed evaluation of each stage on the basis of experience, importance, etc. Showcasing this set of slides titled Customer Journey Touchpoint Kpi Dashboard Slides PDF. The topics addressed in these templates are Purchasing, Customer Service, Consumer Journey. All the content presented in this PPT design is completely editable. Download it and make adjustments in color, background, font etc. as per your unique business setting.
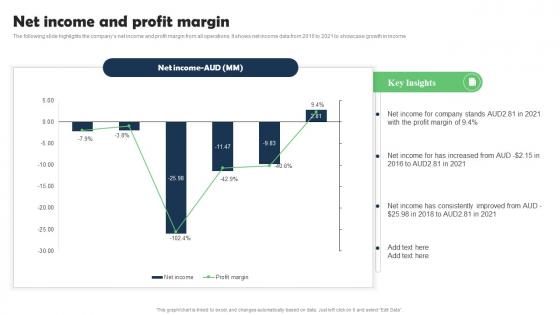
Net Income And Profit Marketing Research Services Management Business Information Pdf
The following slide highlights the companys net income and profit margin from all operations. It shows net income data from 2016 to 2021 to showcase growth in income. Explore a selection of the finest Net Income And Profit Marketing Research Services Management Business Information Pdf here. With a plethora of professionally designed and pre-made slide templates, you can quickly and easily find the right one for your upcoming presentation. You can use our Net Income And Profit Marketing Research Services Management Business Information Pdf to effectively convey your message to a wider audience. Slidegeeks has done a lot of research before preparing these presentation templates. The content can be personalized and the slides are highly editable. Grab templates today from Slidegeeks.

Data And Analytics Playbook How To Bridge Business Intelligence And Predictive Graphics PDF
This template depicts that with interactive BI visualization and predictive modeling in the same enterprise analytics platform, organizations can easily collaborate on initiatives that make recommended actions accessible to the business. Deliver and pitch your topic in the best possible manner with this Data And Analytics Playbook How To Bridge Business Intelligence And Predictive Graphics PDF. Use them to share invaluable insights on Probability By Package, Customer Information, Internet Data and impress your audience. This template can be altered and modified as per your expectations. So, grab it now.

Deploying Aml Transaction Monitoring Clustered Column Slides PDF
Do you have to make sure that everyone on your team knows about any specific topic I yes, then you should give Deploying Aml Transaction Monitoring Clustered Column Slides PDF a try. Our experts have put a lot of knowledge and effort into creating this impeccable Deploying Aml Transaction Monitoring Clustered Column Slides PDF. You can use this template for your upcoming presentations, as the slides are perfect to represent even the tiniest detail. You can download these templates from the Slidegeeks website and these are easy to edit. So grab these today.

Operating Expense Marketing Research Services Management Business Formats Pdf
The following slide highlights the companys net income and profit margin from all operations. It shows net income data from 2016 to 2021 to showcase growth in income. The best PPT templates are a great way to save time, energy, and resources. Slidegeeks have 100 percent editable powerpoint slides making them incredibly versatile. With these quality presentation templates, you can create a captivating and memorable presentation by combining visually appealing slides and effectively communicating your message. Download Operating Expense Marketing Research Services Management Business Formats Pdf from Slidegeeks and deliver a wonderful presentation.
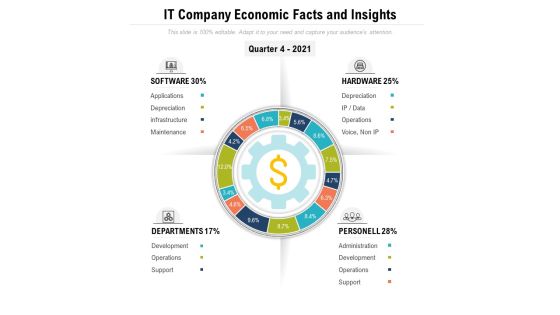
IT Company Economic Facts And Insights Ppt PowerPoint Presentation Professional Objects PDF
Showcasing this set of slides titled it company economic facts and insights ppt powerpoint presentation professional objects pdf. The topics addressed in these templates are quarter 4 2021, applications, depreciation, infrastructure, maintenance, operations. All the content presented in this PPT design is completely editable. Download it and make adjustments in color, background, font etc. as per your unique business setting.

Mergers And Acquisitions Synergy Dashboard Guidelines PDF
Deliver and pitch your topic in the best possible manner with this mergers and acquisitions synergy dashboard guidelines pdf. Use them to share invaluable insights on dashboard and impress your audience. This template can be altered and modified as per your expectations. So, grab it now.
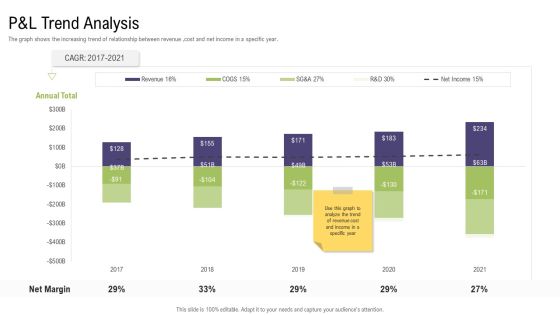
Mergers And Acquisitions Synergy Pandl Trend Analysis Portrait PDF
Deliver an awe-inspiring pitch with this creative mergers and acquisitions synergy pandl trend analysis portrait pdf. bundle. Topics like p and l trend analysis can be discussed with this completely editable template. It is available for immediate download depending on the needs and requirements of the user.
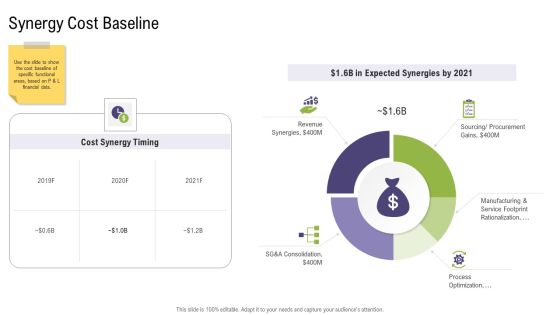
Mergers And Acquisitions Synergy Synergy Cost Baseline Introduction PDF
Deliver and pitch your topic in the best possible manner with this mergers and acquisitions synergy synergy cost baseline introduction pdf. Use them to share invaluable insights on cost synergy timing, synergy cost baseline and impress your audience. This template can be altered and modified as per your expectations. So, grab it now.

Smartphone Sales Dashboard Graphics PDF
This slide shows the dashboard related to smartphone market overview, revenue and sales of the company with top smartphones with their details.Deliver an awe inspiring pitch with this creative smartphone sales dashboard graphics pdf bundle. Topics like smartphone sales dashboard can be discussed with this completely editable template. It is available for immediate download depending on the needs and requirements of the user.
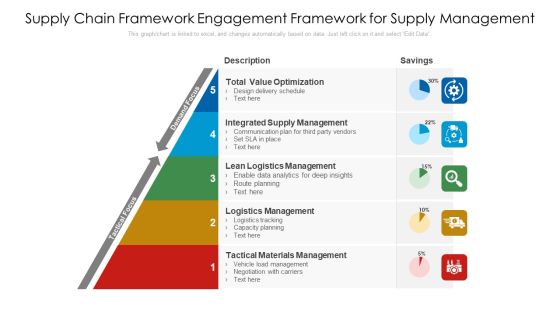
Supply Chain Framework Engagement Framework For Supply Management Ppt PowerPoint Presentation File Styles PDF
Showcasing this set of slides titled supply chain framework engagement framework for supply management ppt powerpoint presentation file styles pdf. The topics addressed in these templates are value, optimization, supply, management, logistics. All the content presented in this PPT design is completely editable. Download it and make adjustments in color, background, font etc. as per your unique business setting.

Spend Category Analysis And Management Dashboard Ppt PowerPoint Presentation Diagram PDF
The following slide showcases a dashboard to monitor and evaluate spending in procurement process. It includes key elements such as spend, suppliers, transactions, PO count, PR count, invoice count, spend by category, spend trend, 80 or 20 analysis, spend by region, spend by supplier and spend by contract. Do you have to make sure that everyone on your team knows about any specific topic I yes, then you should give Spend Category Analysis And Management Dashboard Ppt PowerPoint Presentation Diagram PDF a try. Our experts have put a lot of knowledge and effort into creating this impeccable Spend Category Analysis And Management Dashboard Ppt PowerPoint Presentation Diagram PDF. You can use this template for your upcoming presentations, as the slides are perfect to represent even the tiniest detail. You can download these templates from the Slidegeeks website and these are easy to edit. So grab these today.

Deploying AML Transaction Monitoring Dashboard To Monitor Bank Transactions And Activities Graphics PDF
This slide showcases dashboard to review bank transactions and activities. It provides information about credit, check, ATM, debit card, transaction volume, decline rate, visa, maestro, network end points, etc. Whether you have daily or monthly meetings, a brilliant presentation is necessary. Deploying AML Transaction Monitoring Dashboard To Monitor Bank Transactions And Activities Graphics PDF can be your best option for delivering a presentation. Represent everything in detail using Deploying AML Transaction Monitoring Dashboard To Monitor Bank Transactions And Activities Graphics PDF and make yourself stand out in meetings. The template is versatile and follows a structure that will cater to your requirements. All the templates prepared by Slidegeeks are easy to download and edit. Our research experts have taken care of the corporate themes as well. So, give it a try and see the results.

Economic Facts And Insights Analysis Dashboard Ppt PowerPoint Presentation Inspiration Slide Download PDF
Showcasing this set of slides titled economic facts and insights analysis dashboard ppt powerpoint presentation inspiration slide download pdf. The topics addressed in these templates are current working capital, cash conversion cycle in days last, current quick stats, vendor payment error rate last, 12 months currnet budget variance. All the content presented in this PPT design is completely editable. Download it and make adjustments in color, background, font etc. as per your unique business setting.
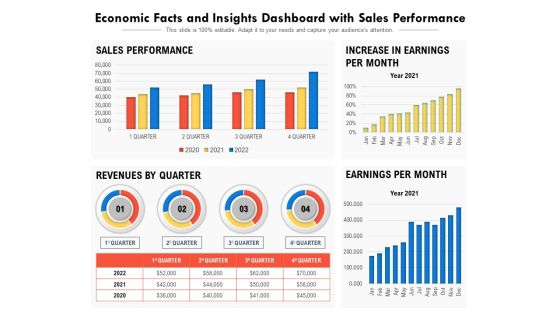
Economic Facts And Insights Dashboard With Sales Performance Ppt PowerPoint Presentation Show Gallery PDF
Showcasing this set of slides titled economic facts and insights dashboard with sales performance ppt powerpoint presentation show gallery pdf. The topics addressed in these templates are sales performance, increase in earnings per month, revenues by quarter, earnings per month. All the content presented in this PPT design is completely editable. Download it and make adjustments in color, background, font etc. as per your unique business setting.
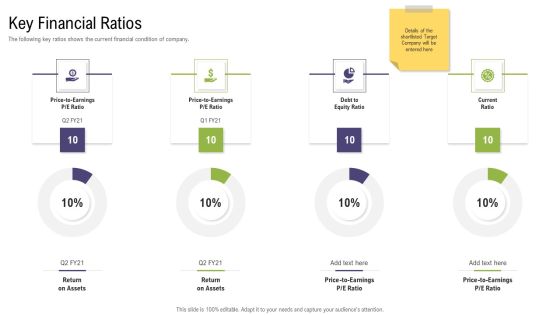
Mergers And Acquisitions Synergy Key Financial Ratios Designs PDF
Deliver and pitch your topic in the best possible manner with this mergers and acquisitions synergy key financial ratios designs pdf. Use them to share invaluable insights on Price to earnings p or e ratio debt to, equity ratio, current ratio, return on assets, return on assets and impress your audience. This template can be altered and modified as per your expectations. So, grab it now.
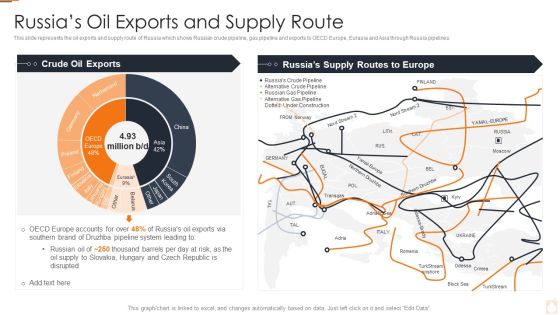
Ukraine Russia Conflict Effect On Petroleum Industry Russias Oil Exports And Supply Route Designs PDF
This slide represents the oil exports and supply route of Russia which shows Russian crude pipeline, gas pipeline and exports to OECD Europe, Eurasia and Asia through Russia pipelines.Deliver an awe inspiring pitch with this creative Ukraine Russia Conflict Effect On Petroleum Industry Russias Oil Exports And Supply Route Designs PDF bundle. Topics like Russias Oil Exports And Supply Route can be discussed with this completely editable template. It is available for immediate download depending on the needs and requirements of the user.
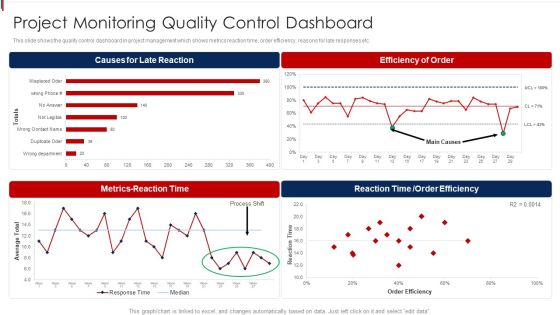
Project Monitoring Quality Control Dashboard Clipart PDF
This slide shows the quality control dashboard in project management which shows metrics reaction time, order efficiency, reasons for late responses etc Showcasing this set of slides titled Project Monitoring Quality Control Dashboard Clipart PDF. The topics addressed in these templates are Causes Late Reaction, Metrics Reaction Time, Efficiency Of Order. All the content presented in this PPT design is completely editable. Download it and make adjustments in color, background, font etc. as per your unique business setting.
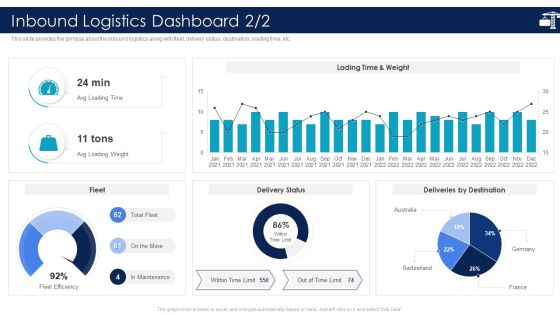
Inbound Logistics And Supply Chain Introduction Inbound Logistics Dashboard Diagrams PDF
This slide provides the glimpse about the inbound logistics along with fleet, delivery status, destination, loading time, etc.Deliver and pitch your topic in the best possible manner with this Inbound Logistics And Supply Chain Introduction Inbound Logistics Dashboard Diagrams PDF Use them to share invaluable insights on Delivery Status, Deliveries By Destination, Lading Time And Weight and impress your audience. This template can be altered and modified as per your expectations. So, grab it now.
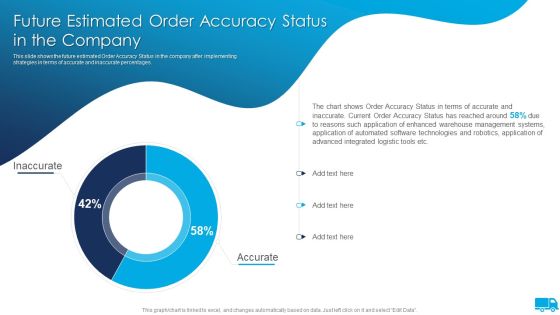
Strategies For Integrated Logistics Management Enhancing Order Efficiency Future Estimated Order Accuracy Demonstration PDF
This slide shows the future estimated Order Accuracy Status in the company after implementing strategies in terms of accurate and inaccurate percentages.Deliver and pitch your topic in the best possible manner with this Strategies For Integrated Logistics Management Enhancing Order Efficiency Future Estimated Order Accuracy Demonstration PDF Use them to share invaluable insights on Inaccurate Current, Automated Software, Management Systems and impress your audience. This template can be altered and modified as per your expectations. So, grab it now.

How To Implement Cloud Collaboration Dashboard For Monitoring Project Team Workload Portrait PDF
The following slide depicts dashboard for observing project resource utilization. It provides information about billable utilization, company target, project hours, over hours, project allocations, etc. Deliver and pitch your topic in the best possible manner with this How To Implement Cloud Collaboration Dashboard For Monitoring Project Team Workload Portrait PDF. Use them to share invaluable insights on Actual Utilization, Resource Utilization, Planned Utilization and impress your audience. This template can be altered and modified as per your expectations. So, grab it now.

Zoo Financials Total Revenue And Total Profits Ppt Pictures Outline PDF
This slide shows the total revenue and total profits of the ABC Zoo from the years 2016 to 2020. This shows a decrease in the financials due to various reasons such as decrease in number of visitors, etc. Deliver an awe-inspiring pitch with this creative zoo financials total revenue and total profits ppt pictures outline pdf. bundle. Topics like total revenue, total profit can be discussed with this completely editable template. It is available for immediate download depending on the needs and requirements of the user.

Industry Overview And Market Trends Formats PDF
The slide provides the industry overview and key facts market trends of the industry. Additionally, it provides market size for the year 2016 to 2025 and market share 2021 of the industry Deliver an awe inspiring pitch with this creative industry overview and market trends formats pdf bundle. Topics like revenues of major segments 2021, market size and share 2015 to 2024, market size 2021 can be discussed with this completely editable template. It is available for immediate download depending on the needs and requirements of the user.
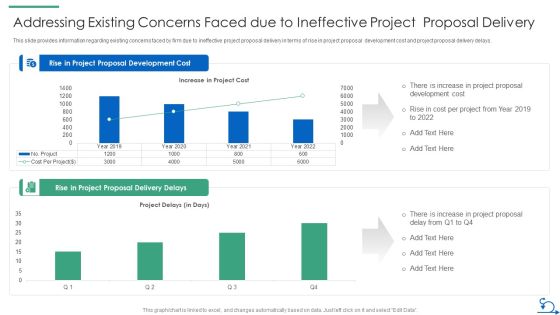
How Bidding Teams Addressing Existing Concerns Faced Due To Ineffective Project Mockup PDF
This slide provides information regarding existing concerns faced by firm due to ineffective project proposal delivery in terms of rise in project proposal development cost and project proposal delivery delays. Deliver an awe inspiring pitch with this creative how bidding teams addressing existing concerns faced due to ineffective project mockup pdf bundle. Topics like rise project proposal, development cost, cost per project can be discussed with this completely editable template. It is available for immediate download depending on the needs and requirements of the user.

Deliver Efficiency Innovation Action Plan For Cross Functional Product Teams Introduction PDF
This slide shows action plan for cross-functional product teams which includes goal, number of completed tasks and percentage of completed goals, action, responsible person, required resources, status, etc. Deliver and pitch your topic in the best possible manner with this Deliver Efficiency Innovation Action Plan For Cross Functional Product Teams Introduction PDF. Use them to share invaluable insights on Updating Blog Posts, Create Weekly Newsletter, Inbound, Outbound Sales Calls, Adjust Customer Feedback Survey and impress your audience. This template can be altered and modified as per your expectations. So, grab it now.
KPI Dashboard For Organizational Debt Management Ppt Professional Icons PDF
This slide shows the KPI dashboard for debt management which can be used by an organization to track debt performance. It includes KPIs such as current bank balance, amount due, creditors, etc. Showcasing this set of slides titled KPI Dashboard For Organizational Debt Management Ppt Professional Icons PDF. The topics addressed in these templates are Total Amount Due, Current Bank Balance, Invoiced vs Paid. All the content presented in this PPT design is completely editable. Download it and make adjustments in color, background, font etc. as per your unique business setting.

Treasury Management Scorecard To Control Potential Risks Structure PDF
This slide showcases scorecard to measure companys treasury performance with industry peer groups to help company devise appropriate risk mitigation strategies. It includes details such as cash and liquidity, payments, bank relationship, etc. Showcasing this set of slides titled Treasury Management Scorecard To Control Potential Risks Structure PDF. The topics addressed in these templates are Maturity Level, Performance, Strategic, Standardizing. All the content presented in this PPT design is completely editable. Download it and make adjustments in color, background, font etc. as per your unique business setting.
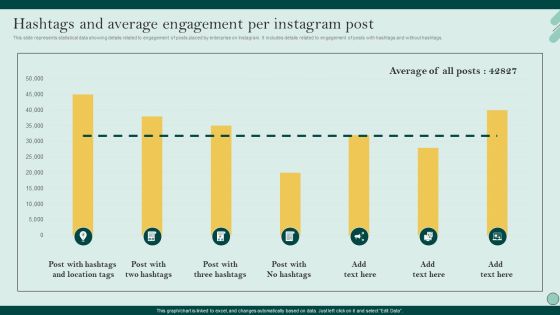
Social Networks Marketing To Improve Hashtags And Average Engagement Per Graphics PDF
This slide represents statistical data showing details related to engagement of posts placed by enterprise on Instagram. It includes details related to engagement of posts with hashtags and without hashtags. The Social Networks Marketing To Improve Hashtags And Average Engagement Per Graphics PDF is a compilation of the most recent design trends as a series of slides. It is suitable for any subject or industry presentation, containing attractive visuals and photo spots for businesses to clearly express their messages. This template contains a variety of slides for the user to input data, such as structures to contrast two elements, bullet points, and slides for written information. Slidegeeks is prepared to create an impression.

Overview Of Key Insights Based On Employees Mental Health At Workplace Ideas PDF
This slide covers key outcomes of survey on mental health at workplace. It also includes result on employees mental health, target pressures, gender based health issues, etc. Showcasing this set of slides titled Overview Of Key Insights Based On Employees Mental Health At Workplace Ideas PDF. The topics addressed in these templates are Overview Key Insights Based, Employees Mental Health Workplace. All the content presented in this PPT design is completely editable. Download it and make adjustments in color, background, font etc. as per your unique business setting.
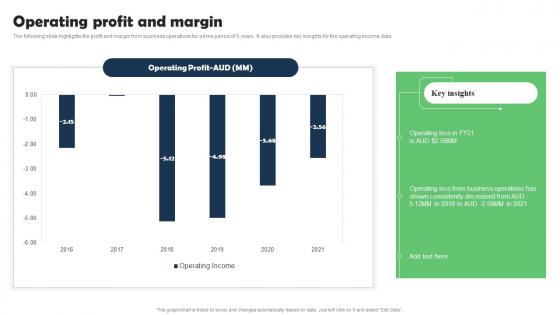
Operating Profit And Margin Marketing Research Services Management Business Pictures Pdf
The following slide highlights the profit and margin from business operations for a time period of 6 years. It also provides key insights for the operating income data. The Operating Profit And Margin Marketing Research Services Management Business Pictures Pdf is a compilation of the most recent design trends as a series of slides. It is suitable for any subject or industry presentation, containing attractive visuals and photo spots for businesses to clearly express their messages. This template contains a variety of slides for the user to input data, such as structures to contrast two elements, bullet points, and slides for written information. Slidegeeks is prepared to create an impression.

Website Visitors Data Marketing Research Services Management Business Download Pdf
The following slide highlights the companys audience demographics distribution based on people age and gender to make business strategy for target market. Want to ace your presentation in front of a live audience Our Website Visitors Data Marketing Research Services Management Business Download Pdf can help you do that by engaging all the users towards you. Slidegeeks experts have put their efforts and expertise into creating these impeccable powerpoint presentations so that you can communicate your ideas clearly. Moreover, all the templates are customizable, and easy-to-edit and downloadable. Use these for both personal and commercial use.
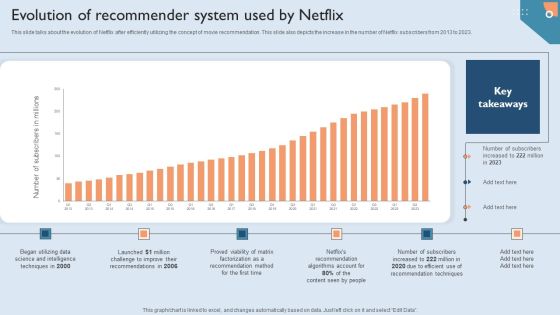
Recommendation Techniques Evolution Of Recommender System Used By Netflix Designs PDF
This slide talks about the evolution of Netflix after efficiently utilizing the concept of movie recommendation. This slide also depicts the increase in the number of Netflix subscribers from 2013 to 2023. Are you searching for a Recommendation Techniques Evolution Of Recommender System Used By Netflix Designs PDF that is uncluttered, straightforward, and original Its easy to edit, and you can change the colors to suit your personal or business branding. For a presentation that expresses how much effort you have put in, this template is ideal With all of its features, including tables, diagrams, statistics, and lists, its perfect for a business plan presentation. Make your ideas more appealing with these professional slides. Download Recommendation Techniques Evolution Of Recommender System Used By Netflix Designs PDF from Slidegeeks today.

Historical Revenue Marketing Research Services Management Business Slides Pdf
The following slide highlights the historical revenue of Pureprofile from all of its operations. It also describes revenue CAGR and revenue growth over a time period of 6 years. Formulating a presentation can take up a lot of effort and time, so the content and message should always be the primary focus. The visuals of the PowerPoint can enhance the presenters message, so our Historical Revenue Marketing Research Services Management Business Slides Pdf was created to help save time. Instead of worrying about the design, the presenter can concentrate on the message while our designers work on creating the ideal templates for whatever situation is needed. Slidegeeks has experts for everything from amazing designs to valuable content, we have put everything into Historical Revenue Marketing Research Services Management Business Slides Pdf

3D Pie Chart Icon Ppt PowerPoint Presentation Outline Inspiration
Presenting this set of slides with name 3d pie chart icon ppt powerpoint presentation outline inspiration. The topics discussed in these slides are pie chart, finance, donut chart. This is a completely editable PowerPoint presentation and is available for immediate download. Download now and impress your audience.

3D Pie Chart Vector Icon Ppt PowerPoint Presentation Gallery Portfolio
Presenting this set of slides with name 3d pie chart vector icon ppt powerpoint presentation gallery portfolio. The topics discussed in these slides are pie chart, finance, donut chart. This is a completely editable PowerPoint presentation and is available for immediate download. Download now and impress your audience.
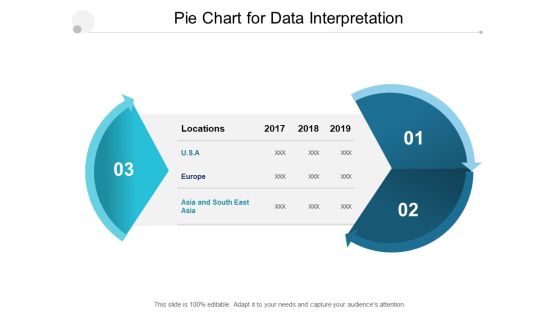
Pie Chart For Data Interpretation Ppt PowerPoint Presentation Portfolio Guide
Presenting this set of slides with name pie chart for data interpretation ppt powerpoint presentation portfolio guide. The topics discussed in these slides are pie chart, finance, donut chart. This is a completely editable PowerPoint presentation and is available for immediate download. Download now and impress your audience.
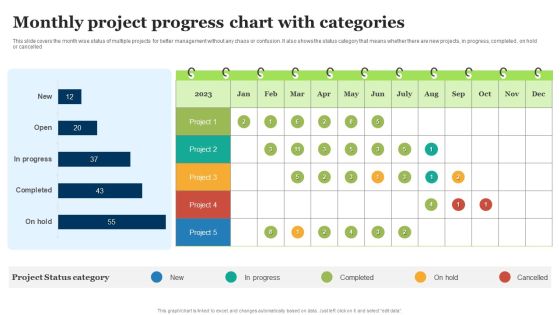
Monthly Project Progress Chart With Categories Ppt Professional Outfit PDF
This slide covers the month wise status of multiple projects for better management without any chaos or confusion. It also shows the status category that means whether there are new projects, in progress, completed , on hold or cancelled. Pitch your topic with ease and precision using this Monthly Project Progress Chart With Categories Ppt Professional Outfit PDF. This layout presents information on Project Status Category, Completed, Progress. It is also available for immediate download and adjustment. So, changes can be made in the color, design, graphics or any other component to create a unique layout.

Pie Chart For Financial Planning And Distribution Ppt PowerPoint Presentation File Deck
Presenting this set of slides with name pie chart for financial planning and distribution ppt powerpoint presentation file deck. The topics discussed in these slides are pie chart, finance, donut chart. This is a completely editable PowerPoint presentation and is available for immediate download. Download now and impress your audience.

Pie Chart Shapes Making Full Circle Ppt PowerPoint Presentation Ideas Example Introduction
Presenting this set of slides with name pie chart shapes making full circle ppt powerpoint presentation ideas example introduction. The topics discussed in these slides are pie chart, finance, donut chart. This is a completely editable PowerPoint presentation and is available for immediate download. Download now and impress your audience.
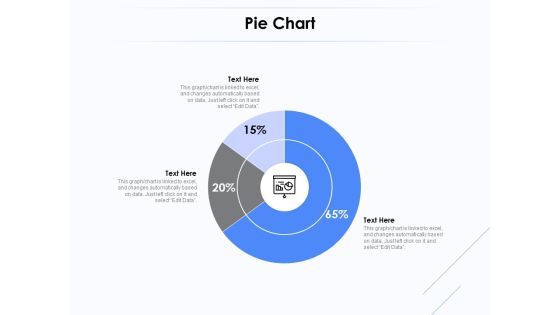
Network Monitoring Tool Overview Pie Chart Ppt PowerPoint Presentation Inspiration Graphic Tips PDF
Presenting this set of slides with name network monitoring tool overview pie chart ppt powerpoint presentation inspiration graphic tips pdf. The topics discussed in these slide is pie chart. This is a completely editable PowerPoint presentation and is available for immediate download. Download now and impress your audience.

Circular Chart Showing Sales Growth Ppt PowerPoint Presentation File Images PDF
Presenting this set of slides with name circular chart showing sales growth ppt powerpoint presentation file images pdf. The topics discussed in these slides are circular chart showing sales growth, 2019 to 2020. This is a completely editable PowerPoint presentation and is available for immediate download. Download now and impress your audience.
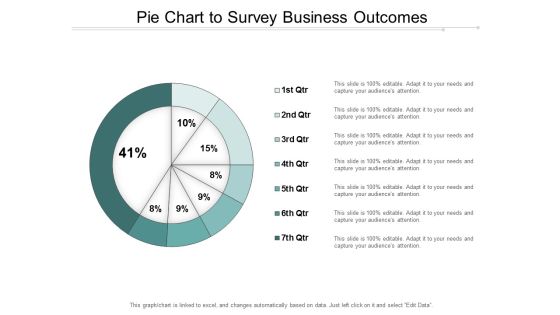
Pie Chart To Survey Business Outcomes Ppt PowerPoint Presentation File Slide Portrait
Presenting this set of slides with name pie chart to survey business outcomes ppt powerpoint presentation file slide portrait. The topics discussed in these slides are business outcomes, business results, business output. This is a completely editable PowerPoint presentation and is available for immediate download. Download now and impress your audience.

Circular Diagram For Advertising And Marketing Channels Ppt PowerPoint Presentation Professional Gridlines
Presenting this set of slides with name circular diagram for advertising and marketing channels ppt powerpoint presentation professional gridlines. The topics discussed in these slides are pie chart, finance, donut chart. This is a completely editable PowerPoint presentation and is available for immediate download. Download now and impress your audience.
Swot Analysis Layout With Icons Ppt PowerPoint Presentation Ideas Objects
Presenting this set of slides with name swot analysis layout with icons ppt powerpoint presentation ideas objects. The topics discussed in these slides are pie chart, finance, donut chart. This is a completely editable PowerPoint presentation and is available for immediate download. Download now and impress your audience.
Three Tags With Icons For Yearly Planning Ppt PowerPoint Presentation Slides Design Inspiration
Presenting this set of slides with name three tags with icons for yearly planning ppt powerpoint presentation slides design inspiration. The topics discussed in these slides are pie chart, finance, donut chart. This is a completely editable PowerPoint presentation and is available for immediate download. Download now and impress your audience.
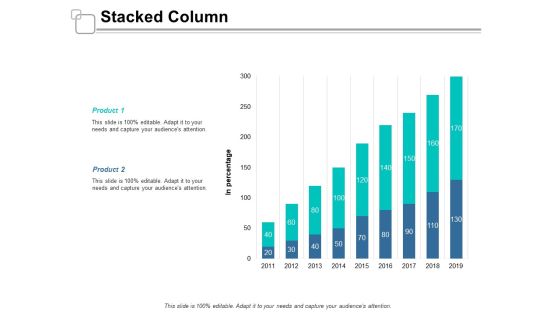
Stacked Column Ppt Powerpoint Presentation Infographics Portfolio
This is a stacked column ppt powerpoint presentation infographics portfolio. The topics discussed in this diagram are marketing, management, business, strategy, finance. This is a completely editable PowerPoint presentation, and is available for immediate download..

Risk And Return Of Portfolio Managers Graphical Form Analysis Ppt PowerPoint Presentation Gallery Objects
Presenting this set of slides with name risk and return of portfolio managers graphical form analysis ppt powerpoint presentation gallery objects. The topics discussed in these slides are finance, marketing, management, investment, analysis. This is a completely editable PowerPoint presentation and is available for immediate download. Download now and impress your audience.
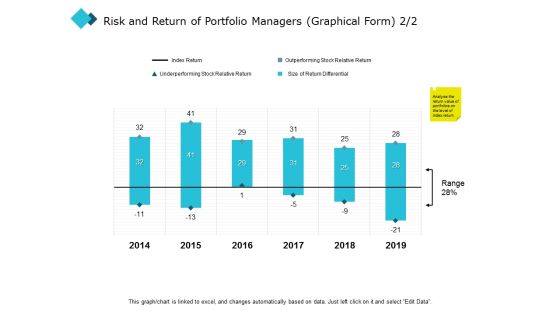
Risk And Return Of Portfolio Managers Graphical Form Investment Ppt PowerPoint Presentation Model Example Topics
Presenting this set of slides with name risk and return of portfolio managers graphical form investment ppt powerpoint presentation model example topics. The topics discussed in these slides are finance, marketing, management, investment, analysis. This is a completely editable PowerPoint presentation and is available for immediate download. Download now and impress your audience.
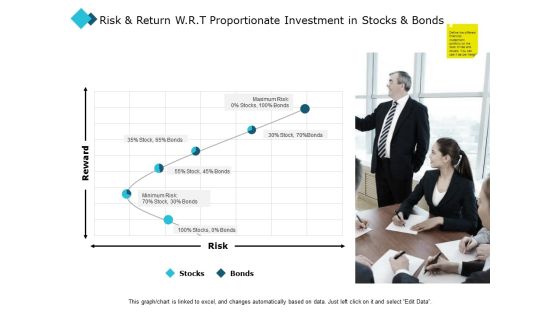
Risk And Return W R T Proportionate Investment In Stocks And Bonds Ppt PowerPoint Presentation Professional Graphics Design
Presenting this set of slides with name risk and return w r t proportionate investment in stocks and bonds ppt powerpoint presentation professional graphics design. The topics discussed in these slides are finance, marketing, management, investment, analysis. This is a completely editable PowerPoint presentation and is available for immediate download. Download now and impress your audience.

Measurable Business Outcomes Increase In Clients And Revenue Ppt PowerPoint Presentation Layouts Format Ideas
Presenting this set of slides with name measurable business outcomes increase in clients and revenue ppt powerpoint presentation layouts format ideas. The topics discussed in these slides are business outcomes, business results, business output. This is a completely editable PowerPoint presentation and is available for immediate download. Download now and impress your audience.

Use Of Funds Ppt PowerPoint Presentation Inspiration Graphics Example
Presenting this set of slides with name use of funds ppt powerpoint presentation inspiration graphics example. The topics discussed in these slides are water purchases and treatment, debt service, cip. This is a completely editable PowerPoint presentation and is available for immediate download. Download now and impress your audience.

Economic Facts And Insights Dashboard For Cash Management Ppt PowerPoint Presentation Outline Guide PDF
Pitch your topic with ease and precision using this economic facts and insights dashboard for cash management ppt powerpoint presentation outline guide pdf. This layout presents information on days sales outstanding, days inventory outstanding, days payable outstanding, accounts payable by payment target, inventory, ar turnover vs ap turnover. It is also available for immediate download and adjustment. So, changes can be made in the color, design, graphics or any other component to create a unique layout.

Social Network Training Program Success Summary Ppt Professional Slides PDF
Mentioned slide outlines success summary of social media training program organized at company premises. This slide provides information about training program metrics like employees registered, employees participated, social media activity etc. Pitch your topic with ease and precision using this social network training program success summary ppt professional slides pdf. This layout presents information on learning rate, success rate of training program, social media activity, employees participated. It is also available for immediate download and adjustment. So, changes can be made in the color, design, graphics or any other component to create a unique layout.
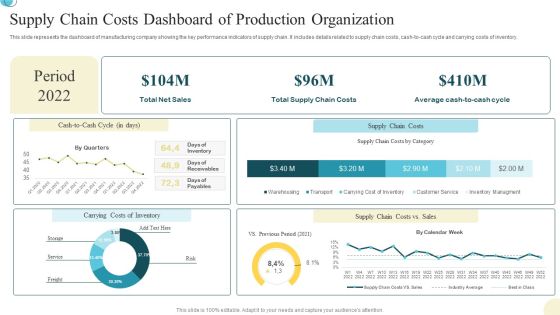
Supply Chain Costs Dashboard Of Production Organization Background PDF
This slide represents the dashboard of manufacturing company showing the key performance indicators of supply chain. It includes details related to supply chain costs, cash to cash cycle and carrying costs of inventory. Pitch your topic with ease and precision using this Supply Chain Costs Dashboard Of Production Organization Background PDF. This layout presents information on Supply Chain Costs, Dashboard Of Production, Organization. It is also available for immediate download and adjustment. So, changes can be made in the color, design, graphics or any other component to create a unique layout.
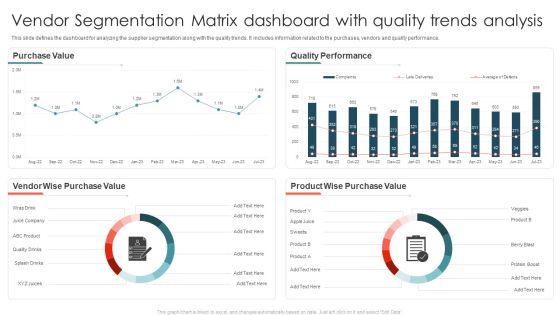
Vendor Segmentation Matrix Dashboard With Quality Trends Analysis Ppt Model Rules PDF
This slide defines the dashboard for analyzing the supplier segmentation along with the quality trends. It includes information related to the purchases, vendors and quality performance. Pitch your topic with ease and precision using this Vendor Segmentation Matrix Dashboard With Quality Trends Analysis Ppt Model Rules PDF. This layout presents information on Purchase Value, Quality Performance, Vendor Wise. It is also available for immediate download and adjustment. So, changes can be made in the color, design, graphics or any other component to create a unique layout.

Deploying AML Transaction Monitoring Dashboard For Monitoring Fraud And Money Rules PDF
This slide showcases dashboard for monitoring fraudulent and money laundering transactions. It provides information about legitimacy, total transaction, unusual transactions, bank, client, investigation, in peer review, etc. Do you have an important presentation coming up Are you looking for something that will make your presentation stand out from the rest Look no further than Deploying AML Transaction Monitoring Dashboard For Monitoring Fraud And Money Rules PDF. With our professional designs, you can trust that your presentation will pop and make delivering it a smooth process. And with Slidegeeks, you can trust that your presentation will be unique and memorable. So why wait Grab Deploying AML Transaction Monitoring Dashboard For Monitoring Fraud And Money Rules PDF today and make your presentation stand out from the rest.

Gross Profit And Margin Marketing Research Services Management Business Background Pdf
The following slide highlights the yearly gross profit from 2016 to 2021. it illustrates the changes in profit and margin along with the reasons for the increase or decrease. Make sure to capture your audiences attention in your business displays with our gratis customizable Gross Profit And Margin Marketing Research Services Management Business Background Pdf. These are great for business strategies, office conferences, capital raising or task suggestions. If you desire to acquire more customers for your tech business and ensure they stay satisfied, create your own sales presentation with these plain slides.
Ppt Symbol Business Men Standing On Financial Colorful Pie Chart PowerPoint Templates
PPT symbol business men standing on financial colorful pie chart PowerPoint Templates-Use this Business based PowerPoint Diagram to represent the Business issues Graphically. It indicates arrange, block out, blueprint, cast, delineate, design, devise, draft, graph , lay out, outline, plot, project, shape, sketch etc.-PPT symbol business men standing on financial colorful pie chart PowerPoint Templates-Adult, Art, Background, Business, Career, Chart, Communication, Concept, Conference, Corporate, Creative, Design, Economy, Executive, Finance, Group, Growth, Idea, Illustration, Leadership, Meeting, New, Occupation, Office, People, Person, Progress, Silhouette, Space, Speaking, Standing, Success

Target Marketing Techniques Evaluating Growth Rate For Target Marketing Slides PDF
This template showcases graph to evaluate growth rate of target market. The purpose of this slide is to identify potential and suitability of target market for launching new product or service. Boost your pitch with our creative Target Marketing Techniques Evaluating Growth Rate For Target Marketing Slides PDF. Deliver an awe inspiring pitch that will mesmerize everyone. Using these presentation templates you will surely catch everyones attention. You can browse the ppts collection on our website. We have researchers who are experts at creating the right content for the templates. So you do not have to invest time in any additional work. Just grab the template now and use them.

Tuckmans Phases Of Team Development Teams Working Towards A Shared Objective Themes PDF
This slide covers the tuckmans phases of team development graph along with characteristics and strategies of the stages such as forming, storming, norming, performing, and adjourning.This is a Tuckmans Phases Of Team Development Teams Working Towards A Shared Objective Themes PDF template with various stages. Focus and dispense information on four stages using this creative set, that comes with editable features. It contains large content boxes to add your information on topics like Providing Expectations, Consistent Instructions, Recognizing Individual. You can also showcase facts, figures, and other relevant content using this PPT layout. Grab it now.
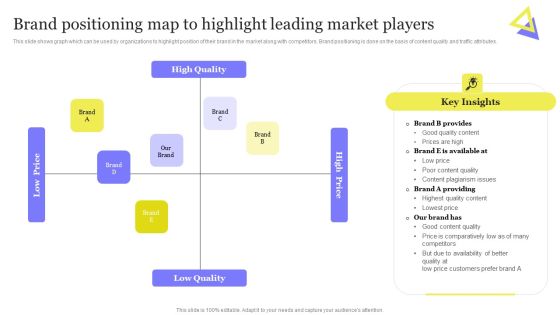
Enhancing Digital Visibility Using SEO Content Strategy Brand Positioning Map Highlight Leading Market Topics PDF
This slide shows graph which can be used by organizations to highlight position of their brand in the market along with competitors. Brand positioning is done on the basis of content quality and traffic attributes. There are so many reasons you need a Enhancing Digital Visibility Using SEO Content Strategy Brand Positioning Map Highlight Leading Market Topics PDF. The first reason is you cannot spend time making everything from scratch, Thus, Slidegeeks has made presentation templates for you too. You can easily download these templates from our website easily.
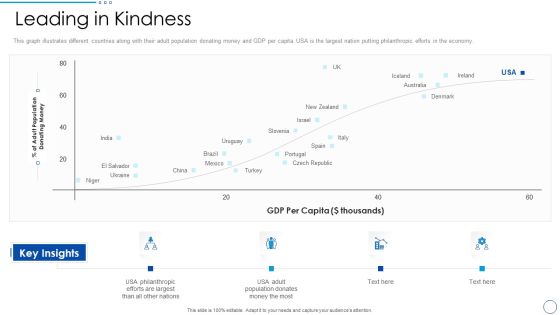
Social Ethics Pitch Deck Leading In Kindness Ppt PowerPoint Presentation Gallery Slide PDF
This graph illustrates different countries along with their adult population donating money and GDP per capita. USA is the largest nation putting philanthropic efforts in the economy. Presenting social ethics pitch deck leading in kindness ppt powerpoint presentation gallery slide pdf to provide visual cues and insights. Share and navigate important information on four stages that need your due attention. This template can be used to pitch topics like leading in kindness. In addtion, this PPT design contains high resolution images, graphics, etc, that are easily editable and available for immediate download.
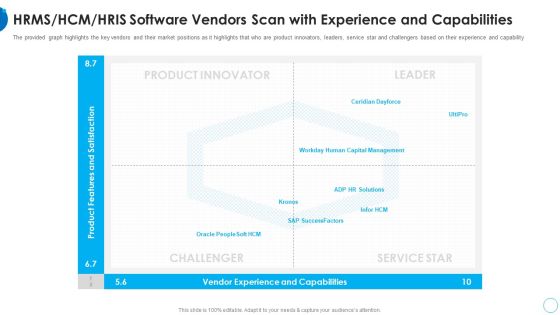
RMS HCM HRIS Software Vendors Scan With Experience HR Change Management Tools Structure PDF
The provided graph highlights the key vendors and their market positions as it highlights that who are product innovators, leaders, service star and challengers based on their experience and capability This is a rms hcm hris software vendors scan with experience hr change management tools structure pdf template with various stages. Focus and dispense information on four stages using this creative set, that comes with editable features. It contains large content boxes to add your information on topics like hrms or hcm or hris software vendors scan with experience and capabilities. You can also showcase facts, figures, and other relevant content using this PPT layout. Grab it now.

Real Estate Developers Funding Alternatives Determining Risk Level Across Real Estate Development Process Sample PDF
This slide portrays a graph that company will use to determine risk level and cumulative investment across real estate development process. Development process includes stages namely land optioning, construction, lease up and operation. Presenting Real Estate Developers Funding Alternatives Determining Risk Level Across Real Estate Development Process Sample PDF to provide visual cues and insights. Share and navigate important information on two stages that need your due attention. This template can be used to pitch topics like Cumulative Investment, Land Purchase, Development Completion. In addtion, this PPT design contains high resolution images, graphics, etc, that are easily editable and available for immediate download.

Estimated Future Trends In Revenue Of XYZ Logistic Company Worldwide Microsoft PDF
This slide shows the estimated future trends in revenue of XYZ Logistic Company after the implementation of Strategies. The graph shows an increase in share of XYZ Logistic Company in the coming future. Deliver and pitch your topic in the best possible manner with this estimated future trends in revenue of xyz logistic company worldwide microsoft pdf. Use them to share invaluable insights on estimated future trends in revenue of xyz logistic company worldwide and impress your audience. This template can be altered and modified as per your expectations. So, grab it now.

Enterprise Quarterly Income And Expenditure Performance Chart Graphics PDF
This slide depicts total income and expenses incurred annually. It represents the value of the income to expenses for each pair of bars, by quarter and variance is the profit earned. Pitch your topic with ease and precision using this Enterprise Quarterly Income And Expenditure Performance Chart Graphics PDF. This layout presents information on Expenses Surpassed Income, Sales, Huge Profit. It is also available for immediate download and adjustment. So, changes can be made in the color, design, graphics or any other component to create a unique layout.
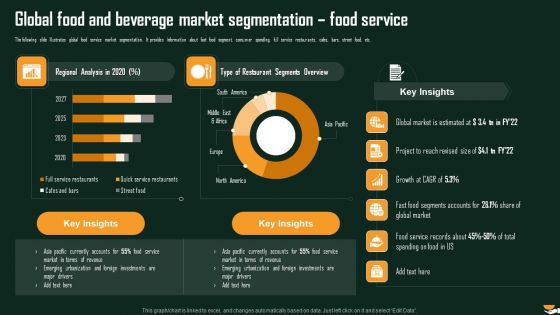
Global Food And Beverage Market Segmentation Food Service International Food And Beverages Sector Analysis Formats PDF
The following slide illustrates global food service market segmentation. It provides information about fast food segment, consumer spending, full service restaurants, cafes, bars, street food, etc. Deliver and pitch your topic in the best possible manner with this Global Food And Beverage Market Segmentation Food Service International Food And Beverages Sector Analysis Formats PDF. Use them to share invaluable insights on Regional Analysis, Restaurant Segments, Market Estimated and impress your audience. This template can be altered and modified as per your expectations. So, grab it now.
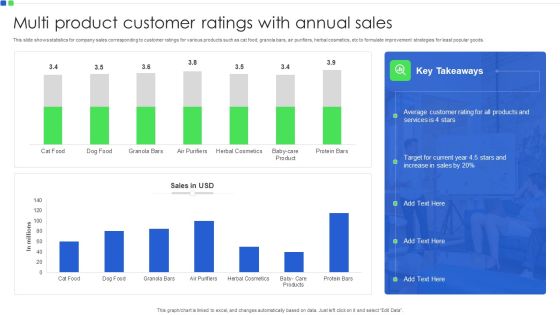
Multi Product Customer Ratings With Annual Sales Infographics PDF
This slide shows statistics for company sales corresponding to customer ratings for various products such as cat food, granola bars, air purifiers, herbal cosmetics, etc to formulate improvement strategies for least popular goods. Showcasing this set of slides titled Multi Product Customer Ratings With Annual Sales Infographics PDF. The topics addressed in these templates are Target For Current Year, Average Customer Rating. All the content presented in this PPT design is completely editable. Download it and make adjustments in color, background, font etc. as per your unique business setting.

Team Selling Forecasts And Deal Conversion Report Themes PDF
This slide covers sales projections for multiple employees in a team. It includes elements such employee names, sales progress bars, closed sales revenue, planned and projected sales revenue. Pitch your topic with ease and precision using this Team Selling Forecasts And Deal Conversion Report Themes PDF. This layout presents information on Sales Progress, Employee, Team Selling Forecasts. It is also available for immediate download and adjustment. So, changes can be made in the color, design, graphics or any other component to create a unique layout.

CSR Projects Completion And Risk Progress Scorecard Microsoft PDF
This slide covers multiple projects under organizations corporate social responsibility with progress status. It includes 4 different projects along with task progress bar, cost incurred , open issues risks, total months, members and tasks count.Pitch your topic with ease and precision using this CSR Projects Completion And Risk Progress Scorecard Microsoft PDF. This layout presents information on System Development, Development Barrel, System Development. It is also available for immediate download and adjustment. So, changes can be made in the color, design, graphics or any other component to create a unique layout.

Strategic Promotion Plan Development Stages Social Media Campaign Management Dashboard Template PDF
This slide showcases a dashboard for managing ad social media campaign to assists marketers in tracking success of ads, content engagement and reach. It highlights element such as date period, goals completion all, goals conversion rate, target progress bar, users, sessions, etc. Welcome to our selection of the Strategic Promotion Plan Development Stages Social Media Campaign Management Dashboard Template PDF. These are designed to help you showcase your creativity and bring your sphere to life. Planning and Innovation are essential for any business that is just starting out. This collection contains the designs that you need for your everyday presentations. All of our PowerPoints are 100 percent editable, so you can customize them to suit your needs. This multi purpose template can be used in various situations. Grab these presentation templates today.

Comprehensive Guide To Build Marketing Strategy Social Media Campaign Clipart PDF
This slide showcases a dashboard for managing ad social media campaign to assists marketers in tracking success of ads, content engagement and reach. It highlights element such as date period, goals completion all, goals conversion rate, target progress bar, users, sessions, etc. Slidegeeks is one of the best resources for PowerPoint templates. You can download easily and regulate Comprehensive Guide To Build Marketing Strategy Social Media Campaign Clipart PDF for your personal presentations from our wonderful collection. A few clicks is all it takes to discover and get the most relevant and appropriate templates. Use our Templates to add a unique zing and appeal to your presentation and meetings. All the slides are easy to edit and you can use them even for advertisement purposes.

Strategic Guide To Perform Marketing Social Media Campaign Management Dashboard Brochure PDF
This slide showcases a dashboard for managing ad social media campaign to assists marketers in tracking success of ads, content engagement and reach. It highlights element such as date period, goals completion all, goals conversion rate, target progress bar, users, sessions, etc. Create an editable Strategic Guide To Perform Marketing Social Media Campaign Management Dashboard Brochure PDF that communicates your idea and engages your audience. Whether youre presenting a business or an educational presentation, pre-designed presentation templates help save time. Strategic Guide To Perform Marketing Social Media Campaign Management Dashboard Brochure PDF is highly customizable and very easy to edit, covering many different styles from creative to business presentations. Slidegeeks has creative team members who have crafted amazing templates. So, go and get them without any delay.

Marketing Mix Strategy Handbook Social Media Campaign Management Dashboard Professional PDF
This slide showcases a dashboard for managing ad social media campaign to assists marketers in tracking success of ads, content engagement and reach. It highlights element such as date period, goals completion all, goals conversion rate, target progress bar, users, sessions, etc. Want to ace your presentation in front of a live audience Our Marketing Mix Strategy Handbook Social Media Campaign Management Dashboard Professional PDF can help you do that by engaging all the users towards you. Slidegeeks experts have put their efforts and expertise into creating these impeccable powerpoint presentations so that you can communicate your ideas clearly. Moreover, all the templates are customizable, and easy-to-edit and downloadable. Use these for both personal and commercial use.

Comprehensive Guide For Sales And Advertising Processes Social Media Campaign Management Dashboard Formats PDF
This slide showcases a dashboard for managing ad social media campaign to assists marketers in tracking success of ads, content engagement and reach. It highlights element such as date period, goals completion all, goals conversion rate, target progress bar, users, sessions, etc. Presenting this PowerPoint presentation, titled Comprehensive Guide For Sales And Advertising Processes Social Media Campaign Management Dashboard Formats PDF, with topics curated by our researchers after extensive research. This editable presentation is available for immediate download and provides attractive features when used. Download now and captivate your audience. Presenting this Comprehensive Guide For Sales And Advertising Processes Social Media Campaign Management Dashboard Formats PDF. Our researchers have carefully researched and created these slides with all aspects taken into consideration. This is a completely customizable Comprehensive Guide For Sales And Advertising Processes Social Media Campaign Management Dashboard Formats PDF that is available for immediate downloading. Download now and make an impact on your audience. Highlight the attractive features available with our PPTs.

Analyzing The Economic Assessment Of Monthly Planned Hours Vs Actual Time Spent Inspiration PDF
This slide shows the evaluation of the monthly planned hours for the project tasks with respect to the actual time taken to complete the tasks. This slide also shows a key takeaways section to elaborate the graph information. Slidegeeks is one of the best resources for PowerPoint templates. You can download easily and regulate Analyzing The Economic Assessment Of Monthly Planned Hours Vs Actual Time Spent Inspiration PDF for your personal presentations from our wonderful collection. A few clicks is all it takes to discover and get the most relevant and appropriate templates. Use our Templates to add a unique zing and appeal to your presentation and meetings. All the slides are easy to edit and you can use them even for advertisement purposes.
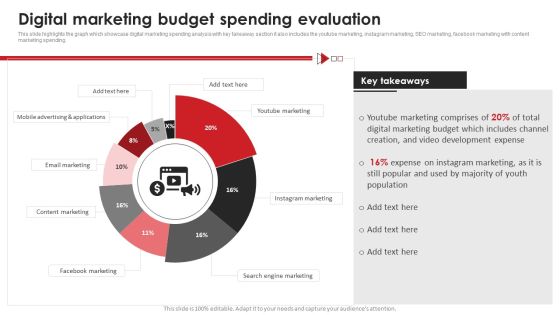
Digital Marketing Budget Spending Evaluation Video Content Advertising Strategies For Youtube Background PDF
This slide highlights the graph which showcase digital marketing spending analysis with key takeaway section it also includes the youtube marketing, instagram marketing, SEO marketing, facebook marketing with content marketing spending.Slidegeeks is here to make your presentations a breeze with Digital Marketing Budget Spending Evaluation Video Content Advertising Strategies For Youtube Background PDF With our easy-to-use and customizable templates, you can focus on delivering your ideas rather than worrying about formatting. With a variety of designs to choose from, you are sure to find one that suits your needs. And with animations and unique photos, illustrations, and fonts, you can make your presentation pop. So whether you are giving a sales pitch or presenting to the board, make sure to check out Slidegeeks first.
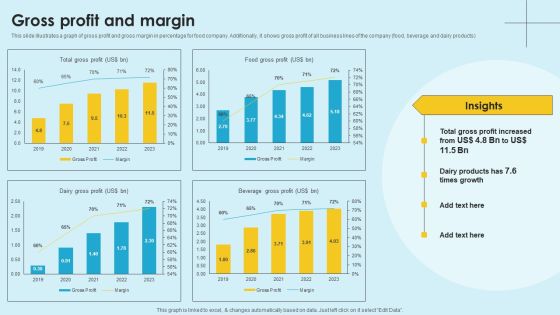
Food Company Financial Performance Summary Gross Profit And Margin Introduction PDF
This slide illustrates a graph of gross profit and gross margin in percentage for food company. Additionally, it shows gross profit of all business lines of the company food, beverage and dairy products. Here you can discover an assortment of the finest PowerPoint and Google Slides templates. With these templates, you can create presentations for a variety of purposes while simultaneously providing your audience with an eye-catching visual experience. Download Food Company Financial Performance Summary Gross Profit And Margin Introduction PDF to deliver an impeccable presentation. These templates will make your job of preparing presentations much quicker, yet still, maintain a high level of quality. Slidegeeks has experienced researchers who prepare these templates and write high-quality content for you. Later on, you can personalize the content by editing the Food Company Financial Performance Summary Gross Profit And Margin Introduction PDF.
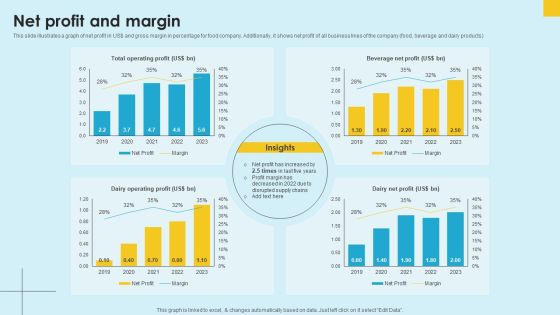
Food Company Financial Performance Summary Net Profit And Margin Professional PDF
This slide illustrates a graph of net profit in US dollar and gross margin in percentage for food company. Additionally, it shows net profit of all business lines of the company food, beverage and dairy products. Do you know about Slidesgeeks Food Company Financial Performance Summary Net Profit And Margin Professional PDF These are perfect for delivering any kind od presentation. Using it, create PowerPoint presentations that communicate your ideas and engage audiences. Save time and effort by using our pre-designed presentation templates that are perfect for a wide range of topic. Our vast selection of designs covers a range of styles, from creative to business, and are all highly customizable and easy to edit. Download as a PowerPoint template or use them as Google Slides themes.

Supply Chain Planning To Enhance Logistics Process Forecast Demand Planning Using Historical Data Ideas PDF
This slides highlights the demand forecasting using line graph of past years for order received data which includes monthly order received data with key highlights tab. Slidegeeks is here to make your presentations a breeze with Supply Chain Planning To Enhance Logistics Process Forecast Demand Planning Using Historical Data Ideas PDF With our easy to use and customizable templates, you can focus on delivering your ideas rather than worrying about formatting. With a variety of designs to choose from, you are sure to find one that suits your needs. And with animations and unique photos, illustrations, and fonts, you can make your presentation pop. So whether you are giving a sales pitch or presenting to the board, make sure to check out Slidegeeks first.

Supply Network Planning And Administration Tactics Forecast Demand Planning Structure PDF
This slides highlights the demand forecasting using line graph of past years for order received data which includes monthly order received data with key highlights tab. Get a simple yet stunning designed Supply Network Planning And Administration Tactics Forecast Demand Planning Structure PDF. It is the best one to establish the tone in your meetings. It is an excellent way to make your presentations highly effective. So, download this PPT today from Slidegeeks and see the positive impacts. Our easy to edit Supply Network Planning And Administration Tactics Forecast Demand Planning Structure PDF can be your go to option for all upcoming conferences and meetings. So, what are you waiting for Grab this template today.
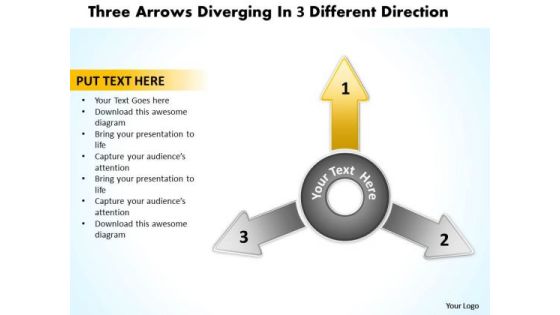
Diverging Arrows Pointing Direction Ppt 2 Relative Cycle Chart PowerPoint Slides
We present our diverging arrows pointing direction ppt 2 Relative Cycle Chart PowerPoint Slides.Download our Process and flows PowerPoint Templates because this Layout can explain the relevance of the different layers and stages in getting down to your core competence, ability and desired result. Download our Business PowerPoint Templates because a brainwave has occurred to you after review. You know just how to push the graph skyward. Download and present our Marketing PowerPoint Templates because The marketplace is the merger of your dreams and your ability. Use our Shapes PowerPoint Templates because our PowerPoint Templates and Slides will give your ideas the shape. Present our Flow charts PowerPoint Templates because they pinpoint the core values of your organisation.Use these PowerPoint slides for presentations relating to Arrow, brochure, business,businessman, button, chart, circle,company, cyclic, data, demonstration,diagram, financial, five,glossy, goal, graph, illustration, info,information, investment, man, manage,marketing, model, navigation, option,part, people, person, pie, presentation,process, result, section, segmented. The prominent colors used in the PowerPoint template are Gray, Black, White. People tell us our diverging arrows pointing direction ppt 2 Relative Cycle Chart PowerPoint Slides are Radiant. Professionals tell us our button PowerPoint templates and PPT Slides are Chic. We assure you our diverging arrows pointing direction ppt 2 Relative Cycle Chart PowerPoint Slides are Quaint. PowerPoint presentation experts tell us our businessman PowerPoint templates and PPT Slides are One-of-a-kind. We assure you our diverging arrows pointing direction ppt 2 Relative Cycle Chart PowerPoint Slides are Multicolored. People tell us our company PowerPoint templates and PPT Slides are Fun.

Creating Customer Personas For Customizing Pie Chart Ppt Professional Slides PDF
This graph or chart is linked to excel, and changes automatically based on data. Just left click on it and select Edit Data. Find highly impressive Creating Customer Personas For Customizing Pie Chart Ppt Professional Slides PDF on Slidegeeks to deliver a meaningful presentation. You can save an ample amount of time using these presentation templates. No need to worry to prepare everything from scratch because Slidegeeks experts have already done a huge research and work for you. You need to download Creating Customer Personas For Customizing Pie Chart Ppt Professional Slides PDF for your upcoming presentation. All the presentation templates are 100 percent editable and you can change the color and personalize the content accordingly. Download now.

Enterprise Consumer Technology Management Company Forecasted Revenue Growth Template PDF
This graph depicts the companys forecasted revenue growth for the year 2019 to 2023 covering revenue, EBITDA, Recurring revenue etc. Presenting this PowerPoint presentation, titled Enterprise Consumer Technology Management Company Forecasted Revenue Growth Template PDF, with topics curated by our researchers after extensive research. This editable presentation is available for immediate download and provides attractive features when used. Download now and captivate your audience. Presenting this Enterprise Consumer Technology Management Company Forecasted Revenue Growth Template PDF. Our researchers have carefully researched and created these slides with all aspects taken into consideration. This is a completely customizable Enterprise Consumer Technology Management Company Forecasted Revenue Growth Template PDF that is available for immediate downloading. Download now and make an impact on your audience. Highlight the attractive features available with our PPTs.
 Home
Home