Bar Graph

Capital Raising Pitch Presentation Smartphones Usage Statistics In USA Pictures PDF
This slide shows the key statistics about in the smartphone usage in USA. Here the graph indicates that in USA, an increase of 20 percent is recorded in terms of smartphones usage. Deliver an awe inspiring pitch with this creative Capital Raising Pitch Presentation Smartphones Usage Statistics In USA Pictures PDF bundle. Topics like Location, Based Recommendations, Listen To Online Music, Participate Video Chat, 2018 To 2021 can be discussed with this completely editable template. It is available for immediate download depending on the needs and requirements of the user.

Why Is Agile Cost Effective IT Defining The Success Rate Of Projects Undertaken Mockup PDF
Mentioned slide portrays organizations success rate of project undertaken and completed over the last two years. Here the graph indicates that success rate gets declined to 58 percent in 2022. Deliver an awe inspiring pitch with this creative Why Is Agile Cost Effective IT Defining The Success Rate Of Projects Undertaken Mockup PDF bundle. Topics like Project Success Rate, IT Projects, 2020 To 2022 can be discussed with this completely editable template. It is available for immediate download depending on the needs and requirements of the user.

Why Is Agile Cost Effective IT Determining Current Resource Cost In Traditional Methodology Information PDF
This slide provide informational stats about the resource cost bear by the organization while using traditional methodology. Here the graph indicates that development stage is the most costlier among requirement, design and test stages. Deliver an awe inspiring pitch with this creative Why Is Agile Cost Effective IT Determining Current Resource Cost In Traditional Methodology Information PDF bundle. Topics like Requirement, Design, Development, Test can be discussed with this completely editable template. It is available for immediate download depending on the needs and requirements of the user.

PMP Tools Project Phase Earned Value Performance Forecast Demonstration PDF
This slide provides the glimpse about the earned value performance forecast graph and table which focuses on planned end and actual date, planned and earned value, and actual cost, etc.Deliver and pitch your topic in the best possible manner with this PMP Tools Project Phase Earned Value Performance Forecast Demonstration PDF Use them to share invaluable insights on Forecast Or Actual, Earned Value, Actual Cost and impress your audience. This template can be altered and modified as per your expectations. So, grab it now.
New Commodity Market Viability Review Product Sales Vs Product Return Mockup PDF
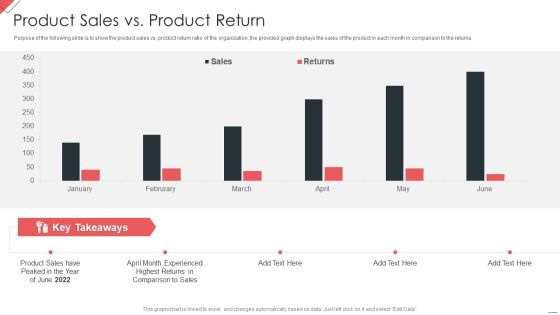
Purpose of the following slide is to show the product sales vs. product return ratio of the organization, the provided graph displays the sales of the product in each month in comparison to the returns Deliver an awe inspiring pitch with this creative New Commodity Market Viability Review Product Sales Vs Product Return Mockup PDF bundle. Topics like Product Sales, Comparison Sales, Highest Returns can be discussed with this completely editable template. It is available for immediate download depending on the needs and requirements of the user.
Finance And Accounting Online Conversion Plan Financial Performance Of The Company Brochure PDF
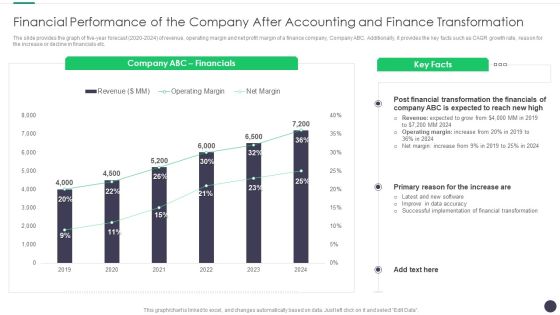
The slide provides the graph of five year forecast 2020 to 2024 of revenue, operating margin and net profit margin of a finance company, Company ABC. Additionally, it provides the key facts such as CAGR growth rate, reason for the increase or decline in financials etc. Deliver and pitch your topic in the best possible manner with this Finance And Accounting Online Conversion Plan Financial Performance Of The Company Brochure PDF. Use them to share invaluable insights on Company, Financials, Financial Transformation and impress your audience. This template can be altered and modified as per your expectations. So, grab it now.
Finance And Accounting Online Conversion Plan Five Year Financial Performance A Finance Company Professional PDF
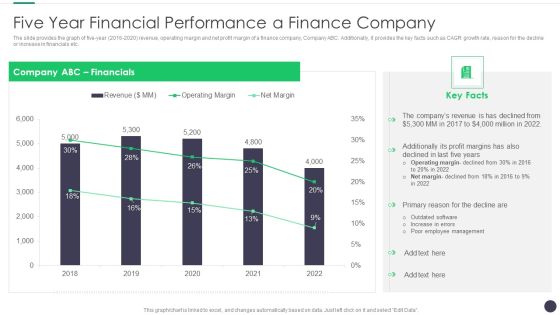
The slide provides the graph of five-year 2016 to 2020 revenue, operating margin and net profit margin of a finance company, Company ABC. Additionally, it provides the key facts such as CAGR growth rate, reason for the decline or increase in financials etc. Deliver and pitch your topic in the best possible manner with this Finance And Accounting Online Conversion Plan Five Year Financial Performance A Finance Company Professional PDF. Use them to share invaluable insights on Company, Financials, Revenue and impress your audience. This template can be altered and modified as per your expectations. So, grab it now.
Revolution In Online Business Transform Customer Experience Ppt PowerPoint Presentation Gallery Microsoft PDF
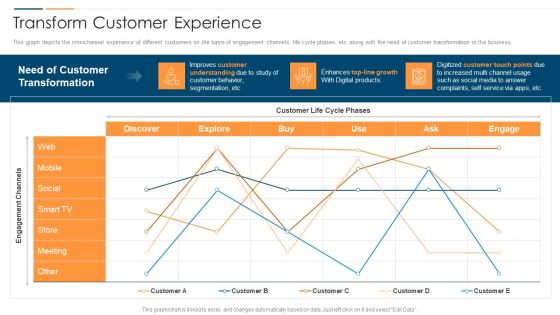
This graph depicts the omnichannel experience of different customer on the basis of engagement channels, life cycle phases, etc. along with the need of customer transformation in the business. Deliver an awe inspiring pitch with this creative Revolution In Online Business Transform Customer Experience Ppt PowerPoint Presentation Gallery Microsoft PDF bundle. Topics like Engagement Channels Customer, Need Customer Transformation, Growth Digital Products can be discussed with this completely editable template. It is available for immediate download depending on the needs and requirements of the user.
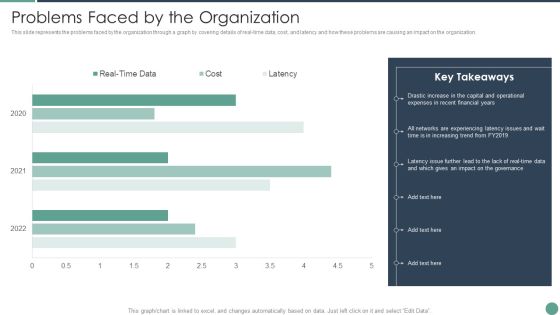
Distributed Computing Problems Faced By The Organization Professional PDF
This slide represents the problems faced by the organization through a graph by covering details of real-time data, cost, and latency and how these problems are causing an impact on the organization.Deliver and pitch your topic in the best possible manner with this Distributed Computing Problems Faced By The Organization Professional PDF Use them to share invaluable insights on Drastic Increase, Expenses Recent, Experiencing Latency and impress your audience. This template can be altered and modified as per your expectations. So, grab it now.

Industry Sizing And Market Analysis For Aerated Drinks Industry Elevator Pitch Deck Information PDF
The following slide displays the Industry sizing and the market opportunity of the organization as it highlight the key stats of the Beverage industry like CAGR, the Industry size and Industry growth per region. The provided graph displays the average spending of single US citizen on beverage consumption.Deliver an awe inspiring pitch with this creative Industry Sizing And Market Analysis For Aerated Drinks Industry Elevator Pitch Deck Information PDF bundle. Topics like Average Annual, Spending Beverage, Consumption Citizen can be discussed with this completely editable template. It is available for immediate download depending on the needs and requirements of the user.
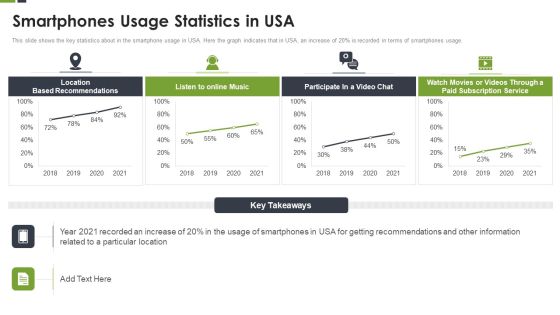
LBS Application Elevator Smartphones Usage Statistics In Usa Ppt Infographics Grid PDF
This slide shows the key statistics about in the smartphone usage in USA. Here the graph indicates that in USA, an increase of 20 percent is recorded in terms of smartphones usage. Deliver and pitch your topic in the best possible manner with this LBS Application Elevator Smartphones Usage Statistics In Usa Ppt Infographics Grid PDF. Use them to share invaluable insights on Location Based, Subscription Service, Particular Location and impress your audience. This template can be altered and modified as per your expectations. So, grab it now.
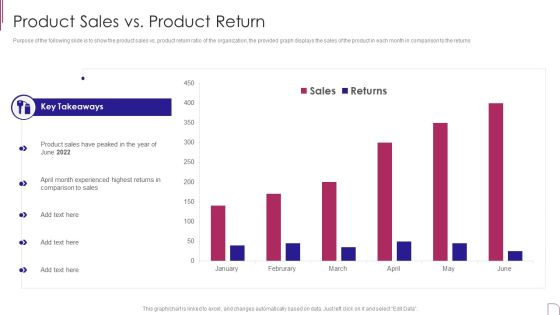
Yearly Product Performance Assessment Repor Product Sales Vs Product Return Information PDF
Purpose of the following slide is to show the product sales vs. product return ratio of the organization, the provided graph displays the sales of the product in each month in comparison to the returns.Deliver an awe inspiring pitch with this creative Yearly Product Performance Assessment Repor Product Sales Vs Product Return Information PDF bundle. Topics like Key Takeaways, Experienced Highest, Comparison Sales can be discussed with this completely editable template. It is available for immediate download depending on the needs and requirements of the user.
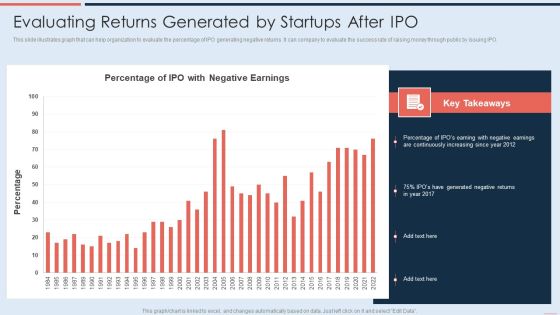
Evaluating Returns Generated By Startups After IPO Brochure PDF
This slide illustrates graph that can help organization to evaluate the percentage of IPO generating negative returns. It can company to evaluate the success rate of raising money through public by issuing IPO. Deliver and pitch your topic in the best possible manner with this Evaluating Returns Generated By Startups After IPO Brochure PDF. Use them to share invaluable insights on Percentage, Continuously Increasing, Generated Negative Returns and impress your audience. This template can be altered and modified as per your expectations. So, grab it now.
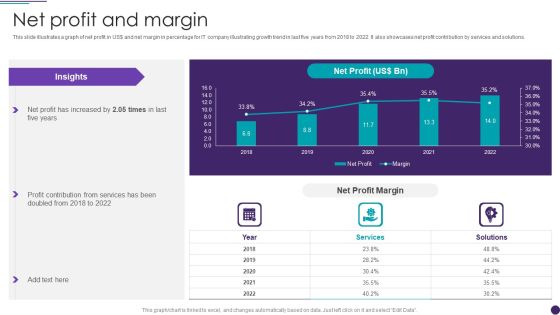
IT Services Business Profile Net Profit And Margin Sample PDF
This slide illustrates a graph of net profit in US doller and net margin in percentage for IT company illustrating growth trend in last five years from 2018 to 2022. It also showcases net profit contribution by services and solutions. Deliver and pitch your topic in the best possible manner with this IT Services Business Profile Net Profit And Margin Sample PDF. Use them to share invaluable insights on Services, Net Profit Margin and impress your audience. This template can be altered and modified as per your expectations. So, grab it now.
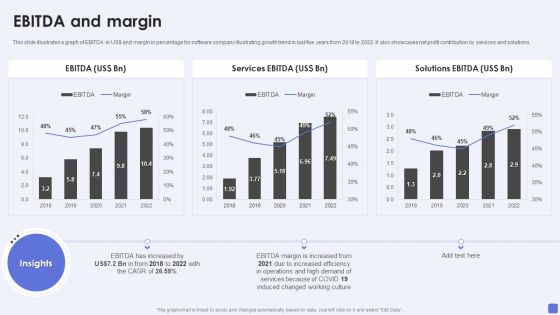
Software Services Business Profile EBITDA And Margin Ppt PowerPoint Presentation Gallery Slide Portrait PDF
This slide illustrates a graph of EBITDA in US dollar and margin in percentage for software company illustrating growth trend in last five years from 2018 to 2022. It also showcases net profit contribution by services and solutions. Deliver an awe inspiring pitch with this creative Software Services Business Profile EBITDA And Margin Ppt PowerPoint Presentation Gallery Slide Portrait PDF bundle. Topics like Services EB, Solutions EBITDA, EBITDA Margin can be discussed with this completely editable template. It is available for immediate download depending on the needs and requirements of the user.
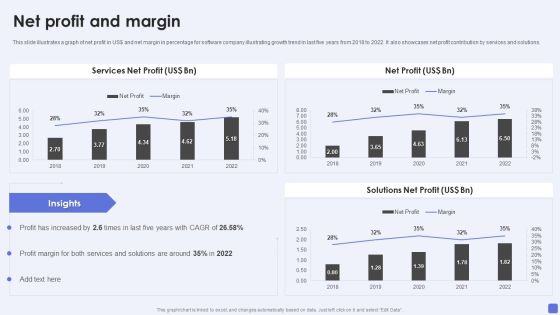
Software Services Business Profile Net Profit And Margin Ppt PowerPoint Presentation File Slides PDF
This slide illustrates a graph of net profit in US dollar and net margin in percentage for software company illustrating growth trend in last five years from 2018 to 2022. It also showcases net profit contribution by services and solutions. Deliver an awe inspiring pitch with this creative Software Services Business Profile Net Profit And Margin Ppt PowerPoint Presentation File Slides PDF bundle. Topics like Services Net Profit, Net Profit, Solutions Net Profit can be discussed with this completely editable template. It is available for immediate download depending on the needs and requirements of the user.
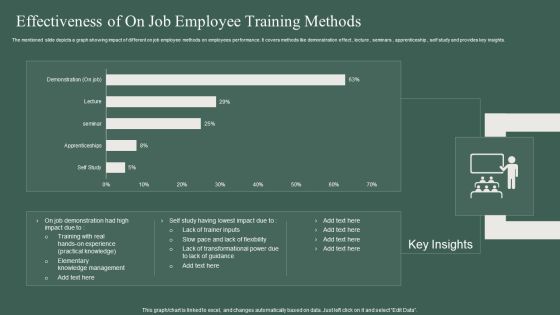
Effectiveness Of On Job Employee Training Methods Ppt PowerPoint Presentation Pictures Introduction PDF
The mentioned slide depicts a graph showing impact of different on job employee methods on employees performance. It covers methods like demonstration effect, lecture, seminars, apprenticeship, self study and provides key insights. Showcasing this set of slides titled Effectiveness Of On Job Employee Training Methods Ppt PowerPoint Presentation Pictures Introduction PDF. The topics addressed in these templates are Effectiveness, Employee Training Methods. All the content presented in this PPT design is completely editable. Download it and make adjustments in color, background, font etc. as per your unique business setting.
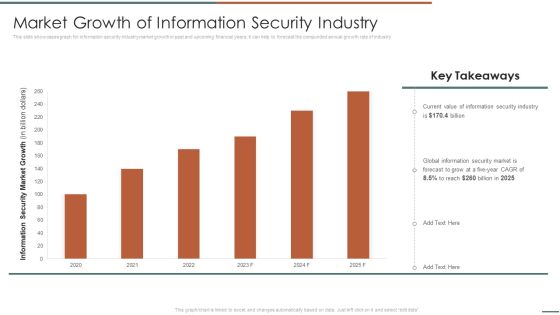
Information Security Risk Evaluation Market Growth Of Information Security Industry Infographics PDF
This slide showcases graph for information security industry market growth in past and upcoming financial years. It can help to forecast the compunded annual growth rate of industry .Deliver and pitch your topic in the best possible manner with this Information Security Risk Evaluation Market Growth Of Information Security Industry Infographics PDF. Use them to share invaluable insights on Information Security, Global Information, Security Market and impress your audience. This template can be altered and modified as per your expectations. So, grab it now.
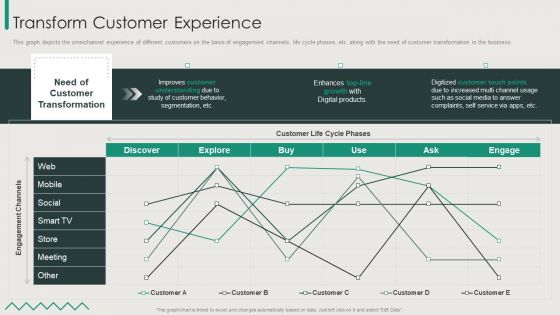
Organization Transition Transform Customer Experience Ppt PowerPoint Presentation File Pictures PDF
This graph depicts the omnichannel experience of different customers on the basis of engagement channels, life cycle phases, etc. along with the need of customer transformation in the business. Deliver and pitch your topic in the best possible manner with this Organization Transition Transform Customer Experience Ppt PowerPoint Presentation File Pictures PDF. Use them to share invaluable insights on Improves Customer, Customer Life, Digital Products and impress your audience. This template can be altered and modified as per your expectations. So, grab it now.

Conducting Monetary Inclusion With Mobile Subscribers Projection And Tele Density Growth Elements PDF
Mentioned slide shows informational stats about mobile subscribers and tele density growth for five years. The graph depicts that total mobile subscription for MFS will get increased by 84percent in 2026. Deliver and pitch your topic in the best possible manner with this Conducting Monetary Inclusion With Mobile Subscribers Projection And Tele Density Growth Elements PDF. Use them to share invaluable insights on Rural Teledensity, Urban Teledensity, Tele Density and impress your audience. This template can be altered and modified as per your expectations. So, grab it now.

Evaluating Hedge Funds For Greater ROI Best Hedge Fund Strategy For High Returns Brochure PDF
This slide showcases the graph which highlights the best hedge fund investment strategies with their performance on the basis of above target level, within range level and below target level set by investor. Deliver an awe inspiring pitch with this creative Evaluating Hedge Funds For Greater ROI Best Hedge Fund Strategy For High Returns Brochure PDF bundle. Topics like Multi Strategy, Range Return, Strategies, Targeted Return can be discussed with this completely editable template. It is available for immediate download depending on the needs and requirements of the user.

Evaluating Hedge Funds For Greater ROI Which Strategy Companies Prefer While Investing Clipart PDF
This slide showcases the graph of enterprise trading strategy in the hedge funds which includes long short equity, long short credit, relative value arbitrage, event driven and global macro. Deliver an awe inspiring pitch with this creative Evaluating Hedge Funds For Greater ROI Which Strategy Companies Prefer While Investing Clipart PDF bundle. Topics like Hedge Fund, Strategy Preference, Equity Driven, Multi Strategy can be discussed with this completely editable template. It is available for immediate download depending on the needs and requirements of the user.

Software Products And Solutions Firm Details EBITDA And Margin Structure PDF
This slide illustrates a graph of EBITDA in US dollar and margin in percentage for software company illustrating growth trend in last five years from 2018 to 2022. It also showcases net profit contribution by services and solutions. Deliver an awe inspiring pitch with this creative Software Products And Solutions Firm Details EBITDA And Margin Structure PDF bundle. Topics like EBITDA, Services EBITDA, Solutions EBITDA, 2018 To 2022 can be discussed with this completely editable template. It is available for immediate download depending on the needs and requirements of the user.
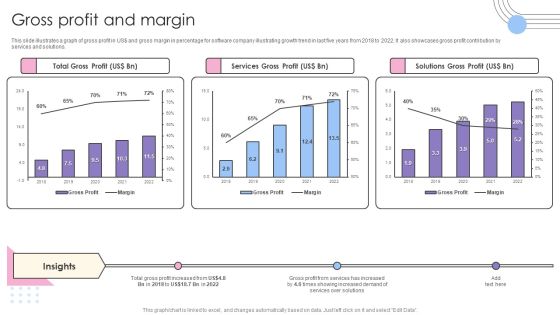
Software Products And Solutions Firm Details Gross Profit And Margin Pictures PDF
This slide illustrates a graph of gross profit in US dollar and gross margin in percentage for software company illustrating growth trend in last five years from 2018 to 2022. It also showcases gross profit contribution by services and solutions. Deliver and pitch your topic in the best possible manner with this Software Products And Solutions Firm Details Gross Profit And Margin Pictures PDF. Use them to share invaluable insights on Total Gross Profit, Services Gross Profit, Solutions Gross Profit and impress your audience. This template can be altered and modified as per your expectations. So, grab it now.

Software Products And Solutions Firm Details Net Profit And Margin Information PDF
This slide illustrates a graph of net profit in US dollar and net margin in percentage for software company illustrating growth trend in last five years from 2018 to 2022. It also showcases net profit contribution by services and solutions. Deliver and pitch your topic in the best possible manner with this Software Products And Solutions Firm Details Net Profit And Margin Information PDF. Use them to share invaluable insights on Net Profit, Services Net Profit, Solutions Net Profit and impress your audience. This template can be altered and modified as per your expectations. So, grab it now.
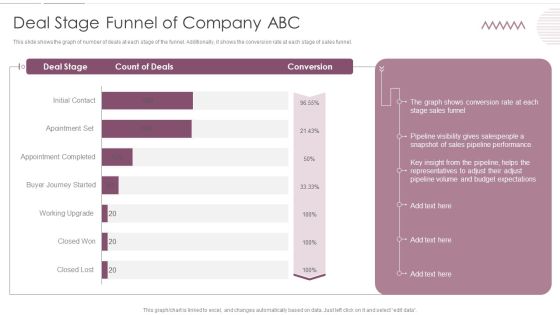
Sales Management Pipeline For Effective Lead Generation Deal Stage Funnel Of Company ABC Inspiration PDF
This slide shows the graph of number of deals at each stage of the funnel. Additionally, it shows the conversion rate at each stage of sales funnel. Deliver and pitch your topic in the best possible manner with this Sales Management Pipeline For Effective Lead Generation Deal Stage Funnel Of Company ABC Inspiration PDF. Use them to share invaluable insights on Pipeline Performance, Sales Funnel, Budget Expectations and impress your audience. This template can be altered and modified as per your expectations. So, grab it now.

Sales Management Pipeline For Effective Lead Generation Decline In Total Sales Of Company ABC Structure PDF
This slide shows graph of impact of sales pipeline challenges on overall sales of the company. Additionally, it provides the reasons behind the sales decline. Deliver and pitch your topic in the best possible manner with this Sales Management Pipeline For Effective Lead Generation Decline In Total Sales Of Company ABC Structure PDF. Use them to share invaluable insights on Sales Pipeline Management, Opportunities, Pipeline Conversion Rate and impress your audience. This template can be altered and modified as per your expectations. So, grab it now.

Business Software Development Company Profile EBITDA And Margin Summary PDF
This slide illustrates a graph of EBITDA in US dollar and margin in percentage for software company illustrating growth trend in last five years from 2018 to 2022. It also showcases net profit contribution by services and solutions. Deliver an awe inspiring pitch with this creative Business Software Development Company Profile EBITDA And Margin Summary PDF bundle. Topics like EBITDA, Services EBITDA, Solutions EBITDA can be discussed with this completely editable template. It is available for immediate download depending on the needs and requirements of the user.

Return On Promotional Investments Dashboard For Marketing Campaign Pictures PDF
This slide covers dashboard showing ROI from several campaigns. It also includes revenue earned, total campaign cost, lead conversion rate, CTR, average CPC, average lead and deal acquisition cost with graph on ROI by Google ads campaign.Showcasing this set of slides titled Return On Promotional Investments Dashboard For Marketing Campaign Pictures PDF. The topics addressed in these templates are Campaign Cost, Lead Conversion, Acquisition Cost. All the content presented in this PPT design is completely editable. Download it and make adjustments in color, background, font etc. as per your unique business setting.

Business Software Development Company Profile Net Profit And Margin Mockup PDF
This slide illustrates a graph of net profit in US dollar and net margin in percentage for software company illustrating growth trend in last five years from 2018 to 2022. It also showcases net profit contribution by services and solutions. Deliver an awe inspiring pitch with this creative Business Software Development Company Profile Net Profit And Margin Mockup PDF bundle. Topics like Net Profit, Services Net Profit, Solutions Net Profit can be discussed with this completely editable template. It is available for immediate download depending on the needs and requirements of the user.
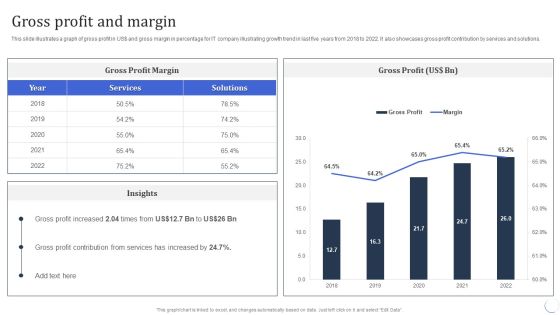
Infotech Solutions Research And Development Company Summary Gross Profit And Margin Ideas PDF
This slide illustrates a graph of gross profit in US dollar and gross margin in percentage for IT company illustrating growth trend in last five years from 2018 to 2022. It also showcases gross profit contribution by services and solutions. Deliver an awe inspiring pitch with this creative Infotech Solutions Research And Development Company Summary Gross Profit And Margin Ideas PDF bundle. Topics like Services, Gross Profit Margin can be discussed with this completely editable template. It is available for immediate download depending on the needs and requirements of the user.
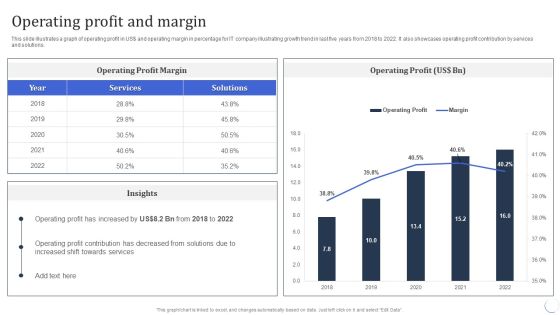
Infotech Solutions Research And Development Company Summary Operating Profit And Margin Download PDF
This slide illustrates a graph of operating profit in US dollar and operating margin in percentage for IT company illustrating growth trend in last five years from 2018 to 2022. It also showcases operating profit contribution by services and solutions. Deliver an awe inspiring pitch with this creative Infotech Solutions Research And Development Company Summary Operating Profit And Margin Download PDF bundle. Topics like Services, Operating Profit can be discussed with this completely editable template. It is available for immediate download depending on the needs and requirements of the user.
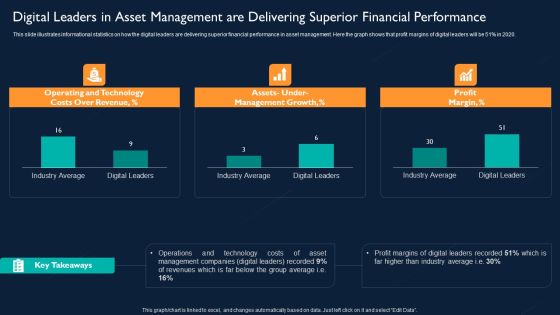
Digital Leaders In Asset Management Are Delivering Superior Financial Performance Designs PDF
This slide illustrates informational statistics on how the digital leaders are delivering superior financial performance in asset management. Here the graph shows that profit margins of digital leaders will be 51 percentage in 2020. Deliver and pitch your topic in the best possible manner with this Digital Leaders In Asset Management Are Delivering Superior Financial Performance Designs PDF. Use them to share invaluable insights on Operating And Technology Costs, Management Growth, Profit Margin and impress your audience. This template can be altered and modified as per your expectations. So, grab it now.
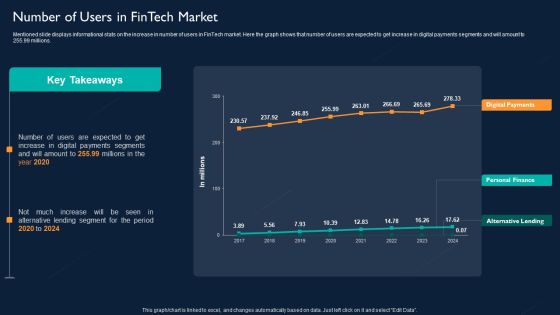
Technology Investment To Enhance Business Growth Number Of Users In Fintech Market Diagrams PDF
Mentioned slide displays informational stats on the increase in number of users in FinTech market. Here the graph shows that number of users are expected to get increase in digital payments segments and will amount to 255.99 millions. Deliver and pitch your topic in the best possible manner with this Technology Investment To Enhance Business Growth Number Of Users In Fintech Market Diagrams PDF. Use them to share invaluable insights on Alternative Lending, Personal Finance, Digital Payments and impress your audience. This template can be altered and modified as per your expectations. So, grab it now.
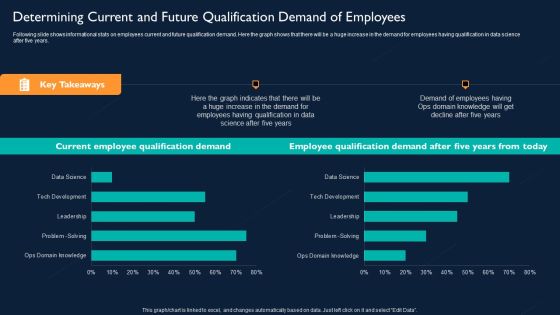
Determining Current And Future Qualification Demand Of Employees Graphics PDF
Following slide shows informational stats on employees current and future qualification demand. Here the graph shows that there will be a huge increase in the demand for employees having qualification in data science after five years. Deliver an awe inspiring pitch with this creative Determining Current And Future Qualification Demand Employees Graphics PDF bundle. Topics like Determining Current, Future Qualification Demand Of Employees can be discussed with this completely editable template. It is available for immediate download depending on the needs and requirements of the user.

Hedge Funds Trading And Investing Strategies Best Hedge Fund Strategy For High Returns Brochure PDF
This slide showcases the graph which highlights the best hedge fund investment strategies with their performance on the basis of above target level, within range level and below target level set by investor. Deliver an awe inspiring pitch with this creative Hedge Funds Trading And Investing Strategies Best Hedge Fund Strategy For High Returns Brochure PDF bundle. Topics like Strategies, Investor, Average can be discussed with this completely editable template. It is available for immediate download depending on the needs and requirements of the user.

Pureprofile Business Overview EBITDA And Margin Ppt Gallery Sample PDF
This slide illustrates a graph of EBITDA in AUD and margin in percentage for Pureprofile company showing growth trend in last six years from 2016 to 2021. It also showcases key insights for EBITDA. Deliver and pitch your topic in the best possible manner with this Pureprofile Business Overview EBITDA And Margin Ppt Gallery Sample PDF. Use them to share invaluable insights on EBITDA Decreased, Business Operations, 2016 To 2021 and impress your audience. This template can be altered and modified as per your expectations. So, grab it now.
Sell Side Merger And Acquisition Major Successful Deals Count Split By Sectors Icons PDF
The slide shows the graph of current deals bifurcation by sectors automobile, construction, financials services etc. under different services merger and acquisition, underwriting, asset management, sales and trading, advisory etc. Deliver an awe inspiring pitch with this creative Sell Side Merger And Acquisition Major Successful Deals Count Split By Sectors Icons PDF bundle. Topics like Current Deals, Count Sectors, Automobile, Construction can be discussed with this completely editable template. It is available for immediate download depending on the needs and requirements of the user.
Sell Side Merger And Acquisition Sales Deals Count Split By Sectors Icons PDF
The slide provides the graph of number of sales deals by sector which the company has handled in last five years. It also covers key facts CAGR growth, deal value etc. related to sales deals of the company. Deliver and pitch your topic in the best possible manner with this Sell Side Merger And Acquisition Sales Deals Count Split By Sectors Icons PDF. Use them to share invaluable insights on Number Sales Deals, Financials Services Sector, 2017 To 2021 and impress your audience. This template can be altered and modified as per your expectations. So, grab it now.

Hedge Fund Risk Management Best Hedge Fund Strategy For High Returns Inspiration PDF
This slide showcases the graph which highlights the best hedge fund investment strategies with their performance on the basis of above target level, within range level and below target level set by investor. Deliver an awe inspiring pitch with this creative Hedge Fund Risk Management Best Hedge Fund Strategy For High Returns Inspiration PDF bundle. Topics like Equity Provides, Multi Strategy, Average can be discussed with this completely editable template. It is available for immediate download depending on the needs and requirements of the user.

IT Application Services Company Outline Gross Profit And Margin Elements PDF
This slide illustrates a graph of gross profit in US dollar and gross margin in percentage for IT company illustrating growth trend in last five years from 2018 to 2022. It also showcases gross profit contribution by services and solutions. Deliver an awe inspiring pitch with this creative IT Application Services Company Outline Gross Profit And Margin Elements PDF bundle. Topics like Gross Profit Margin, Services can be discussed with this completely editable template. It is available for immediate download depending on the needs and requirements of the user.
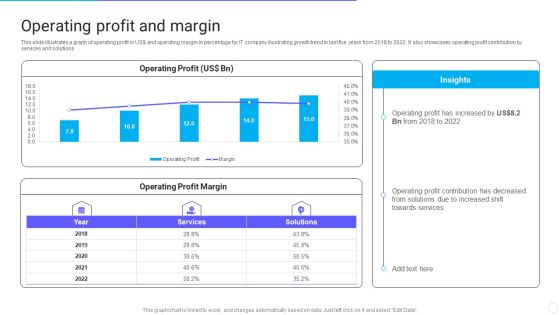
IT Application Services Company Outline Operating Profit And Margin Structure PDF
This slide illustrates a graph of operating profit in US dollar and operating margin in percentage for IT company illustrating growth trend in last five years from 2018 to 2022. It also showcases operating profit contribution by services and solutions. Deliver an awe inspiring pitch with this creative IT Application Services Company Outline Operating Profit And Margin Structure PDF bundle. Topics like Operating Profit And Margin can be discussed with this completely editable template. It is available for immediate download depending on the needs and requirements of the user.
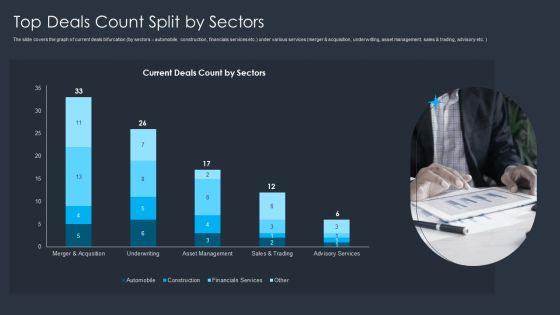
Merger And Acquisition Buying Strategy For Business Growth Top Deals Count Split By Sectors Clipart PDF
The slide covers the graph of current deals bifurcation by sectors automobile, construction, financials services etc. under various services merger and acquisition, underwriting, asset management, sales and trading, advisory etc. Deliver an awe inspiring pitch with this creative Merger And Acquisition Buying Strategy For Business Growth Top Deals Count Split By Sectors Clipart PDF bundle. Topics like Sales, Financials Service, Construction can be discussed with this completely editable template. It is available for immediate download depending on the needs and requirements of the user.

Best Hedge Fund Strategy For High Returns Hedge Fund Performance Topics PDF
This slide showcases the graph which highlights the best hedge fund investment strategies with their performance on the basis of above target level, within range level and below target level set by investor. Deliver an awe inspiring pitch with this creative Best Hedge Fund Strategy For High Returns Hedge Fund Performance Topics PDF bundle. Topics like Best Hedge, Fund Strategy, Return Targeted, Different Strategies can be discussed with this completely editable template. It is available for immediate download depending on the needs and requirements of the user.
Net Profit And Margin IT Software Development Company Profile Icons PDF
This slide illustrates a graph of net profit in US doller and net margin in percentage for IT company illustrating growth trend in last five years from 2018 to 2022. It also showcases net profit contribution by services and solutions. Deliver an awe inspiring pitch with this creative Net Profit And Margin IT Software Development Company Profile Icons PDF bundle. Topics like Net Profit, Net Profit Margin can be discussed with this completely editable template. It is available for immediate download depending on the needs and requirements of the user.

Buy Side Merger And Acquisition Pitch Book Top Deals Count Split By Sectors Guidelines PDF
The slide covers the graph of current deals bifurcation by sectors automobile, construction, financials services etc. under various services merger and acquisition, underwriting, asset management, sales and trading, advisory etc. Deliver an awe inspiring pitch with this creative Buy Side Merger And Acquisition Pitch Book Top Deals Count Split By Sectors Guidelines PDF bundle. Topics like Asset Management, Advisory Services, Sales can be discussed with this completely editable template. It is available for immediate download depending on the needs and requirements of the user.

Comparison Of Beauty Care Products Sales With Competitor Companies Ppt Slides Samples PDF
This slide shows graph which can be used by organizations to represent the sales performance of company in comparison to other competitors. It includes quarterly sales data Showcasing this set of slides titled Comparison Of Beauty Care Products Sales With Competitor Companies Ppt Slides Samples PDF. The topics addressed in these templates are Our Product, Poor Sales Strategy, Product Improvement. All the content presented in this PPT design is completely editable. Download it and make adjustments in color, background, font etc. as per your unique business setting.

Statistics Showing Annual Comparison Of Multiple Beauty Care Products Ppt Infographics Objects PDF
This slide contains graph which can be used by cosmetic manufacturing organizations to represent difference between annual sales of various products. It includes products such as skin care, hair care, oral care and others. Showcasing this set of slides titled Statistics Showing Annual Comparison Of Multiple Beauty Care Products Ppt Infographics Objects PDF. The topics addressed in these templates are Skin Care, Hair Care, 2022 To 2023. All the content presented in this PPT design is completely editable. Download it and make adjustments in color, background, font etc. as per your unique business setting.

Real Estate Business Monthly Sales Forecast Dashboard Ppt Layouts Grid PDF
This slide represents the dashboard showing the data related to sales forecasting for the real estate business. It shows details related to the set target, sales targets won, open and forecasted and also shows the graph representing the sales pipeline for the year. Showcasing this set of slides titled Real Estate Business Monthly Sales Forecast Dashboard Ppt Layouts Grid PDF. The topics addressed in these templates are Next Billing Data, Pipeline, Current Fiscal Year. All the content presented in this PPT design is completely editable. Download it and make adjustments in color, background, font etc. as per your unique business setting.
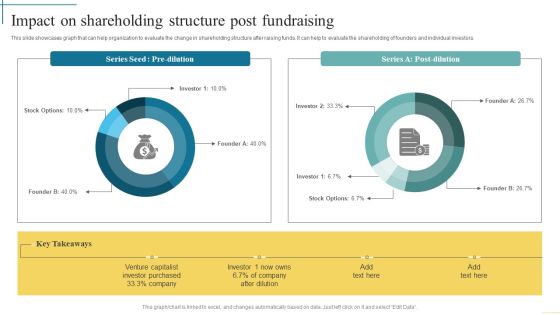
Impact On Shareholding Structure Post Fundraising Developing Fundraising Techniques Graphics PDF
This slide showcases graph that can help organization to evaluate the change in shareholding structure after raising funds. It can help to evaluate the shareholding of founders and individual investors.Present like a pro with Impact On Shareholding Structure Post Fundraising Developing Fundraising Techniques Graphics PDF Create beautiful presentations together with your team, using our easy-to-use presentation slides. Share your ideas in real-time and make changes on the fly by downloading our templates. So whether you are in the office, on the go, or in a remote location, you can stay in sync with your team and present your ideas with confidence. With Slidegeeks presentation got a whole lot easier. Grab these presentations today.

Company Brand Value Over Time AI For Brand Administration Pictures PDF
This graph shows the current situation of our company, where it lies according to other brands. This leads to implementing AI in the organization.Want to ace your presentation in front of a live audience Our Company Brand Value Over Time AI For Brand Administration Pictures PDF can help you do that by engaging all the users towards you.. Slidegeeks experts have put their efforts and expertise into creating these impeccable powerpoint presentations so that you can communicate your ideas clearly. Moreover, all the templates are customizable, and easy-to-edit and downloadable. Use these for both personal and commercial use.

Challenges For Blockchain Technology In Supply Chain Management Demonstration PDF
This slide represents a graph showing the challenges faced by blockchain in areas of supply chain that are visibility, risk allocation, sourcing, fluctuating consumer demand, keeping pace with technology manufacturing, inventory and data management. Showcasing this set of slides titled Challenges For Blockchain Technology In Supply Chain Management Demonstration PDF. The topics addressed in these templates are Inventory Management Challenges, Supply Chain Complexity. All the content presented in this PPT design is completely editable. Download it and make adjustments in color, background, font etc. as per your unique business setting.

Effect Of Conflict Resolution On The Organization Functioning Pictures PDF
The following slide showcases graph representing the effects of conflict management on the organization. Key effects included are reduction in turnover, absenteeism, defects and increase in productivity, sales, profitability and customer satisfaction. Showcasing this set of slides titled Effect Of Conflict Resolution On The Organization Functioning Topics PDF. The topics addressed in these templates areEffect Of Conflict Resolution On The Organization Functioning Pictures PDF. All the content presented in this PPT design is completely editable. Download it and make adjustments in color, background, font etc. as per your unique business setting.

U S IT Operations Analysis Of Market Size Survey Report Guidelines PDF
This slide shows the graph representing the survey report prepared for analysing the market size of the U.S IT operations over the years. It shows analysis over years on the basis of predicative, visual, root cause and behavior analytics. Showcasing this set of slides titled U S IT Operations Analysis Of Market Size Survey Report Guidelines PDF. The topics addressed in these templates are Predict Analysis, Visual Analysis, Behavior Analysis. All the content presented in this PPT design is completely editable. Download it and make adjustments in color, background, font etc. as per your unique business setting.

Project Timeline And Task Progress Scorecard With Budget Allocations Structure PDF
This slide covers project progress summary with task status graph and timeline. It also includes details such project manager, status, budget allocations as per planned spent, count of risks issues, count of pending tasks and key updates. Showcasing this set of slides titled Project Timeline And Task Progress Scorecard With Budget Allocations Structure PDF. The topics addressed in these templates are Project Manager, Project Progress, Project Sponsor. All the content presented in this PPT design is completely editable. Download it and make adjustments in color, background, font etc. as per your unique business setting.
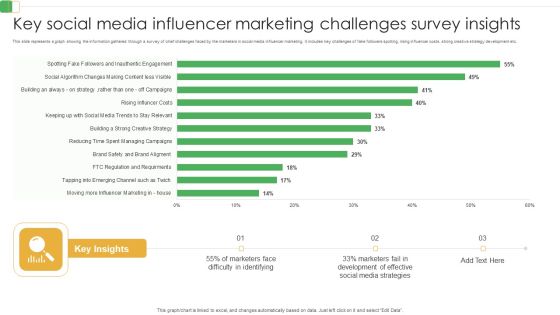
Key Social Media Influencer Marketing Challenges Survey Insights Ppt PowerPoint Presentation File Outline PDF
This slide represents a graph showing the information gathered through a survey of chief challenges faced by the marketers in social media influencer marketing. It includes key challenges of fake followers spotting, rising influencer costs, strong creative strategy development etc.Showcasing this set of slides titled Key Social Media Influencer Marketing Challenges Survey Insights Ppt PowerPoint Presentation File Outline PDF. The topics addressed in these templates are Moving Influencerm, Marketing House, Tapping Emerging. All the content presented in this PPT design is completely editable. Download it and make adjustments in color, background, font etc. as per your unique business setting.

Construction Material Expenses Breakdown Showing Major Expenses Summary PDF
This slide displays a graph where overall building cost is split into individual activities involved to construct most economical houses for people. It includes details such as painting, drywall, HVAC, appliances, insulation, etc. Showcasing this set of slides titled Construction Material Expenses Breakdown Showing Major Expenses Summary PDF. The topics addressed in these templates are Economical Split, Average Cost. All the content presented in this PPT design is completely editable. Download it and make adjustments in color, background, font etc. as per your unique business setting.
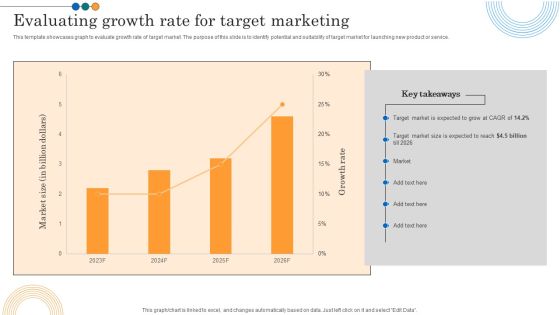
Implementing Marketing Strategies Evaluating Growth Rate For Target Marketing Slides PDF
This template showcases graph to evaluate growth rate of target market. The purpose of this slide is to identify potential and suitability of target market for launching new product or service. Make sure to capture your audiences attention in your business displays with our gratis customizable Implementing Marketing Strategies Evaluating Growth Rate For Target Marketing Slides PDF. These are great for business strategies, office conferences, capital raising or task suggestions. If you desire to acquire more customers for your tech business and ensure they stay satisfied, create your own sales presentation with these plain slides.
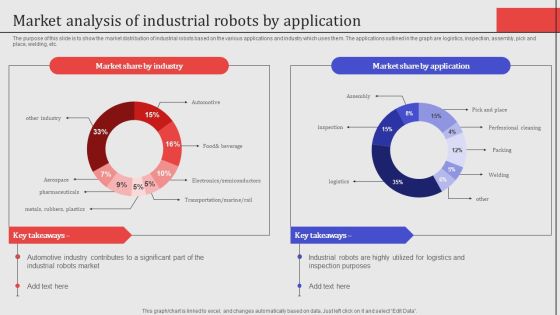
Market Analysis Of Industrial Robots By Application Professional PDF
The purpose of this slide is to show the market distribution of industrial robots based on the various applications and industry which uses them. The applications outlined in the graph are logistics, inspection, assembly, pick and place, welding, etc. Want to ace your presentation in front of a live audience Our Market Analysis Of Industrial Robots By Application Professional PDF can help you do that by engaging all the users towards you.. Slidegeeks experts have put their efforts and expertise into creating these impeccable powerpoint presentations so that you can communicate your ideas clearly. Moreover, all the templates are customizable, and easy-to-edit and downloadable. Use these for both personal and commercial use.
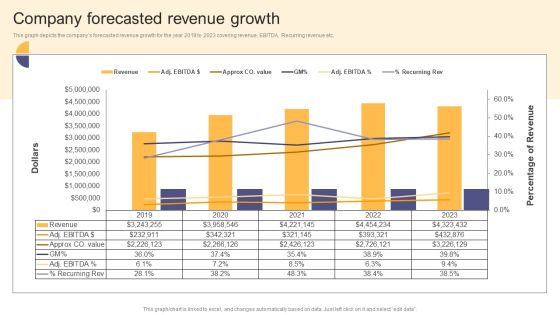
Per Device Pricing Strategy For Managed Solutions Company Forecasted Revenue Growth Themes PDF
This graph depicts the companys forecasted revenue growth for the year 2019 to 2023 covering revenue, EBITDA, Recurring revenue etc. Get a simple yet stunning designed Per Device Pricing Strategy For Managed Solutions Company Forecasted Revenue Growth Themes PDF. It is the best one to establish the tone in your meetings. It is an excellent way to make your presentations highly effective. So, download this PPT today from Slidegeeks and see the positive impacts. Our easy to edit Per Device Pricing Strategy For Managed Solutions Company Forecasted Revenue Growth Themes PDF can be your go to option for all upcoming conferences and meetings. So, what are you waiting for Grab this template today.
 Home
Home