Bar Graph
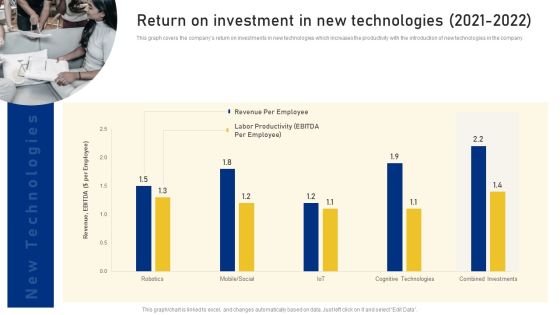
Reshaping Business In Digital Return On Investment In New Technologies 2021 To 2022 Brochure PDF
This graph covers the companys return on investments in new technologies which increases the productivity with the introduction of new technologies in the company. Deliver an awe inspiring pitch with this creative Reshaping Business In Digital Return On Investment In New Technologies 2021 To 2022 Brochure PDF bundle. Topics like Revenue Per Employee, Per Employee Revenue, EBITDA can be discussed with this completely editable template. It is available for immediate download depending on the needs and requirements of the user.

Reshaping Business In Digital Steps Required To Demonstrating Cybersecurity Risk Mitigation Brochure PDF
This graph covers the variety of activities such as enforcing Policy, providing appropriate funding, mandating awareness training, etc. to avoid cybersecurity risks. Deliver an awe inspiring pitch with this creative Reshaping Business In Digital Steps Required To Demonstrating Cybersecurity Risk Mitigation Brochure PDF bundle. Topics like Enforcing Security Policy, Providing Security, Appropriate Funding can be discussed with this completely editable template. It is available for immediate download depending on the needs and requirements of the user.
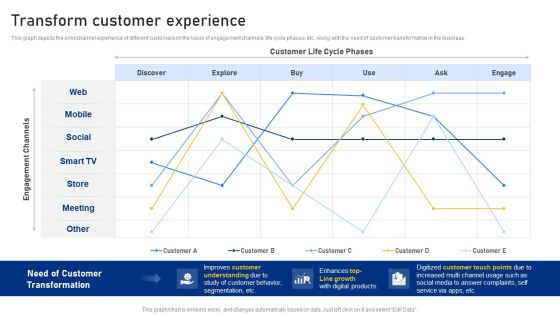
Reshaping Business In Digital Transform Customer Experience Mockup PDF
This graph depicts the omnichannel experience of different customers on the basis of engagement channels, life cycle phases, etc. Along with the need of customer transformation in the business. Deliver and pitch your topic in the best possible manner with this Reshaping Business In Digital Transform Customer Experience Mockup PDF. Use them to share invaluable insights on Customer Life, Cycle Phases, Improves Customer Understanding and impress your audience. This template can be altered and modified as per your expectations. So, grab it now.

Reshaping Business In Digital Blockchain Business Value Forecast 2022 To 2034 Topics PDF
This graph covers the various phases a company will go through during 2018 to 2030 along with the business value and company growth Deliver an awe inspiring pitch with this creative Reshaping Business In Digital Blockchain Business Value Forecast 2022 To 2034 Topics PDF bundle. Topics like Low Success Rate, Larger Investment, Multiple Efficient Models can be discussed with this completely editable template. It is available for immediate download depending on the needs and requirements of the user.
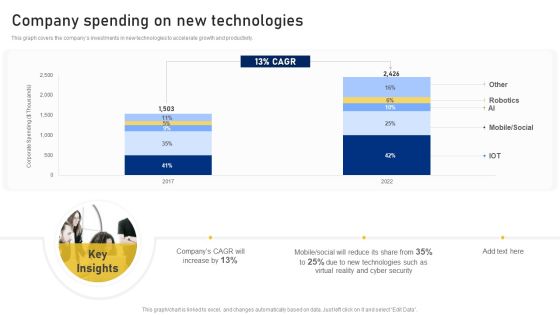
Reshaping Business In Digital Company Spending On New Technologies Clipart PDF
This graph covers the companys investments in new technologies to accelerate growth and productivity. Deliver an awe inspiring pitch with this creative Reshaping Business In Digital Company Spending On New Technologies Clipart PDF bundle. Topics like Corporate Spending, New Technologies, Cyber Security can be discussed with this completely editable template. It is available for immediate download depending on the needs and requirements of the user.

Which Strategy Companies Prefer While Investing In Hedge Funds Pictures PDF
This slide showcases the graph of enterprise trading strategy in the hedge funds which includes long short equity, long short credit, relative value arbitrage, event driven and global macro. Deliver an awe inspiring pitch with this creative Which Strategy Companies Prefer While Investing In Hedge Funds Pictures PDF bundle. Topics like Investors, Low Risk, Fund Strategy Preference can be discussed with this completely editable template. It is available for immediate download depending on the needs and requirements of the user.

Deal Stage Funnel Of Company ABC Sales Funnel Management Strategies To Increase Sales Sample PDF
This slide shows the graph of number of deals at each stage of the funnel. Additionally, it shows the conversion rate at each stage of sales funnel.Deliver an awe inspiring pitch with this creative Deal Stage Funnel Of Company ABC Sales Funnel Management Strategies To Increase Sales Sample PDF bundle. Topics like Pipeline Visibility, Salespeople A Snapshot, Budget Expectations can be discussed with this completely editable template. It is available for immediate download depending on the needs and requirements of the user.

Decline In Opportunity Win Rate Sales Funnel Management Strategies To Increase Sales Background PDF
This slide shows graph of impact of sales pipeline challenges on opportunity win rate. Additionally, it provides the reasons for decline in win rate.Deliver and pitch your topic in the best possible manner with this Decline In Opportunity Win Rate Sales Funnel Management Strategies To Increase Sales Background PDF. Use them to share invaluable insights on Opportunity Final, Opportunity Rate, Opportunity Qualification and impress your audience. This template can be altered and modified as per your expectations. So, grab it now.

Decline In Total Sales Of Company ABC Sales Funnel Management Strategies To Increase Sales Formats PDF
This slide shows graph of impact of sales pipeline challenges on overall sales of the company. Additionally, it provides the reasons behind the sales decline.Deliver an awe inspiring pitch with this creative Decline In Total Sales Of Company ABC Sales Funnel Management Strategies To Increase Sales Formats PDF bundle. Topics like Stuck Opportunities, Sales Management, Decline Pipeline can be discussed with this completely editable template. It is available for immediate download depending on the needs and requirements of the user.

ROI Of Sales Pipeline Review Sales Funnel Management Strategies To Increase Sales Rules PDF
This slide shows the quarterly return-on-investment graph of sales pipeline review. Additionally, it shows the before and after pipeline review values of various metrics , Deliver an awe inspiring pitch with this creative ROI Of Sales Pipeline Review Sales Funnel Management Strategies To Increase Sales Rules PDF bundle. Topics like Return Investment, Review Expenses, Pipeline Review can be discussed with this completely editable template. It is available for immediate download depending on the needs and requirements of the user.

5 Phases Of Cross Functional Team Development Teams Working Towards A Shared Objective Microsoft PDF
This slide covers the graph of performance impact on team effectiveness along with the description of cross functional stages such as forming, storming, norming, performing, and adjourning.Deliver an awe inspiring pitch with this creative 5 Phases Of Cross Functional Team Development Teams Working Towards A Shared Objective Microsoft PDF bundle. Topics like Storming, Norming, Performing can be discussed with this completely editable template. It is available for immediate download depending on the needs and requirements of the user.

Action Plan To Implement Exit Strategy For Investors Valuation Using Discounted Cash Flow For Next 5 Years Sample PDF
Purpose of the following slide is to use discounted cash flow as a technique for valuating organization. The graph displays DCF for 5 years. Deliver an awe inspiring pitch with this creative Action Plan To Implement Exit Strategy For Investors Valuation Using Discounted Cash Flow For Next 5 Years Sample PDF bundle. Topics like Income Tax, Operating Working Capital, Investment can be discussed with this completely editable template. It is available for immediate download depending on the needs and requirements of the user.

Analysis Of Cleanliness At Retail Store Retail Outlet Operations Performance Evaluation Diagrams PDF
This slide illustrates the graph to showcase visitors responses towards the cleanliness of multiple store areas such as floor, display counters, try rooms etc.Deliver and pitch your topic in the best possible manner with this Analysis Of Cleanliness At Retail Store Retail Outlet Operations Performance Evaluation Diagrams PDF. Use them to share invaluable insights on Retail Store, Visitors Responded, Stores Floors and impress your audience. This template can be altered and modified as per your expectations. So, grab it now.
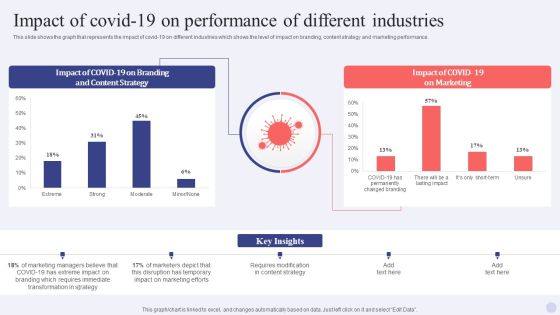
Electronic Commerce Systems Impact Of Covid 19 On Performance Of Different Industries Information PDF
This slide shows the graph that represents the impact of covid-19 on different industries which shows the level of impact on branding, content strategy and marketing performance. Deliver an awe inspiring pitch with this creative Electronic Commerce Systems Impact Of Covid 19 On Performance Of Different Industries Information PDF bundle. Topics like Content Strategy, Requires Modification, Marketing Efforts can be discussed with this completely editable template. It is available for immediate download depending on the needs and requirements of the user.
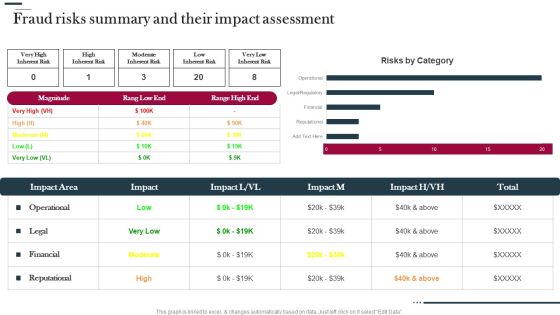
Various Strategies To Prevent Business Fraud Risks Summary And Their Impact Assessment Download PDF
This graph is linked to excel, and changes automatically based on data. Just left click on it select Edit Data. Deliver an awe inspiring pitch with this creative Various Strategies To Prevent Business Fraud Risks Summary And Their Impact Assessment Download PDF bundle. Topics like Risks Category, Operational, Legal can be discussed with this completely editable template. It is available for immediate download depending on the needs and requirements of the user.

Consumer Content Preferences Trends Analysis Statistical Designs PDF
This slide shows the graph representing the latest trends in the changing preferences of the content preferred by the consumers. It shows content preference of consumers of different age groups. Deliver an awe inspiring pitch with this creative Consumer Content Preferences Trends Analysis Statistical Designs PDF bundle. Topics like Consumer Content Preferences, Trends Analysis Statistical can be discussed with this completely editable template. It is available for immediate download depending on the needs and requirements of the user.

Global Ecommerce Sales Trend Analysis Statistical Report Mockup PDF
This slide shows the statistical graph representing the emerging trends in the sales growth of Ecommerce sites. It shows increase in sales of ecommerce sites in seven years. Deliver and pitch your topic in the best possible manner with this Global Ecommerce Sales Trend Analysis Statistical Report Mockup PDF. Use them to share invaluable insights on Sales Growth, Ecommerce Sites and impress your audience. This template can be altered and modified as per your expectations. So, grab it now.
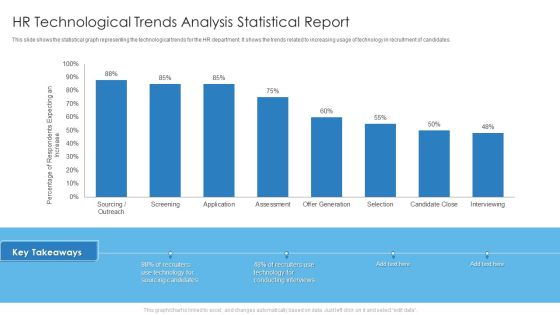
HR Technological Trends Analysis Statistical Report Slides PDF
This slide shows the statistical graph representing the technological trends for the HR department. It shows the trends related to increasing usage of technology in recruitment of candidates. Deliver an awe inspiring pitch with this creative HR Technological Trends Analysis Statistical Report Slides PDF bundle. Topics like Hr Technological Trends, Analysis Statistical Report can be discussed with this completely editable template. It is available for immediate download depending on the needs and requirements of the user.
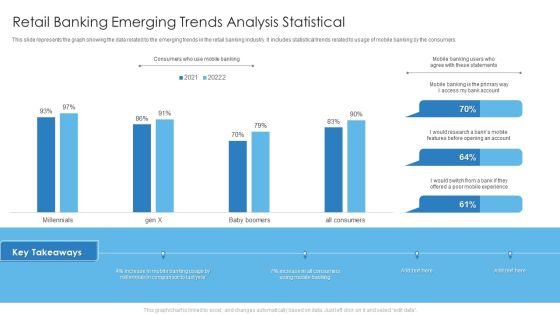
Retail Banking Emerging Trends Analysis Statistical Background PDF
This slide represents the graph showing the data related to the emerging trends in the retail banking industry. It includes statistical trends related to usage of mobile banking by the consumers. Deliver and pitch your topic in the best possible manner with this Retail Banking Emerging Trends Analysis Statistical Background PDF. Use them to share invaluable insights on Retail Banking Emerging, Trends Analysis Statistical and impress your audience. This template can be altered and modified as per your expectations. So, grab it now.

Technological Trends Analysis In Hospitality Industry Statistical Professional PDF
This slide shows the graph representing the latest technological trends emerging in the hospitality industry. It includes latest trends such as usage of location based technology, tablets at front desk, mobile payment etc. Deliver and pitch your topic in the best possible manner with this Technological Trends Analysis In Hospitality Industry Statistical Professional PDF. Use them to share invaluable insights on Technology, Location, Services and impress your audience. This template can be altered and modified as per your expectations. So, grab it now.
Upcoming Talent Management Trend In Hr Statistical Icons PDF
This slide shows the graph representing the statistical data related to upcoming trends in the talent management by the human resource department of different sectors. Deliver and pitch your topic in the best possible manner with this Upcoming Talent Management Trend In Hr Statistical Icons PDF. Use them to share invaluable insights on Upcoming Talent Management, Trend In Hr Statistical and impress your audience. This template can be altered and modified as per your expectations. So, grab it now.
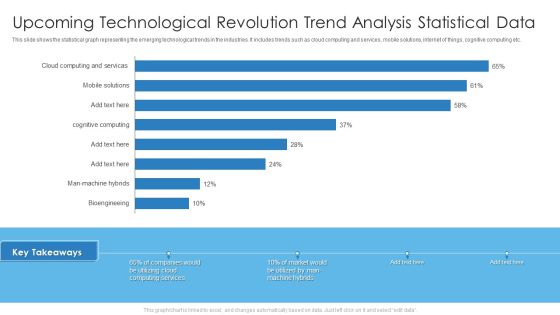
Upcoming Technological Revolution Trend Analysis Statistical Data Professional PDF
This slide shows the statistical graph representing the emerging technological trends in the industries. It includes trends such as cloud computing and services, mobile solutions, internet of things, cognitive computing etc. Deliver an awe inspiring pitch with this creative Upcoming Technological Revolution Trend Analysis Statistical Data Professional PDF bundle. Topics like Upcoming Technological Revolution, Trend Analysis Statistical Data can be discussed with this completely editable template. It is available for immediate download depending on the needs and requirements of the user.
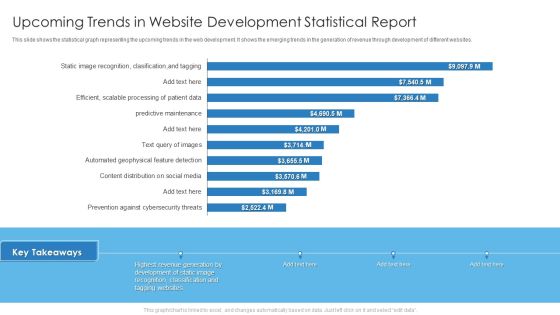
Upcoming Trends In Website Development Statistical Report Information PDF
This slide shows the statistical graph representing the upcoming trends in the web development. It shows the emerging trends in the generation of revenue through development of different websites. Deliver an awe inspiring pitch with this creative Upcoming Trends In Website Development Statistical Report Information PDF bundle. Topics like Upcoming Trends In Website, Development Statistical Report can be discussed with this completely editable template. It is available for immediate download depending on the needs and requirements of the user.

Information Transformation Process Toolkit Reasons Towards Failure Of Data Analytics Project Summary PDF
This slide shows the graph highlighting key reasons for the failure of data management project. Deliver and pitch your topic in the best possible manner with this Information Transformation Process Toolkit Reasons Towards Failure Of Data Analytics Project Summary P. Use them to share invaluable insights on Reasons Towards Failure, Data Analytics Project and impress your audience. This template can be altered and modified as per your expectations. So, grab it now.
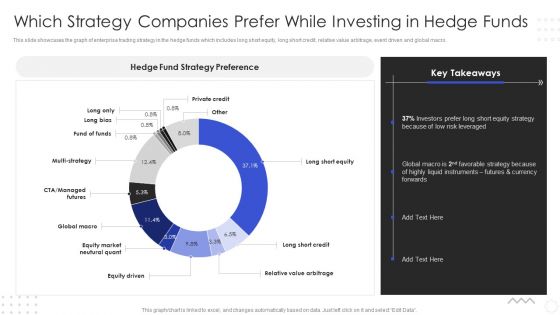
Hedge Fund Risk Management Which Strategy Companies Prefer While Investing In Hedge Funds Microsoft PDF
This slide showcases the graph of enterprise trading strategy in the hedge funds which includes long short equity, long short credit, relative value arbitrage, event driven and global macro. Deliver an awe inspiring pitch with this creative Hedge Fund Risk Management Which Strategy Companies Prefer While Investing In Hedge Funds Microsoft PDF bundle. Topics like Investors, Risk Equity, Strategy can be discussed with this completely editable template. It is available for immediate download depending on the needs and requirements of the user.

Merger And Acquisition Buying Strategy For Business Growth Management Vs Consensus Revenue Forecast Designs PDF
The graph depicts a revenue comparison between management and consensus. It shows historical 2015 to 2020 and projected revenue 2021 to 2024. Deliver and pitch your topic in the best possible manner with this Merger And Acquisition Buying Strategy For Business Growth Management Vs Consensus Revenue Forecast Designs PDF. Use them to share invaluable insights on Management, Consensus Revenue Forecast and impress your audience. This template can be altered and modified as per your expectations. So, grab it now.
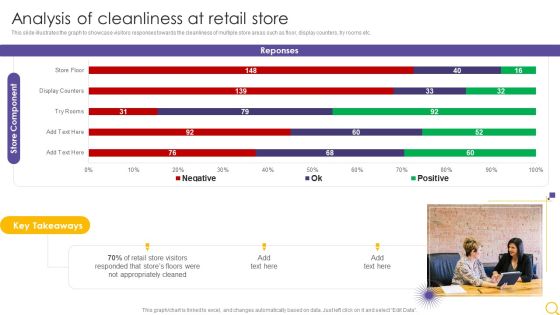
Retail Outlet Operational Efficiency Analytics Analysis Of Cleanliness At Retail Store Background PDF
This slide illustrates the graph to showcase visitors responses towards the cleanliness of multiple store areas such as floor, display counters, try rooms etc. Deliver and pitch your topic in the best possible manner with this Retail Outlet Operational Efficiency Analytics Analysis Of Cleanliness At Retail Store Background PDF. Use them to share invaluable insights on Retail Store, Visitors Responded, Appropriately Cleaned and impress your audience. This template can be altered and modified as per your expectations. So, grab it now.
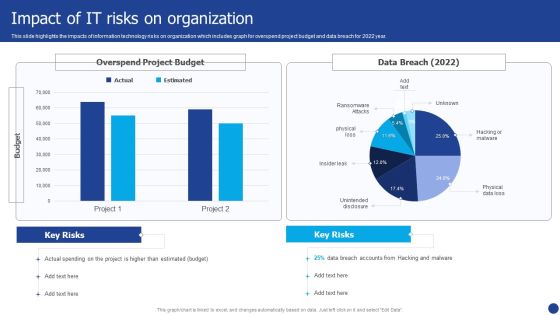
Information Technology Threat Mitigation Methods Impact Of IT Risks On Organization Rules PDF
This slide highlights the impacts of information technology risks on organization which includes graph for overspend project budget and data breach for 2022 year. Deliver and pitch your topic in the best possible manner with this Information Technology Threat Mitigation Methods Impact Of IT Risks On Organization Rules PDF. Use them to share invaluable insights on Impact Of IT Risks, Organization and impress your audience. This template can be altered and modified as per your expectations. So, grab it now.

Quarterly Comparison Of Staff Productivity Enhancement Ppt PowerPoint Presentation Ideas Aids PDF
This slide shows the employees average productivity graph working in the organization. A sudden decline has been observed in employee productivity in Q3. Showcasing this set of slides titled Quarterly Comparison Of Staff Productivity Enhancement Ppt PowerPoint Presentation Ideas Aids PDF. The topics addressed in these templates are Employee Productivity, Sudden Decline, Workplace Stress. All the content presented in this PPT design is completely editable. Download it and make adjustments in color, background, font etc. as per your unique business setting.

Monthly Project Work Progress Details Report Ppt PowerPoint Presentation File Example Topics PDF
The slide shows a graph showing status of work of project. It includes work completed, work on track and work not yet started. Showcasing this set of slides titled Monthly Project Work Progress Details Report Ppt PowerPoint Presentation File Example Topics PDF. The topics addressed in these templates are Project Complete, Project Track, Project Achieved. All the content presented in this PPT design is completely editable. Download it and make adjustments in color, background, font etc. as per your unique business setting.

Finance Department Will Deploy Ai Technologies Deploying Artificial Intelligence In Business Topics PDF
This graph shows various technologies which our company will deploy by year 2021 such as predictive analysis, mobile support, RPA, integration of external data, etc.Deliver an awe inspiring pitch with this creative Finance Department Will Deploy Ai Technologies Deploying Artificial Intelligence In Business Topics PDF bundle. Topics like Natural Language, Blockchain, Artificial Intelligence can be discussed with this completely editable template. It is available for immediate download depending on the needs and requirements of the user.

Buy Side Merger And Acquisition Pitch Book Management Vs Consensus Revenue Forecast Brochure PDF
The graph depicts a revenue comparison between management and consensus. It shows historical 2015 2020 and projected revenue 2021 2024. Deliver and pitch your topic in the best possible manner with this Buy Side Merger And Acquisition Pitch Book Management Vs Consensus Revenue Forecast Brochure PDF. Use them to share invaluable insights on Management, Consensus Revenue Forecast and impress your audience. This template can be altered and modified as per your expectations. So, grab it now.
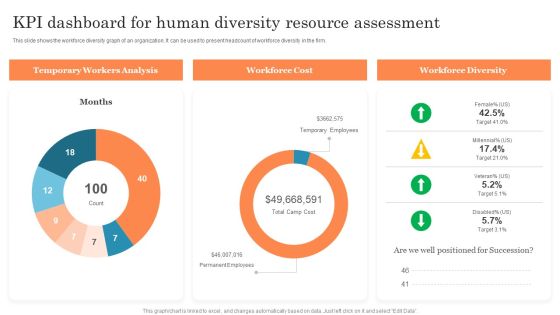
KPI Dashboard For Human Diversity Resource Assessment Ppt PowerPoint Presentation Model Vector PDF
This slide shows the workforce diversity graph of an organization. It can be used to present headcount of workforce diversity in the firm. Showcasing this set of slides titled KPI Dashboard For Human Diversity Resource Assessment Ppt PowerPoint Presentation Model Vector PDF. The topics addressed in these templates are Temporary Workers, Temporary Employees, Workforce Diversity. All the content presented in this PPT design is completely editable. Download it and make adjustments in color, background, font etc. as per your unique business setting.
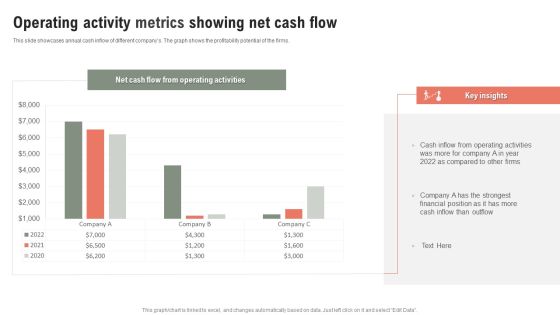
Operating Activity Metrics Showing Net Cash Flow Ppt Outline Slide Download PDF
This slide showcases annual cash inflow of different companys. The graph shows the profitability potential of the firm. Showcasing this set of slides titled Operating Activity Metrics Showing Net Cash Flow Ppt Outline Slide Download PDF. The topics addressed in these templates are Net Cash Flow, Operating Activities, Key Insights, 2020 To 2022. All the content presented in this PPT design is completely editable. Download it and make adjustments in color, background, font etc. as per your unique business setting.
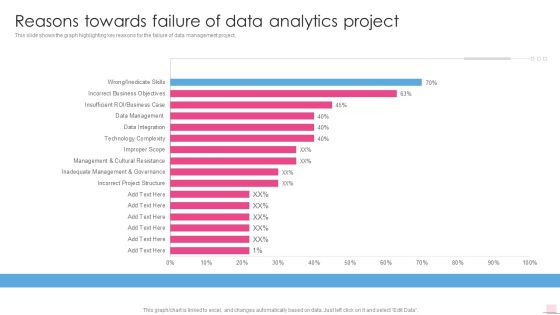
Reasons Towards Failure Of Data Analytics Project Business Analysis Modification Toolkit Topics PDF
This slide shows the graph highlighting key reasons for the failure of data management project.Deliver an awe inspiring pitch with this creative Reasons Towards Failure Of Data Analytics Project Business Analysis Modification Toolkit Topics PDF bundle. Topics like Incorrect Project, Inadequate Management, Cultural Resistance can be discussed with this completely editable template. It is available for immediate download depending on the needs and requirements of the user.

Career Succession Planning By Human Resource Department Statistics Graphics PDF
This slide represents the graph showing the statistics related to the key insights of the succession plan developed by the human resource department of the organization. Showcasing this set of slides titled Career Succession Planning By Human Resource Department Statistics Graphics PDF. The topics addressed in these templates are Employees, Customer, Marketing Manager. All the content presented in this PPT design is completely editable. Download it and make adjustments in color, background, font etc. as per your unique business setting.
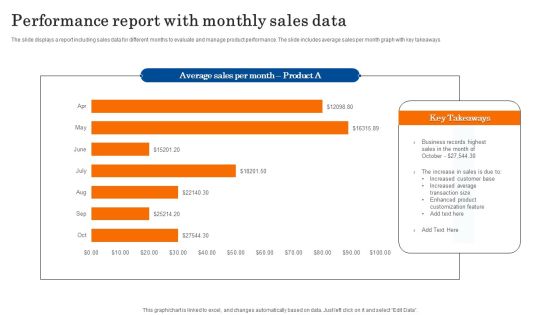
Performance Report With Monthly Sales Data Diagrams PDF
The slide displays a report including sales data for different months to evaluate and manage product performance. The slide includes average sales per month graph with key takeaways. Showcasing this set of slides titled Performance Report With Monthly Sales Data Diagrams PDF. The topics addressed in these templates are Business, Sales, Customization. All the content presented in this PPT design is completely editable. Download it and make adjustments in color, background, font etc. as per your unique business setting.

Customer Relationship Management And Daily Payments Dashboard With Top Reviews Professional PDF
This slide illustrates graphical representation of customer relationship management figures. It includes revenue, daily payments graph and top products etc. Showcasing this set of slides titled Customer Relationship Management And Daily Payments Dashboard With Top Reviews Professional PDF. The topics addressed in these templates are Quality Product, Services, Revenue. All the content presented in this PPT design is completely editable. Download it and make adjustments in color, background, font etc. as per your unique business setting.

Customer Relationship Management Dashboard With Sales And Profit Summary Microsoft PDF
This slide illustrates graphical representation of sales and profit figures. It includes sales summary, revenue vs. expenditure graph and ticket record etc. Showcasing this set of slides titled Customer Relationship Management Dashboard With Sales And Profit Summary Microsoft PDF. The topics addressed in these templates are Product Catalogue, Sales, Profit. All the content presented in this PPT design is completely editable. Download it and make adjustments in color, background, font etc. as per your unique business setting.
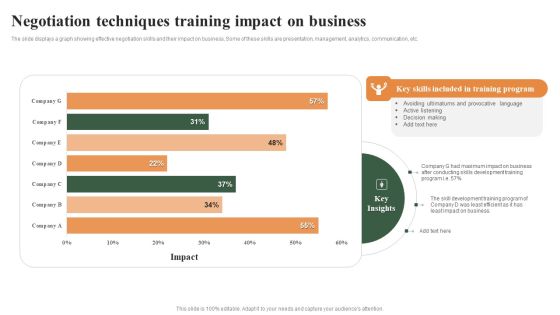
Negotiation Techniques Training Impact On Business Ppt Infographics Visual Aids PDF
The slide displays a graph showing effective negotiation skills and their impact on business, Some of these skills are presentation, management, analytics, communication, etc. Showcasing this set of slides titled Negotiation Techniques Training Impact On Business Ppt Infographics Visual Aids PDF. The topics addressed in these templates are Avoiding Ultimatums, Provocative Language, Active Listening, Decision Making. All the content presented in this PPT design is completely editable. Download it and make adjustments in color, background, font etc. as per your unique business setting.

Cost Analysis For Fixing Software Glitch Inspiration PDF
This graph depicts cost to fix bugs based on different time period. It include various stages such as requirements, coding, component testing, system testing and production. Showcasing this set of slides titled Cost Analysis For Fixing Software Glitch Inspiration PDF. The topics addressed in these templates are Increase Complexity, Remembering Codes, Lack Availability Service . All the content presented in this PPT design is completely editable. Download it and make adjustments in color, background, font etc. as per your unique business setting.

Hiring Agency Profile With Financial Charts Ppt Model Example PDF
This graph or chart is linked to excel, and changes automatically based on data. Just left click on it and select edit data. Pitch your topic with ease and precision using this hiring agency profile with financial charts ppt model example pdf. This layout presents information on revenue, operating income, operating margin, satisfaction rate. It is also available for immediate download and adjustment. So, changes can be made in the color, design, graphics or any other component to create a unique layout.

Chart Illustrating Manufacturing Plant Energy Consumption Statistics Slides PDF
This graph or chart is linked to excel, and changes automatically based on data. Just left click on it and select edit data. Pitch your topic with ease and precision using this Chart Illustrating Manufacturing Plant Energy Consumption Statistics Slides PDF. This layout presents information on Equipment Inefficiency, Process Heating, Energy Export. It is also available for immediate download and adjustment. So, changes can be made in the color, design, graphics or any other component to create a unique layout.
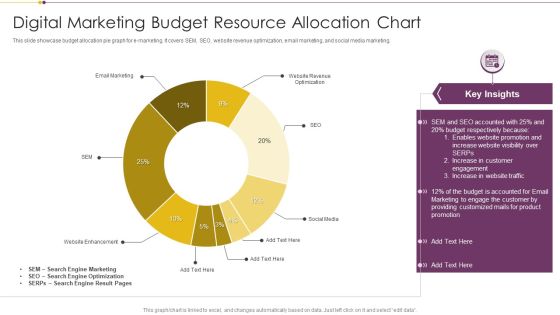
Digital Marketing Budget Resource Allocation Chart Download PDF
This slide showcase budget allocation pie graph for e marketing. It covers SEM, SEO, website revenue optimization, email marketing, and social media marketing. Pitch your topic with ease and precision using this Digital Marketing Budget Resource Allocation Chart Download PDF. This layout presents information on Search Engine Marketing, Search Engine Optimization, Budget. It is also available for immediate download and adjustment. So, changes can be made in the color, design, graphics or any other component to create a unique layout.

Chart Illustrating Consumer Journey With Lifetime Value Ppt PowerPoint Presentation File Background Images PDF
The following slide illustrates the graph of customer lifecycle value and customer lifetime with monthly data. Pitch your topic with ease and precision using this chart illustrating consumer journey with lifetime value ppt powerpoint presentation file background images pdf. This layout presents information on chart illustrating consumer journey with lifetime value. It is also available for immediate download and adjustment. So, changes can be made in the color, design, graphics or any other component to create a unique layout.

Market Chart Showing Revenue Breakdown Of IT Products Ppt File Elements PDF
This slide shows the revenue comparison graph of IT products over last six months. IT products covered in the slide are hardware and software. Pitch your topic with ease and precision using this Market Chart Showing Revenue Breakdown Of IT Products Ppt File Elements PDF. This layout presents information on Hardware, Software, Key Insights. It is also available for immediate download and adjustment. So, changes can be made in the color, design, graphics or any other component to create a unique layout.

Product Market Share Chart Of Electronic Company Ppt Gallery Graphic Tips PDF
This slide shows the percentage of market share graph of electronic company products. It includes mobile phone, laptop, tablet, computer and others devices. Pitch your topic with ease and precision using this Product Market Share Chart Of Electronic Company Ppt Gallery Graphic Tips PDF. This layout presents information on Mobile Phone, Computer, Laptop, Tablet. It is also available for immediate download and adjustment. So, changes can be made in the color, design, graphics or any other component to create a unique layout.
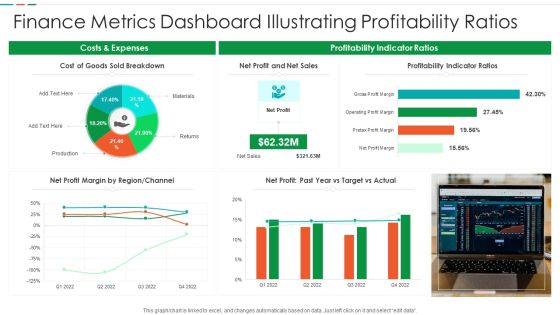
Finance Metrics Dashboard Illustrating Profitability Ratios Diagrams PDF
This graph or chart is linked to excel, and changes automatically based on data. Just left click on it and select edit data. Pitch your topic with ease and precision using this Finance Metrics Dashboard Illustrating Profitability Ratios Diagrams PDF. This layout presents information on Cost Goods Sold, Net Profit Net, Sales Profitability Indicator. It is also available for immediate download and adjustment. So, changes can be made in the color, design, graphics or any other component to create a unique layout.

Finance Metrics Dashboard Indicating Portfolio Performance Microsoft PDF
This graph or chart is linked to excel, and changes automatically based on data. Just left click on it and select edit data. Pitch your topic with ease and precision using this Finance Metrics Dashboard Indicating Portfolio Performance Microsoft PDF. This layout presents information on Portfolio Performance Portfolio, Asset Management Manager, Top 10 Assets. It is also available for immediate download and adjustment. So, changes can be made in the color, design, graphics or any other component to create a unique layout.

Finance Metrics Dashboard Indicating Short Term Assets Download PDF
This graph or chart is linked to excel, and changes automatically based on data. Just left click on it and select edit data. Pitch your topic with ease and precision using this Finance Metrics Dashboard Indicating Short Term Assets Download PDF. This layout presents information on Short Term Assets, Global Financial Performance, Revenue YTD 2022. It is also available for immediate download and adjustment. So, changes can be made in the color, design, graphics or any other component to create a unique layout.
Cash Performance Highlights With Turnover Rate Ppt Ideas Icon PDF
This graph or chart is linked to excel, and changes automatically based on data. Just left click on it and select Edit Data. Pitch your topic with ease and precision using this Cash Performance Highlights With Turnover Rate Ppt Ideas Icon PDF. This layout presents information on Working Capital, Cash Balance, Current Ratio. It is also available for immediate download and adjustment. So, changes can be made in the color, design, graphics or any other component to create a unique layout.

Financial Performance Highlights With Net Profit Margin Ppt Model Ideas PDF
This graph or chart is linked to excel, and changes automatically based on data. Just left click on it and select Edit Data. Pitch your topic with ease and precision using this Financial Performance Highlights With Net Profit Margin Ppt Model Ideas PDF. This layout presents information on Net Profit, Accounts Receivable, Accounts Payable. It is also available for immediate download and adjustment. So, changes can be made in the color, design, graphics or any other component to create a unique layout.

Weekly Sales Performance Highlights With Product Share Ppt File Information PDF
This graph or chart is linked to excel, and changes automatically based on data. Just left click on it and select Edit Data. Pitch your topic with ease and precision using this Weekly Sales Performance Highlights With Product Share Ppt File Information PDF. This layout presents information on Dashboard Summary, Weekly Sale, Product Share. It is also available for immediate download and adjustment. So, changes can be made in the color, design, graphics or any other component to create a unique layout.

Client Helpline Dashboard Performance Key Metrics Ppt Outline Deck PDF
This graph or chart is linked to excel, and changes automatically based on data. Just left click on it and select Edit Data. Pitch your topic with ease and precision using this Client Helpline Dashboard Performance Key Metrics Ppt Outline Deck PDF. This layout presents information on Key Metrics, Trend, Compare. It is also available for immediate download and adjustment. So, changes can be made in the color, design, graphics or any other component to create a unique layout.

Client Helpline Dashboard With Ticket Resolution Ppt Model Graphics Design PDF
This graph or chart is linked to excel, and changes automatically based on data. Just left click on it and select Edit Data. Pitch your topic with ease and precision using this Client Helpline Dashboard With Ticket Resolution Ppt Model Graphics Design PDF. This layout presents information on Ticket Due Times, Sourcewise Tickets, Open Tickets. It is also available for immediate download and adjustment. So, changes can be made in the color, design, graphics or any other component to create a unique layout.
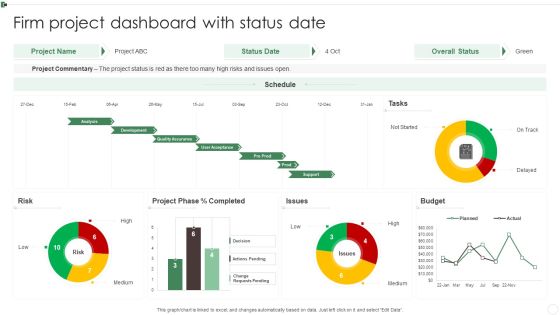
Firm Project Dashboard With Status Date Ppt Infographics Slides PDF
This graph or chart is linked to excel, and changes automatically based on data. Just left click on it and select Edit Data. Pitch your topic with ease and precision using this Firm Project Dashboard With Status Date Ppt Infographics Slides PDF. This layout presents information on Project Commentary, Budget, Project Phase, Risk. It is also available for immediate download and adjustment. So, changes can be made in the color, design, graphics or any other component to create a unique layout.
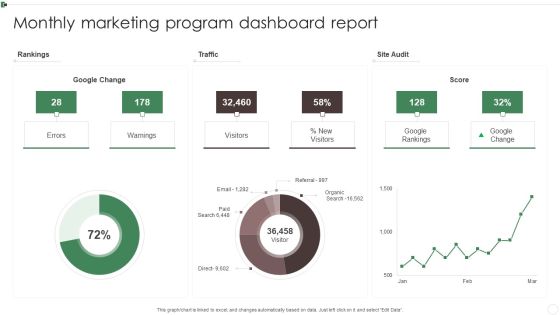
Monthly Marketing Program Dashboard Report Ppt Inspiration Information PDF
This graph or chart is linked to excel, and changes automatically based on data. Just left click on it and select Edit Data. Pitch your topic with ease and precision using this Monthly Marketing Program Dashboard Report Ppt Inspiration Information PDF. This layout presents information on Rankings, Traffic, Site Audit, Warnings. It is also available for immediate download and adjustment. So, changes can be made in the color, design, graphics or any other component to create a unique layout.
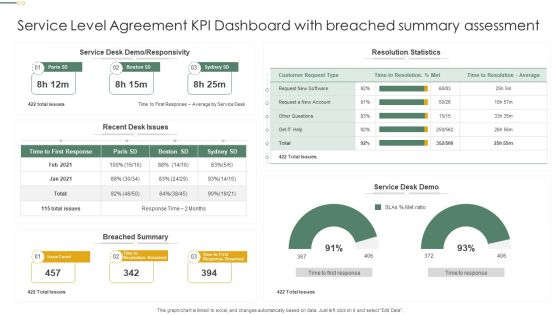
Service Level Agreement KPI Dashboard With Breached Summary Assessment Professional PDF
This graph or chart is linked to excel, and changes automatically based on data. Just left click on it and select Edit Data. Pitch your topic with ease and precision using this Service Level Agreement KPI Dashboard With Breached Summary Assessment Professional PDF. This layout presents information on Resolution Statistics, Service Desk Demo, Breached Summary. It is also available for immediate download and adjustment. So, changes can be made in the color, design, graphics or any other component to create a unique layout.
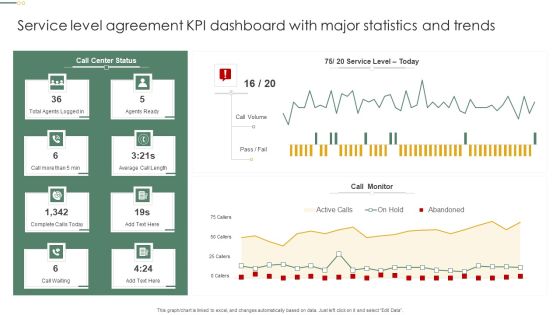
Service Level Agreement KPI Dashboard With Major Statistics And Trends Pictures PDF
This graph or chart is linked to excel, and changes automatically based on data. Just left click on it and select Edit Data. Pitch your topic with ease and precision using this Service Level Agreement KPI Dashboard With Major Statistics And Trends Pictures PDF. This layout presents information on Call Monitor, Call Volume, Agents Ready. It is also available for immediate download and adjustment. So, changes can be made in the color, design, graphics or any other component to create a unique layout.
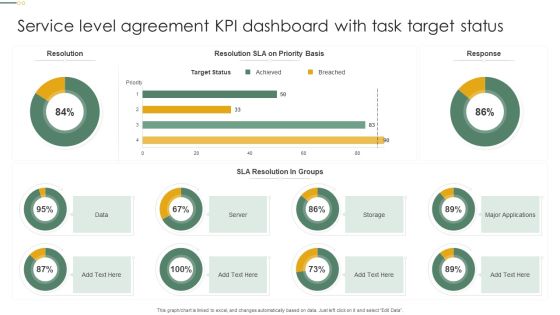
Service Level Agreement KPI Dashboard With Task Target Status Microsoft PDF
This graph or chart is linked to excel, and changes automatically based on data. Just left click on it and select Edit Data. Pitch your topic with ease and precision using this Service Level Agreement KPI Dashboard With Task Target Status Microsoft PDF. This layout presents information on Target Status, Sla Resolution, Groups, Server. It is also available for immediate download and adjustment. So, changes can be made in the color, design, graphics or any other component to create a unique layout.
 Home
Home