Bar Graph

Multi Channel Marketing Strategy Dashboard Slides PDF
This slide showcases marketing channels instrument board. The purpose of this template is evaluate progress and improve decision making. It includes elements such as marketing channel type digital marketing, free marketing, paid marketing and traditional marketing, main KPIS, click revenue. Pitch your topic with ease and precision using this Multi Channel Marketing Strategy Dashboard Slides PDF. This layout presents information on Bounce Rate, Conversion Rate, Marketing Channel Type. It is also available for immediate download and adjustment. So, changes can be made in the color, design, graphics or any other component to create a unique layout.

Customer Satisfaction Data Insights Dashboard Ideas PDF
The following slide highlights the key metrics of the customer satisfaction survey conducted to measure and enhance the user experience. It includes satisfaction, recommendation rate, customers professional background and reviews. Showcasing this set of slides titled Customer Satisfaction Data Insights Dashboard Ideas PDF. The topics addressed in these templates are Recommendation Rate, Customer Satisfaction Rate, Customer Professional Background. All the content presented in this PPT design is completely editable. Download it and make adjustments in color, background, font etc. as per your unique business setting.

Effectiveness Of Social Media Data Insights For Marketers Ideas PDF
The following slide depicts the effectiveness of social media insights for marketers. This data analysis helps them to formulate strategies, understand the target audience, evaluate campaign performance, assess ROI etc. Showcasing this set of slides titled Effectiveness Of Social Media Data Insights For Marketers Ideas PDF. The topics addressed in these templates are Effectiveness, Social Media, Marketers. All the content presented in this PPT design is completely editable. Download it and make adjustments in color, background, font etc. as per your unique business setting.

Call Center Metrics And Metrics Dashboard With Tickets Raised Graphics PDF
Mentioned slide outlines a KPI dashboard showcasing the call center performance. The metrics covered in the slide are total dropped calls, waiting calls, total calls, team performance, recurring calls, tickets raised. Showcasing this set of slides titled Call Center Metrics And Metrics Dashboard With Tickets Raised Graphics PDF. The topics addressed in these templates are Call Management Data, Monthly Statics, Performance Records. All the content presented in this PPT design is completely editable. Download it and make adjustments in color, background, font etc. as per your unique business setting.

Call Center Metrics Dashboard With Average Response Time Inspiration PDF
Mentioned slide outlines KPI dashboard which can be used by call center to measure the performance of their agents. The key metrics highlighted in the dashboard are first call resolution, daily abandonment rate, total number of calls by topic, top performing call agents etc. Showcasing this set of slides titled Call Center Metrics Dashboard With Average Response Time Inspiration PDF. The topics addressed in these templates are Efficiency, Quality, Activity, Daily Average Response, Daily Average Transfer. All the content presented in this PPT design is completely editable. Download it and make adjustments in color, background, font etc. as per your unique business setting.

Call Center Metrics Dashboard With Customer Satisfaction Score Ideas PDF
Mentioned slide outlines a comprehensive call center KPI dashboard which can be used for those customers who are seeking technical support. It provides detailed information about metrics such as ticket status, ticket by channels and type, overall customer satisfaction score, etc. Showcasing this set of slides titled Call Center Metrics Dashboard With Customer Satisfaction Score Ideas PDF. The topics addressed in these templates are Customer Satisfaction, Score Ticket Status, Satisfaction Score. All the content presented in this PPT design is completely editable. Download it and make adjustments in color, background, font etc. as per your unique business setting.

Call Center Metrics Dashboard With Key Metrics Information PDF
Mentioned slide outlines various call center KPIs dashboard. Call resolution in the current and previous month, agents schedule adherence today, currently active and waiting calls are some of the key metrics mentioned in the slide. Showcasing this set of slides titled Call Center Metrics Dashboard With Key Metrics Information PDF. The topics addressed in these templates are Currently Active, Call Resolution, Key Metrics. All the content presented in this PPT design is completely editable. Download it and make adjustments in color, background, font etc. as per your unique business setting.

Metrics Dashboard Depicting Call Center Performance Pictures PDF
Mentioned slide outlines key performance indicator KPI dashboard which can be used by call center to optimize the agents performance. The major metrics covered in the template are total calls, average speed of answer, abandon rate, service level agreement SLA limit etc. Pitch your topic with ease and precision using this Metrics Dashboard Depicting Call Center Performance Pictures PDF. This layout presents information on Overall Satisfaction Score, Satisfaction Score, Performance. It is also available for immediate download and adjustment. So, changes can be made in the color, design, graphics or any other component to create a unique layout.

Metrics Dashboard To Measure Call Center Success Themes PDF
Mentioned slide outlines a comprehensive KPI dashboard used to measure the call center performance. The dashboard monitors the status of key metrics such as call abandonment levels, current service level, average call length, total calls attended, calls waiting etc. Showcasing this set of slides titled Metrics Dashboard To Measure Call Center Success Themes PDF. The topics addressed in these templates are Center Success, Call Center Status, Call Monitor. All the content presented in this PPT design is completely editable. Download it and make adjustments in color, background, font etc. as per your unique business setting.

Business Survey Analysis Dashboard Based On Demographics Data Microsoft PDF
The purpose of this template is to explain the analysis of business survey conduct based on demographics. The slide provides information about support team, respondents and product preference. Pitch your topic with ease and precision using this Business Survey Analysis Dashboard Based On Demographics Data Microsoft PDF. This layout presents information on Support, Team Performance, Product Preference It is also available for immediate download and adjustment. So, changes can be made in the color, design, graphics or any other component to create a unique layout.
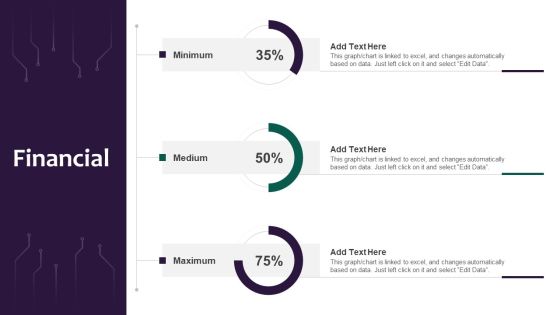
Information Systems Security And Risk Management Plan Financial Professional PDF
Crafting an eye catching presentation has never been more straightforward. Let your presentation shine with this tasteful yet straightforward Information Systems Security And Risk Management Plan Financial Professional PDF template. It offers a minimalistic and classy look that is great for making a statement. The colors have been employed intelligently to add a bit of playfulness while still remaining professional. Construct the ideal Information Systems Security And Risk Management Plan Financial Professional PDF that effortlessly grabs the attention of your audience Begin now and be certain to wow your customers.

Operations Status Report To Analyze Sales Performance Portrait PDF
Following slide outlines operational status report which can be used to measure the companys sales performance in different years. The report covers information about expenses and sales in different regions, sales volume trend, operational effectiveness by different industries, etc. Showcasing this set of slides titled Operations Status Report To Analyze Sales Performance Portrait PDF. The topics addressed in these templates are Operations Status Report, Analyze Sales Performance. All the content presented in this PPT design is completely editable. Download it and make adjustments in color, background, font etc. as per your unique business setting.
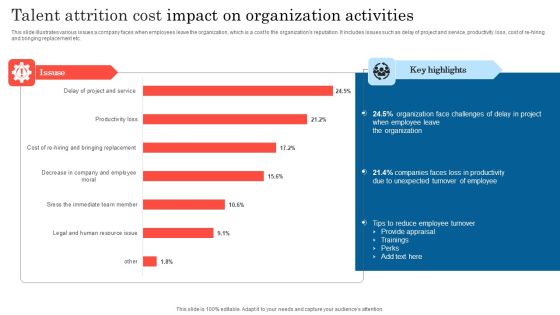
Talent Attrition Cost Impact On Organization Activities Ideas PDF
This slide illustrates various issues a company faces when employees leave the organization, which is a cost to the organizations reputation. It includes issues such as delay of project and service, productivity loss, cost of re-hiring and bringing replacement etc. Showcasing this set of slides titled Talent Attrition Cost Impact On Organization Activities Ideas PDF. The topics addressed in these templates are Organization, Employee Leave, Productivity. All the content presented in this PPT design is completely editable. Download it and make adjustments in color, background, font etc. as per your unique business setting.

Analysis Plan For E Commerce Promotion Tactics Competitive Landscape With Social Media Audit Findings Summary PDF
This slide presents the findings of the social media audit in context of competitor analysis. It includes information regarding the social media followers count, monthly content posting activity along with the details of content sharing on digital channels such as Facebook, Instagram, and Twitter. Crafting an eye catching presentation has never been more straightforward. Let your presentation shine with this tasteful yet straightforward Analysis Plan For E Commerce Promotion Tactics Competitive Landscape With Social Media Audit Findings Summary PDF template. It offers a minimalistic and classy look that is great for making a statement. The colors have been employed intelligently to add a bit of playfulness while still remaining professional. Construct the ideal Analysis Plan For E Commerce Promotion Tactics Competitive Landscape With Social Media Audit Findings Summary PDF that effortlessly grabs the attention of your audience Begin now and be certain to wow your customers.

Analysis Plan For E Commerce Promotion Tactics Content Performance Tracking Dashboard For Social Media Channels Icons PDF
This slide indicates the content performance tracking dashboard for social media channels providing information regarding the total number of posts, engagement rate, audience sentiments and multiple hashtags performance. Formulating a presentation can take up a lot of effort and time, so the content and message should always be the primary focus. The visuals of the PowerPoint can enhance the presenters message, so our Analysis Plan For E Commerce Promotion Tactics Content Performance Tracking Dashboard For Social Media Channels Icons PDF was created to help save time. Instead of worrying about the design, the presenter can concentrate on the message while our designers work on creating the ideal templates for whatever situation is needed. Slidegeeks has experts for everything from amazing designs to valuable content, we have put everything into Analysis Plan For E Commerce Promotion Tactics Content Performance Tracking Dashboard For Social Media Channels Icons PDF

Analysis Plan For E Commerce Promotion Tactics Dashboard To Assess Social Posts Content Quality Sample PDF
This slide indicates the Dashboard to Assess Social Posts Content Quality. It provides information regarding the top published articles, story turnaround time, average number of comments per article and digital subscribers gained. This modern and well arranged Analysis Plan For E Commerce Promotion Tactics Dashboard To Assess Social Posts Content Quality Sample PDF provides lots of creative possibilities. It is very simple to customize and edit with the Powerpoint Software. Just drag and drop your pictures into the shapes. All facets of this template can be edited with Powerpoint no extra software is necessary. Add your own material, put your images in the places assigned for them, adjust the colors, and then you can show your slides to the world, with an animated slide included.

Analysis Plan For E Commerce Promotion Tactics Dashboard To Track Cross Channel Social Media Performance Demonstration PDF
This slide depicts the dashboard to track cross channel social media performance providing information regarding the multiple KPIs such as social engagement, applause rate, conversation rate. It also includes details of average ROI from multiple social media channels such as Twitter, Facebook, Instagram etc. This Analysis Plan For E Commerce Promotion Tactics Dashboard To Track Cross Channel Social Media Performance Demonstration PDF is perfect for any presentation, be it in front of clients or colleagues. It is a versatile and stylish solution for organizing your meetings. The Analysis Plan For E Commerce Promotion Tactics Dashboard To Track Cross Channel Social Media Performance Demonstration PDF features a modern design for your presentation meetings. The adjustable and customizable slides provide unlimited possibilities for acing up your presentation. Slidegeeks has done all the homework before launching the product for you. So, do not wait, grab the presentation templates today.

Analysis Plan For E Commerce Promotion Tactics Spend And Return On Investment Of Deployed Social Media Channels Mockup PDF
This slide graphically illustrate the spend and ROI performance of deployed social media channels. It also provides the information regarding the number of lead generated from each channel such as Twitter, Facebook, Instagram. Are you searching for a Analysis Plan For E Commerce Promotion Tactics Spend And Return On Investment Of Deployed Social Media Channels Mockup PDF that is uncluttered, straightforward, and original Its easy to edit, and you can change the colors to suit your personal or business branding. For a presentation that expresses how much effort you have put in, this template is ideal With all of its features, including tables, diagrams, statistics, and lists, its perfect for a business plan presentation. Make your ideas more appealing with these professional slides. Download Analysis Plan For E Commerce Promotion Tactics Spend And Return On Investment Of Deployed Social Media Channels Mockup PDF from Slidegeeks today.
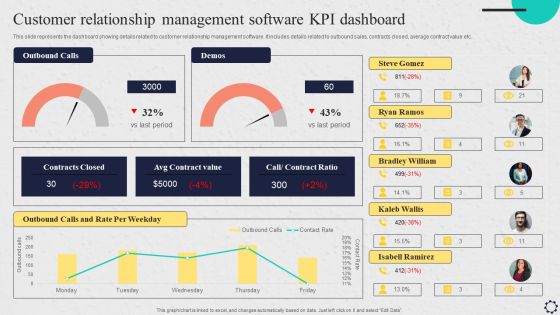
Software Implementation Strategy Customer Relationship Management Software Kpi Dashboard Clipart PDF
This slide represents the dashboard showing details related to customer relationship management software. It includes details related to outbound sales, contracts closed, average contract value etc. Are you in need of a template that can accommodate all of your creative concepts This one is crafted professionally and can be altered to fit any style. Use it with Google Slides or PowerPoint. Include striking photographs, symbols, depictions, and other visuals. Fill, move around, or remove text boxes as desired. Test out color palettes and font mixtures. Edit and save your work, or work with colleagues. Download Software Implementation Strategy Customer Relationship Management Software Kpi Dashboard Clipart PDF and observe how to make your presentation outstanding. Give an impeccable presentation to your group and make your presentation unforgettable.

Software Implementation Strategy Release Burndown Report To Measure Software Implementation Project Progress Introduction PDF
This slide represents the team progress towards the release date by plotting the remaining effort against the ideal effort. It includes details related to use cases of release burndown report. Formulating a presentation can take up a lot of effort and time, so the content and message should always be the primary focus. The visuals of the PowerPoint can enhance the presenters message, so our Software Implementation Strategy Release Burndown Report To Measure Software Implementation Project Progress Introduction PDF was created to help save time. Instead of worrying about the design, the presenter can concentrate on the message while our designers work on creating the ideal templates for whatever situation is needed. Slidegeeks has experts for everything from amazing designs to valuable content, we have put everything into Software Implementation Strategy Release Burndown Report To Measure Software Implementation Project Progress Introduction PDF

Implementing Client Onboarding Process Consumer Adoption Challenges Faced By Organization Graphics PDF
This slide provides glimpse about problems faced by our organization that can provide metrics to target and develop strategies to increase our customer base. It includes issues such as customer churn rate, customer adoption rate, etc. Slidegeeks is here to make your presentations a breeze with Implementing Client Onboarding Process Consumer Adoption Challenges Faced By Organization Graphics PDF With our easy to use and customizable templates, you can focus on delivering your ideas rather than worrying about formatting. With a variety of designs to choose from, you are sure to find one that suits your needs. And with animations and unique photos, illustrations, and fonts, you can make your presentation pop. So whether you are giving a sales pitch or presenting to the board, make sure to check out Slidegeeks first.

Digital Transition Plan For Managing Business Dashboard Depicting Kpis To Track Sales Performance Guidelines PDF
This slide covers the dashboard that depicts metrics to track company sales performance that focuses on number of sales, cost breakdown, accumulated revenues, incremental sales, etc. Are you in need of a template that can accommodate all of your creative concepts This one is crafted professionally and can be altered to fit any style. Use it with Google Slides or PowerPoint. Include striking photographs, symbols, depictions, and other visuals. Fill, move around, or remove text boxes as desired. Test out color palettes and font mixtures. Edit and save your work, or work with colleagues. Download Digital Transition Plan For Managing Business Dashboard Depicting Kpis To Track Sales Performance Guidelines PDF and observe how to make your presentation outstanding. Give an impeccable presentation to your group and make your presentation unforgettable.

Digital Transition Plan For Managing Business Measuring Effectiveness Of Digital Transformation Portrait PDF
This slide focuses on dashboard that will help company to measure effectiveness of digital transformation which includes active customers, units sold, total revenues, net profit, etc. Formulating a presentation can take up a lot of effort and time, so the content and message should always be the primary focus. The visuals of the PowerPoint can enhance the presenters message, so our Digital Transition Plan For Managing Business Measuring Effectiveness Of Digital Transformation Portrait PDF was created to help save time. Instead of worrying about the design, the presenter can concentrate on the message while our designers work on creating the ideal templates for whatever situation is needed. Slidegeeks has experts for everything from amazing designs to valuable content, we have put everything into Digital Transition Plan For Managing Business Measuring Effectiveness Of Digital Transformation Portrait PDF
Ppt Moving Down Arrow Circles PowerPoint Templates
PPT moving down arrow circles PowerPoint Templates-Use this diagram for improved controls to drive your business towards the right direction. Constant monitoring of the processes provides you with opportunities to concentrate on the core competencies in your business and improve the standards for more effective results.-PPT moving down arrow circles PowerPoint Templates-Add, Aqua, Arrows, Badges, Bar, Blend, Blue, Bright, Bubbles, Buttons, Caution, Circle, Drop, Elements, Glossy, Glowing, Graphic, Heart, Help, Icons, Idea, Illustration, Navigation, Oblong, Plus, Round, Service, Shadow, Shiny, Sign, Speech, Squares
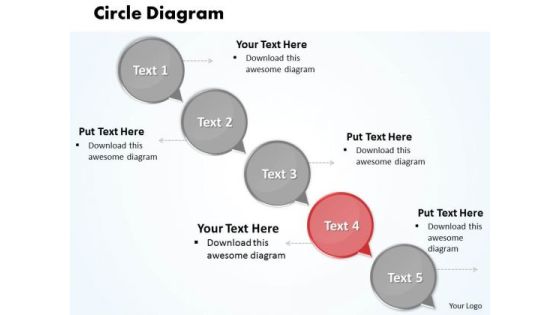
Ppt Circular Arrow Network Diagram PowerPoint Template Of 5 Steps Templates
PPT circular arrow network diagram powerpoint template of 5 steps Templates-This PowerPoint Diagram shows you the continuous flow of Business Process using Colorful circular arrows attached to each other. It consists of five stages describing five different topics.-PPT circular arrow network diagram powerpoint template of 5 steps Templates-Add, Aqua, Arrows, Badges, Bar, Blend, Blue, Bright, Bubbles, Buttons, Caution, Circle, Drop, Elements, Glossy, Glowing, Graphic, Heart, Help, Icons, Idea, Illustration, Navigation, Oblong, Plus, Round, Service, Shadow, Shiny, Sign, Speech, Squares
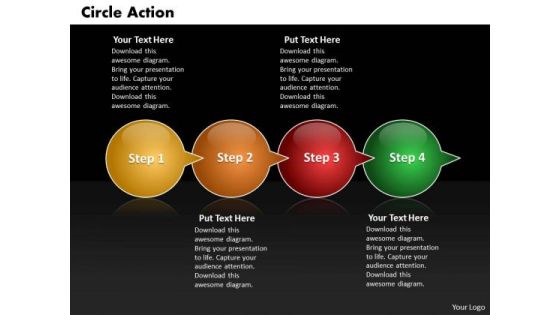
Ppt Circle Action Through Bubbles 4 PowerPoint Slide Numbers Templates
PPT circle action through bubbles 4 powerpoint slide numbers Templates-Use this multicolored Bubbles PPT Slide to explain a formal business process. Process operations are represented by circle, and arrows connecting them represent flow of control.-PPT circle action through bubbles 4 powerpoint slide numbers Templates-Add, Aqua, Arrows, Badges, Bar, Blend, Blue, Bright, Bubbles, Buttons, Caution, Circle, Drop, Elements, Glossy, Glowing, Graphic, Heart, Help, Icons, Idea, Illustration, Navigation, Oblong, Plus, Round, Service, Shadow, Shiny, Sign, Speech, Squares
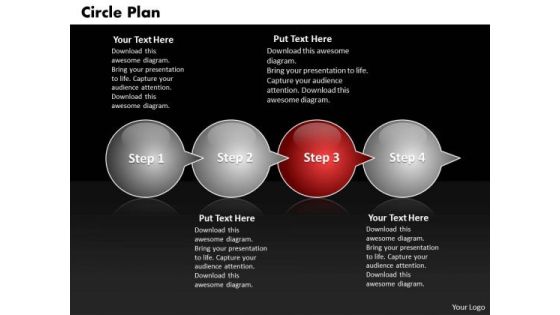
Ppt Circle PowerPoint Presentation Plan Through Bubbles 4 Steps Templates
PPT circle powerpoint presentation plan through bubbles 4 steps Templates-Use this highlighted red Bubble Slide to explain a third step in business process. Process operations are represented by circle, and arrows connecting them represent flow of control.-PPT circle powerpoint presentation plan through bubbles 4 steps Templates-Add, Aqua, Arrows, Badges, Bar, Blend, Blue, Bright, Bubbles, Buttons, Caution, Circle, Drop, Elements, Glossy, Glowing, Graphic, Heart, Help, Icons, Idea, Illustration, Navigation, Oblong, Plus, Round, Service, Shadow, Shiny, Sign, Speech, Squares

Ppt Circular Arrow Layout Of 5 Steps PowerPoint Templates
PPT circular arrow layout of 5 steps PowerPoint Templates-Use this circular arrow speech bubbles diagram to show a series of events or timeline information. This circular arrow description diagram make your audience understand, essential elements of your overall strategy of business deal. -PPT circular arrow layout of 5 steps PowerPoint Templates-Add, Aqua, Arrows, Badges, Bar, Blend, Blue, Bright, Bubbles, Buttons, Caution, Circle, Drop, Elements, Glossy, Glowing, Graphic, Heart, Help, Icons, Idea, Illustration, Navigation, Oblong, Plus, Round, Service, Shadow, Shiny, Sign, Speech, Squares
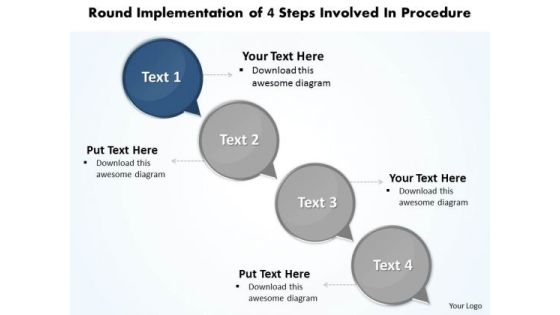
Ppt Exercise Of 4 Steps Involved Procedure PowerPoint Templates
PPT exercise of 4 steps involved procedure PowerPoint Templates-To display a structured combination of statements and achievements. This premium quality set of slanting Text Arrows for Microsoft PowerPoint describes the perfect tool. It consists of four stages explaining four concepts.-PPT exercise of 4 steps involved procedure PowerPoint Templates-Add, Aqua, Arrows, Badges, Bar, Blend, Blue, Bright, Bubbles, Buttons, Caution, Circle, Drop, Elements, Glossy, Glowing, Graphic, Heart, Help, Icons, Idea, Illustration, Navigation, Oblong, Plus, Round, Service, Shadow, Shiny, Sign, Speech, Squares

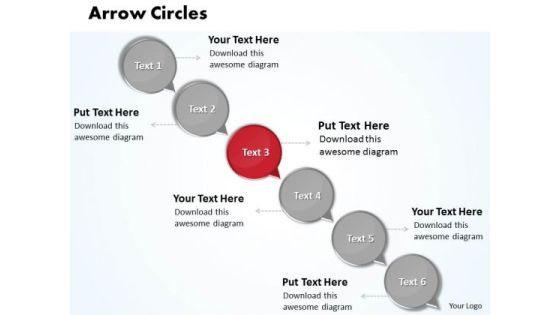
Ppt Downward Arrow Circles 6 Stages PowerPoint Templates
PPT downward arrow circles 6 stages PowerPoint Templates-This diagram can be used to show a series of events or timeline information. Our unique image makes your presentations inviting, friendly, simpler, professional showing that you care about even the smallest details.-PPT downward arrow circles 6 stages PowerPoint Templates-Add, Aqua, Arrows, Badges, Bar, Blend, Blue, Bright, Bubbles, Buttons, Caution, Circle, Drop, Elements, Glossy, Glowing, Graphic, Heart, Help, Icons, Idea, Illustration, Navigation, Oblong, Plus, Round, Service, Shadow, Shiny, Sign, Speech, Squares
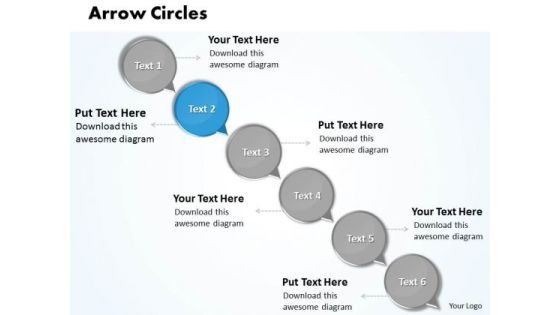
Ppt Descending Circles Lotus Connections With Arrow 6 Steps PowerPoint Templates
PPT descending circles lotus connections with arrow 6 steps PowerPoint Templates-Our compelling template consists of design of text circles connected with arrows in descending order. Forward thinking is the way to go. Use this template to emphasize your views.-PPT descending circles lotus connections with arrow 6 steps PowerPoint Templates-Add, Aqua, Arrows, Badges, Bar, Blend, Blue, Bright, Bubbles, Buttons, Caution, Circle, Drop, Elements, Glossy, Glowing, Graphic, Heart, Help, Icons, Idea, Illustration, Navigation, Oblong, Plus, Round, Service, Shadow, Shiny, Sign, Speech, Squares

Ppt Consecutive Illustration Of 5 PowerPoint Slide Numbers Through Arrows 1 Templates
PPT consecutive illustration of 5 powerpoint slide numbers through arrows 1 Templates-This PowerPoint Diagram represents controls and mechanisms. Use it to illustrate a stepwise process or a phase structure.-PPT consecutive illustration of 5 powerpoint slide numbers through arrows 1 Templates-Add, Aqua, Arrows, Badges, Bar, Blend, Blue, Bright, Bubbles, Buttons, Caution, Circle, Drop, Elements, Glossy, Glowing, Graphic, Heart, Help, Icons, Idea, Illustration, Navigation, Oblong, Plus, Round, Service, Shadow, Shiny, Sign, Speech, Squares

Ppt Circle Process Through Bubbles 4 Steps Working With Slide Numbers PowerPoint Templates
PPT circle process through bubbles 4 steps working with slide numbers PowerPoint Templates-Use this highlighted green Bubble Slide to explain a third step in business process. Process operations are represented by circle, and arrows connecting them represent flow of control.-PPT circle process through bubbles 4 steps working with slide numbers PowerPoint Templates-Add, Aqua, Arrows, Badges, Bar, Blend, Blue, Bright, Bubbles, Buttons, Caution, Circle, Drop, Elements, Glossy, Glowing, Graphic, Heart, Help, Icons, Idea, Illustration, Navigation, Oblong, Plus, Round, Service, Shadow, Shiny, Sign, Speech, Squares

Ppt Circular Arrow PowerPoint Design Download Of 5 Slide Numbers Templates
PPT circular arrow powerpoint design download of 5 slide numbers Templates-This PowerPoint Diagram will let you explain the five basic concepts of Corporate world. This PowerPoint diagram can be used for business process automation and other business related issues.-PPT circular arrow powerpoint design download of 5 slide numbers Templates-Add, Aqua, Arrows, Badges, Bar, Blend, Blue, Bright, Bubbles, Buttons, Caution, Circle, Drop, Elements, Glossy, Glowing, Graphic, Heart, Help, Icons, Idea, Illustration, Navigation, Oblong, Plus, Round, Service, Shadow, Shiny, Sign, Speech, Squares

Ppt Circular Arrow Structure Of 5 Practice The PowerPoint Macro Steps Templates
PPT circular arrow structure of 5 practice the powerpoint macro steps Templates-Use this highlighted Red Bubble Slide to explain a third step in business process. Process operations are represented by circle, and arrows connecting them represent flow of control.-PPT circular arrow structure of 5 practice the powerpoint macro steps Templates-Add, Aqua, Arrows, Badges, Bar, Blend, Blue, Bright, Bubbles, Buttons, Caution, Circle, Drop, Elements, Glossy, Glowing, Graphic, Heart, Help, Icons, Idea, Illustration, Navigation, Oblong, Plus, Round, Service, Shadow, Shiny, Sign, Speech, Squares

Ppt Round Arrow Speech Bubbles 2 Power Point Stage PowerPoint Templates
PPT round arrow speech bubbles 2 power point stage PowerPoint Templates-Use this PowerPoint Diagram to elaborate the Round Implementation through speech bubbles. This Diagram portrays the concepts of arrows pointing, circled, activity, analysis, arrows, business, medical, science, health and shapes.-PPT round arrow speech bubbles 2 power point stage PowerPoint Templates-Add, Aqua, Arrows, Badges, Bar, Blend, Blue, Bright, Bubbles, Buttons, Caution, Circle, Drop, Elements, Glossy, Glowing, Graphic, Heart, Help, Icons, Idea, Illustration, Navigation, Oblong, Plus, Round, Service, Shadow, Shiny, Sign, Speech, Squares
Business Diagram Concepts Of Business With Icons Diagram PowerPoint Ppt Presentation
This business diagram displays 3d pie chart. It contains graphics of pie chart for business planning. This pie chart is a visual way of displaying data. Use this diagram to make outstanding presentations.
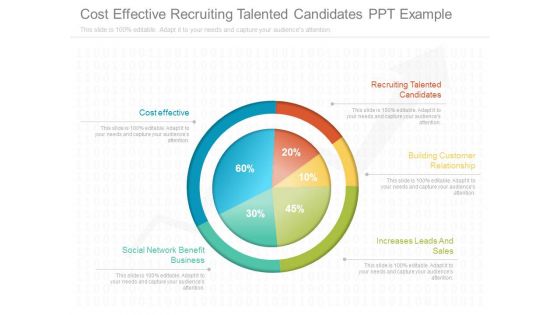
Cost Effective Recruiting Talented Candidates Ppt Example
This is a cost effective recruiting talented candidates ppt example. This is a five stage process. The stages in this process are circle chart, business, finance.

Analytics Pervasive Business Intelligence Ppt Slides
This is a analytics pervasive business intelligence ppt slides. This is a six stage process. The stages in this process are circle charts, business, marketing.

Customer Interview Central Repository Ppt Slides
This is a customer interview central repository ppt slides. This is a four stage process. The stages in this process are business, circle chart.

Six Sigma Road Map Ppt Slides
This is a six sigma road map ppt slides. This is a six stage process. The stages in this process are business, marketing, circle charts

Prospecting And Site Selection Land Procurement Ppt Slides
This is a prospecting and site selection land procurement ppt slides. This is a eight stage process. The stages in this process are business, circle charts.
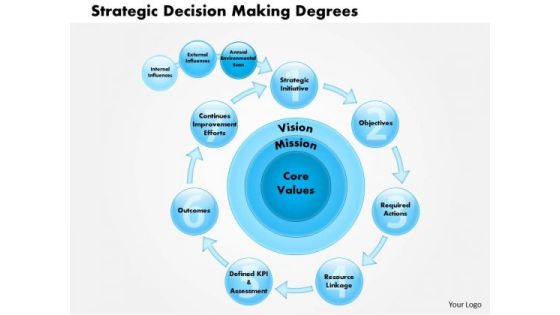
Business Framework Strategic Decision Making Degrees PowerPoint Presentation
This business framework has been designed with graphic of multistage process flow diagram. This business framework is useful for strategic decision chart. This chart is useful for displaying degrees of core values for making strategic decisions. Use this PPT diagram for business and marketing presentations.
Business Diagram 3d Icons Of Business Process Diagram PowerPoint Ppt Presentation
This diagram displays 3d icons of business process. It contains pie chart with 3d human icons. Use this diagram to depict partnership ratios in business firm. Make an amazing presentation with this diagram.

Business Framework Consultative Sales Model PowerPoint Presentation
Two directional multistage triangles are used to show process flow in any presentation. This PPt slide contain the concept of work effort. This PPT slide contains the work efforts matrix chart for client work efforts. Use this PPt and build exclusive presentation for consultant and client work effort model for your business presentation.

Business Framework The Generic Strategies PowerPoint Presentation
This slide depicts framework of generic strategies. It contains diagram of porters generic strategies depicting competitive advantage and competitive scope. Download this diagram as a tool for business presentations.
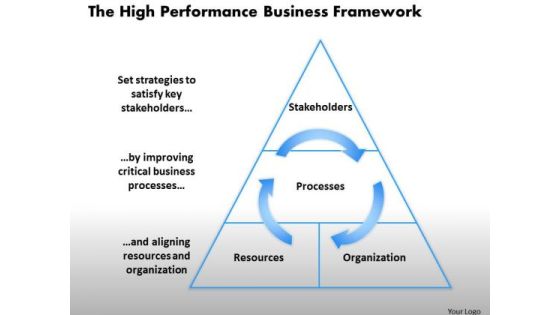
Business Framework The High Performance Business Framework 1 PowerPoint Presentation
This slide exhibits framework of high performance business. It contains pyramid diagram with circular arrows depicting strategies to satisfy key stakeholder by improving critical business processes and aligning resources and organization.

Business Framework The Loyalty Ladder PowerPoint Presentation
This diagram exhibits framework of loyalty ladder. It contains graphics of increasing loyalty ladder depicting terms of advocate, supporter, client, customer and prospect. Use this professional and customized business diagram in your PowerPoint presentations.

Business Diagram 3d Green Energy Diagram Tabs PowerPoint Ppt Presentation
This slide has been designed with 3d green energy diagram tabs. Use this diagram to define steps of business process. Make amazing presentations with this diagram.
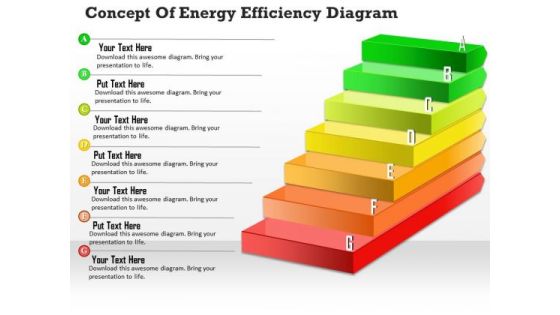
Business Diagram Concept Of Energy Efficiency Diagram PowerPoint Ppt Presentation
This slide displays colorful steps in alphabetic order. It contains stairs diagram. Use this diagram to define steps of business process. Make amazing presentations with this diagram.

Business Diagram Concept Of Green Energy Diagram PowerPoint Ppt Presentation
This slide displays colorful steps in alphabetic order. It contains stairs diagram. Use this diagram to define steps of business process. Make amazing presentations with this diagram.
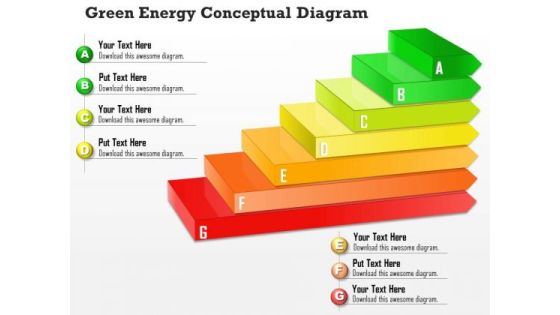
Business Diagram Green Energy Conceptual Diagram PowerPoint Ppt Presentation
This slide displays colorful steps in alphabetic order. It contains stairs diagram. Use this diagram to define steps of business process. Make amazing presentations with this diagram.

Business Framework Cyclical Placement Style For Strategy Map PowerPoint Presentation
A balancing scale style diagram has been used to design this PPT slide. This PPT slide contains the concept of cost benefit analysis. This PPT slide can be used for finance and money related topics in any presentation.

Job Task Analysis Powerpoint Presentation Examples
This is a job task analysis powerpoint presentation examples. This is a three stage process. The stages in this time process are job task analysis, skill gaps, e learning conversion.

Choosing An Area Of Research Powerpoint Slides
This is a choosing an area of research powerpoint slides. This is a five stage process. The stages in this process are choosing an area of research, choosing method of data collection, review of studies, sources of feedback, complete proposal.
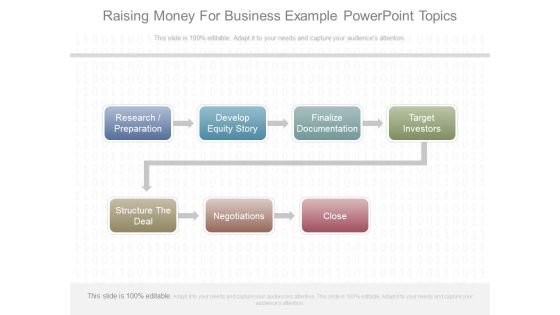
Raising Money For Business Example Powerpoint Topics
This is a raising money for business example powerpoint topics. This is a seven stage process. The stages in this process are research preparation, develop equity story, finalize documentation, target investors, structure the deal, negotiations, close.

Knowledge Asset Management Ppt Presentation
This is a knowledge asset management ppt presentation. This is a five stage process. The stages in this process are demand forecasting, assortment.
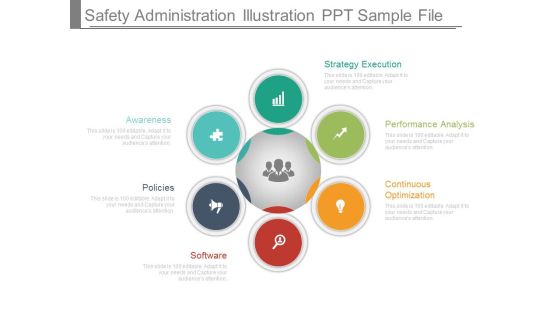
Safety Administration Illustration Ppt Sample File
This is a safety administration illustration ppt sample file. This is a six stage process. The stages in this process are awareness, policies, software, continuous optimization, performance analysis, strategy execution.
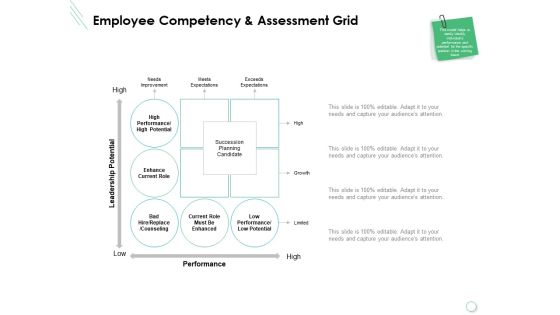
Employee Competency And Assessment Grid Ppt PowerPoint Presentation Themes
Presenting this set of slides with name employee competency and assessment grid ppt powerpoint presentation themes. The topics discussed in these slides are meets expectations, growth, performance, process, planning. This is a completely editable PowerPoint presentation and is available for immediate download. Download now and impress your audience.

Action Priority Matrix With Level Of Difficulty Ppt PowerPoint Presentation Infographics File Formats
Presenting this set of slides with name action priority matrix with level of difficulty ppt powerpoint presentation infographics file formats. The topics discussed in these slides are priority, prioritize, value. This is a completely editable PowerPoint presentation and is available for immediate download. Download now and impress your audience.


 Continue with Email
 Sign up for an account
 Home
Home