AI PPT Maker
Templates
PPT Bundles
Design Services
Business PPTs
Business Plan
Management
Strategy
Introduction PPT
Roadmap
Self Introduction
Timelines
Process
Marketing
Agenda
Technology
Medical
Startup Business Plan
Cyber Security
Dashboards
SWOT
Proposals
Education
Pitch Deck
Digital Marketing
KPIs
Project Management
Product Management
Artificial Intelligence
Target Market
Communication
Supply Chain
Google Slides
Research Services
 One Pagers
All Categories
-
Home
- Customer Favorites
- Bar Graph
Bar Graph

Media Company Quarterly Revenue Projection Dashboard Mockup PDF
This slide depicts estimation and actual revenue generated for a quarter. It also includes top ten customers, revenue by product and entity for media company. Pitch your topic with ease and precision using this Media Company Quarterly Revenue Projection Dashboard Mockup PDF. This layout presents information on Total Revenue, Quarterly Revenue Entity, Top 10 Customers. It is also available for immediate download and adjustment. So, changes can be made in the color, design, graphics or any other component to create a unique layout.
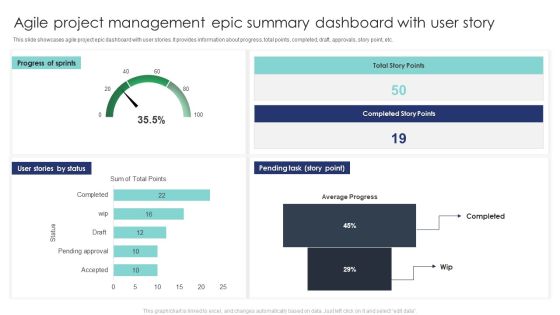
Agile Project Management Epic Summary Dashboard With User Story Formats PDF
This slide showcases agile project epic dashboard with user stories. It provides information about progress, total points, completed, draft, approvals, story point, etc. Pitch your topic with ease and precision using this Agile Project Management Epic Summary Dashboard With User Story Formats PDF. This layout presents information on Pending Tast, Progress Sprints, User Stories Status. It is also available for immediate download and adjustment. So, changes can be made in the color, design, graphics or any other component to create a unique layout.
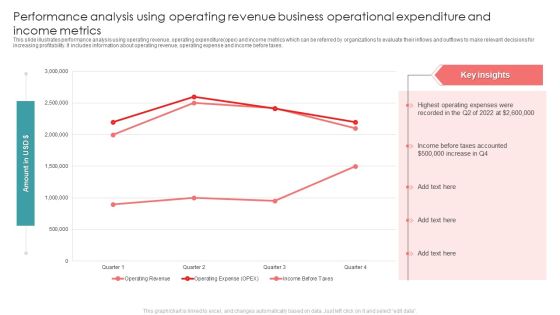
Performance Analysis Using Operating Revenue Business Operational Expenditure And Income Metrics Diagrams PDF
This slide illustrates performance analysis using operating revenue, operating expenditure opex and income metrics which can be referred by organizations to evaluate their inflows and outflows to make relevant decisions for increasing profitability. It includes information about operating revenue, operating expense and income before taxes. Pitch your topic with ease and precision using this Performance Analysis Using Operating Revenue Business Operational Expenditure And Income Metrics Diagrams PDF. This layout presents information on Taxes, Highest Operating, Recorded. It is also available for immediate download and adjustment. So, changes can be made in the color, design, graphics or any other component to create a unique layout.
Statistics Indicating Recurring Business Operational Expenditure In Telecom Operations Icons PDF
This slide shows statistics indicating recurring operating expenditure OPEX in telecom operations which can benefit their executives in evaluating the current expenses and make cost effective amendments for future operations. It includes information about maintenance, repair, network charging and billing, customer support, marketing and operational planning costs. Pitch your topic with ease and precision using this Statistics Indicating Recurring Business Operational Expenditure In Telecom Operations Icons PDF. This layout presents information on Company, Costs, Marketing Costs. It is also available for immediate download and adjustment. So, changes can be made in the color, design, graphics or any other component to create a unique layout.

Business Operational Expenditure Dashboard Indicating Revenue And Costs Metrics Pictures PDF
This slide shows operating expenses OPEX dashboard indicating revenue and costs metrics which can be referred by companies to manage various operating expenses of various departments. It contains information about cost center, revenue per company, company code, etc. Pitch your topic with ease and precision using this Business Operational Expenditure Dashboard Indicating Revenue And Costs Metrics Pictures PDF. This layout presents information on Business Operational, Costs Metrics, Revenue. It is also available for immediate download and adjustment. So, changes can be made in the color, design, graphics or any other component to create a unique layout.

KPI Dashboard Highlighting Results Of Multichannel Retail Marketing Rules PDF
The purpose of this slide is to highlight a comprehensive dashboard of omnichannel retail. The key metrics covered in the slide are types of marketing channels, comparison of channels for two different years, transactions by months etc. Pitch your topic with ease and precision using this KPI Dashboard Highlighting Results Of Multichannel Retail Marketing Rules PDF. This layout presents information on Comparison Of Channel Sales, Percentage Of Sales, Transactions By Month. It is also available for immediate download and adjustment. So, changes can be made in the color, design, graphics or any other component to create a unique layout.

KPI Dashboard To Measure Strategic Monetary Performance Graphics PDF
This slide shows KPI dashboard to measure strategic monetary performance. It includes gross profit margin, opex ratio, operating profit margin, revenue, etc. Pitch your topic with ease and precision using this KPI Dashboard To Measure Strategic Monetary Performance Graphics PDF. This layout presents information on Gross Profit Margin, Opex Ratio, Operating Profit Margin. It is also available for immediate download and adjustment. So, changes can be made in the color, design, graphics or any other component to create a unique layout.

Dashboard To Effectively Track Bitcoin Decentralized Fund Investment Playbook Designs PDF
This Dashboard To Effectively Track Bitcoin Decentralized Fund Investment Playbook Designs PDF from Slidegeeks makes it easy to present information on your topic with precision. It provides customization options, so you can make changes to the colors, design, graphics, or any other component to create a unique layout. It is also available for immediate download, so you can begin using it right away. Slidegeeks has done good research to ensure that you have everything you need to make your presentation stand out. Make a name out there for a brilliant performance.
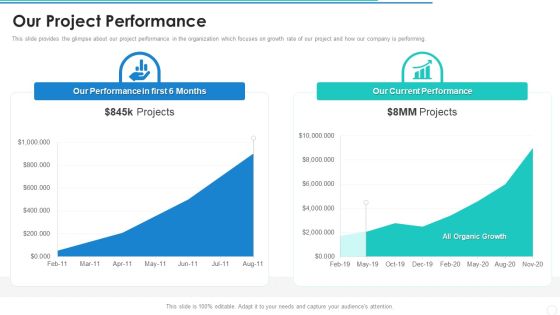
Our Project Performance Firm Pitch Deck Demonstration PDF
Make sure to capture your audiences attention in your business displays with our gratis customizable Our Project Performance Firm Pitch Deck Demonstration PDF. These are great for business strategies, office conferences, capital raising or task suggestions. If you desire to acquire more customers for your tech business and ensure they stay satisfied, create your own sales presentation with these plain slides.
Retail Shop Administration Essential Retail Store Activities Tracking Dashboard Portrait PDF
This slide provides details regarding the dashboard for tracking retail store activities in terms of sales, conversion rate, traffic, average transaction value, recommendations, etc. This Retail Shop Administration Essential Retail Store Activities Tracking Dashboard Portrait PDF from Slidegeeks makes it easy to present information on your topic with precision. It provides customization options, so you can make changes to the colors, design, graphics, or any other component to create a unique layout. It is also available for immediate download, so you can begin using it right away. Slidegeeks has done good research to ensure that you have everything you need to make your presentation stand out. Make a name out there for a brilliant performance.
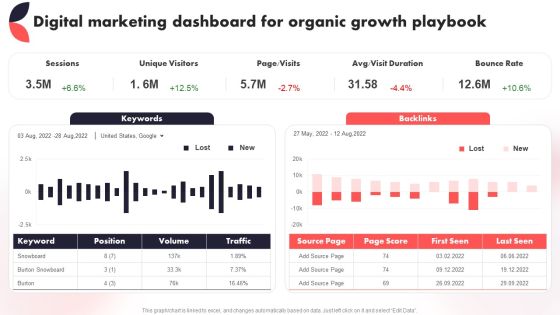
Digital Marketing Dashboard For Organic Growth Playbook Year Over Year Business Success Playbook Themes PDF
This Digital Marketing Dashboard For Organic Growth Playbook Year Over Year Business Success Playbook Themes PDF from Slidegeeks makes it easy to present information on your topic with precision. It provides customization options, so you can make changes to the colors, design, graphics, or any other component to create a unique layout. It is also available for immediate download, so you can begin using it right away. Slidegeeks has done good research to ensure that you have everything you need to make your presentation stand out. Make a name out there for a brilliant performance.

COVID Impact Analysis On Freight And Transportation Sector Ppt Outline Graphics Tutorials PDF
This slide covers impact of COVID-19 on freight, transportation equipment and travel industry. It includes impact on demand, insights on global GDP growth, impact on supply chain, supply bottlenecks, short-term pricing outlook, etc. Pitch your topic with ease and precision using this COVID Impact Analysis On Freight And Transportation Sector Ppt Outline Graphics Tutorials PDF. This layout presents information on Freight And Logistics, Transportation Equipment, Deflationary. It is also available for immediate download and adjustment. So, changes can be made in the color, design, graphics or any other component to create a unique layout.

Agriculture Business Elevator Pitch Deck Addressing Impressive Financial Highlights Of Farming Firm Introduction PDF
This slide caters details about impressive financial highlights of agriculture firm in terms of consolidated turnover, equity, solvency ratio, EBITDA, etc. Make sure to capture your audiences attention in your business displays with our gratis customizable Agriculture Business Elevator Pitch Deck Addressing Impressive Financial Highlights Of Farming Firm Introduction PDF. These are great for business strategies, office conferences, capital raising or task suggestions. If you desire to acquire more customers for your tech business and ensure they stay satisfied, create your own sales presentation with these plain slides.

KPI Dashboard To Measure Performance Of B2B Promotional Communication Strategy Mockup PDF
The following slides outline the key performance indicator dashboard to track performance of B2B marketing communication approach. It covers information about pipeline deals, revenue by campaign, email engagement and landing page completion. Pitch your topic with ease and precision using this KPI Dashboard To Measure Performance Of B2B Promotional Communication Strategy Mockup PDF. This layout presents information on Pipeline Deals, Engagement Health, Email Engagement. It is also available for immediate download and adjustment. So, changes can be made in the color, design, graphics or any other component to create a unique layout.
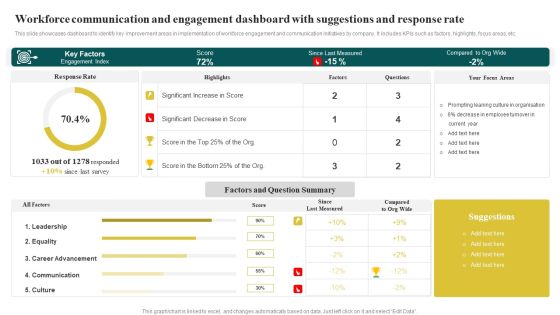
Workforce Communication And Engagement Dashboard With Suggestions And Response Rate Microsoft PDF
This slide showcases dashboard to identify key improvement areas in implementation of workforce engagement and communication initiatives by company. It includes KPIs such as factors, highlights, focus areas, etc. Pitch your topic with ease and precision using this Workforce Communication And Engagement Dashboard With Suggestions And Response Rate Microsoft PDF. This layout presents information on Key Factors, Since Last Measured, Factors And Que. It is also available for immediate download and adjustment. So, changes can be made in the color, design, graphics or any other component to create a unique layout.

Performance And Potential Analysis Of Existing Employees Designs PDF
This slide shows informational stats about current employee performance and potential. The slide also depicts that 58pecent of the employees are in the top talent category with high potential and high performance .Take your projects to the next level with our ultimate collection of Performance And Potential Analysis Of Existing Employees Designs PDF. Slidegeeks has designed a range of layouts that are perfect for representing task or activity duration, keeping track of all your deadlines at a glance. Tailor these designs to your exact needs and give them a truly corporate look with your own brand colors they all make your projects stand out from the rest.
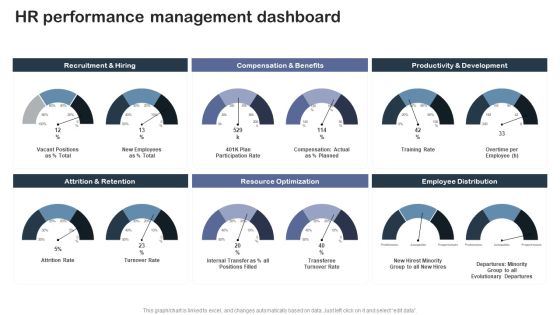
Staff Succession Planning And Development Hr Performance Management Dashboard Structure PDF
Do you have an important presentation coming up Are you looking for something that will make your presentation stand out from the rest Look no further than Staff Succession Planning And Development Hr Performance Management Dashboard Structure PDF. With our professional designs, you can trust that your presentation will pop and make delivering it a smooth process. And with Slidegeeks, you can trust that your presentation will be unique and memorable. So why wait Grab Staff Succession Planning And Development Hr Performance Management Dashboard Structure PDF today and make your presentation stand out from the rest.
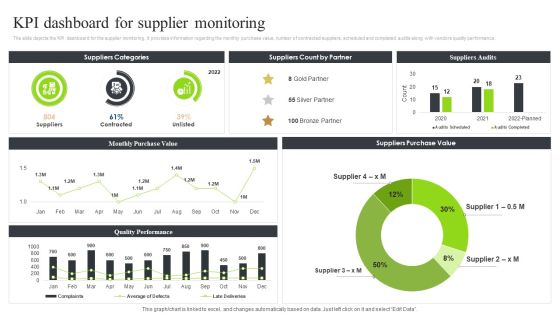
Strategic Sourcing And Supplier Quality Kpi Dashboard For Supplier Monitoring Graphics PDF
The slide depicts the KPI dashboard for the supplier monitoring. It provides information regarding the monthly purchase value, number of contracted suppliers, scheduled and completed audits along with vendors quality performance.Take your projects to the next level with our ultimate collection of Strategic Sourcing And Supplier Quality Kpi Dashboard For Supplier Monitoring Graphics PDF. Slidegeeks has designed a range of layouts that are perfect for representing task or activity duration, keeping track of all your deadlines at a glance. Tailor these designs to your exact needs and give them a truly corporate look with your own brand colors they all make your projects stand out from the rest.
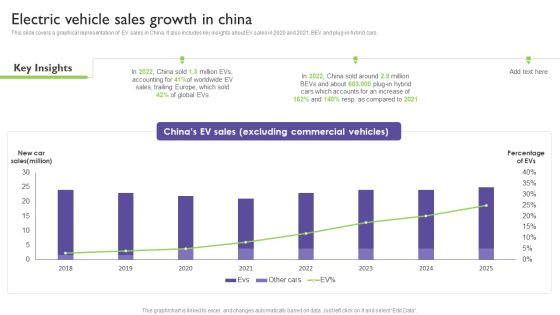
Global Automotive Industry Analysis Electric Vehicle Sales Growth In China Inspiration PDF
This slide covers a graphical representation of EV sales in China. It also includes key insights about EV sales in 2020 and 2021, BEV and plug-in hybrid cars. Make sure to capture your audiences attention in your business displays with our gratis customizable Global Automotive Industry Analysis Electric Vehicle Sales Growth In China Inspiration PDF. These are great for business strategies, office conferences, capital raising or task suggestions. If you desire to acquire more customers for your tech business and ensure they stay satisfied, create your own sales presentation with these plain slides.
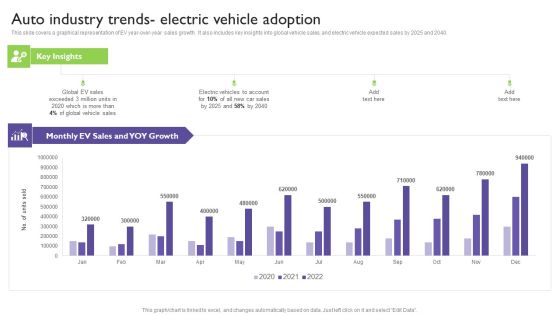
Global Automotive Industry Analysis Auto Industry Trends Electric Vehicle Adoption Rules PDF
This slide covers a graphical representation of EV year over year sales growth. It also includes key insights into global vehicle sales, and electric vehicle expected sales by 2025 and 2040. This Global Automotive Industry Analysis Auto Industry Trends Electric Vehicle Adoption Rules PDF from Slidegeeks makes it easy to present information on your topic with precision. It provides customization options, so you can make changes to the colors, design, graphics, or any other component to create a unique layout. It is also available for immediate download, so you can begin using it right away. Slidegeeks has done good research to ensure that you have everything you need to make your presentation stand out. Make a name out there for a brilliant performance.
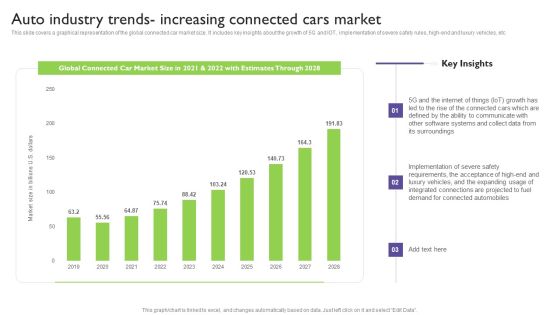
Global Automotive Industry Analysis Auto Industry Trends Increasing Connected Cars Market Pictures PDF
This slide covers a graphical representation of the global connected car market size. It includes key insights about the growth of 5G and IOT, implementation of severe safety rules, high-end and luxury vehicles, etc. Take your projects to the next level with our ultimate collection of Global Automotive Industry Analysis Auto Industry Trends Increasing Connected Cars Market Pictures PDF. Slidegeeks has designed a range of layouts that are perfect for representing task or activity duration, keeping track of all your deadlines at a glance. Tailor these designs to your exact needs and give them a truly corporate look with your own brand colors they will make your projects stand out from the rest.
HR Induction Dashboard Highlighting Employee Headcount And Turnover Ratio Icons PDF
This slide highlights the HR induction dashboard which includes average salary, headcount, turnover rate, employees hired and employees left rate, average age with employment contract and status. Make sure to capture your audiences attention in your business displays with our gratis customizable HR Induction Dashboard Highlighting Employee Headcount And Turnover Ratio Icons PDF. These are great for business strategies, office conferences, capital raising or task suggestions. If you desire to acquire more customers for your tech business and ensure they stay satisfied, create your own sales presentation with these plain slides.

KPI Dashboard To Track Process Products Sold By Insurance Topics PDF
This slide shows dashboard which can be used to compare insurance sales of current and previous year. It includes metrics such as monthly policy status, quarterly premium revenue, overall policy status, etc. Pitch your topic with ease and precision using this KPI Dashboard To Track Process Products Sold By Insurance Topics PDF. This layout presents information on Overall Policy Status, Quarterly Premium Revenue, Monthly Policy Status. It is also available for immediate download and adjustment. So, changes can be made in the color, design, graphics or any other component to create a unique layout.
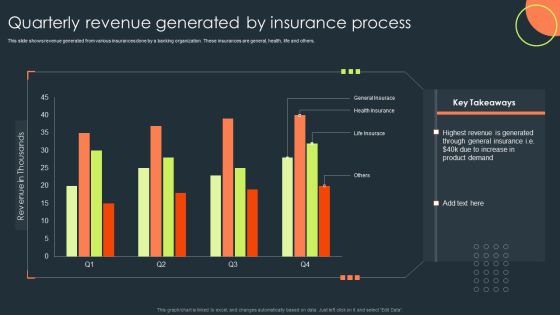
Quarterly Revenue Generated By Insurance Process Demonstration PDF
This slide shows revenue generated from various insurances done by a banking organization. These insurances are general, health, life and others. Pitch your topic with ease and precision using this Quarterly Revenue Generated By Insurance Process Demonstration PDF. This layout presents information on General Insurace, Health Insurance, Life Insurace. It is also available for immediate download and adjustment. So, changes can be made in the color, design, graphics or any other component to create a unique layout.
Stock Performance Dashboard For Metrics Team Management Ppt Outline Icons PDF
This slide represents the dashboard for tracking the management team member, manager, and teams ability to ensure inventory accuracy over time. It includes KPIs such as inventory, average result area scores and result areas. Pitch your topic with ease and precision using this Stock Performance Dashboard For Metrics Team Management Ppt Outline Icons PDF. This layout presents information on Result areas, Metrics Team, Needs Help. It is also available for immediate download and adjustment. So, changes can be made in the color, design, graphics or any other component to create a unique layout.

Customer Service KPI Dashboard For Technical Support Ppt Model Vector PDF
This slide covers customer service KPI dashboard for technical support. It involves details such as total number of issues arise daily, overall average response time, number of issues by channel and top performing technical engineers. Pitch your topic with ease and precision using this Customer Service KPI Dashboard For Technical Support Ppt Model Vector PDF. This layout presents information on Overall Average, Response Time, Total Number, Issues Arise Daily. It is also available for immediate download and adjustment. So, changes can be made in the color, design, graphics or any other component to create a unique layout.

Grow Capital Through Equity Debt Major Client And Total Revenue In Other Sectors Microsoft PDF
The slide provides a list of companys clients in different sectors manufacturing, construction, financials services, energy. Mining, automobile etc. along with the total revenue from each sector.Do you have an important presentation coming up Are you looking for something that will make your presentation stand out from the rest Look no further than Grow Capital Through Equity Debt Major Client And Total Revenue In Other Sectors Microsoft PDF. With our professional designs, you can trust that your presentation will pop and make delivering it a smooth process. And with Slidegeeks, you can trust that your presentation will be unique and memorable. So why wait Grab Grow Capital Through Equity Debt Major Client And Total Revenue In Other Sectors Microsoft PDF today and make your presentation stand out from the rest.
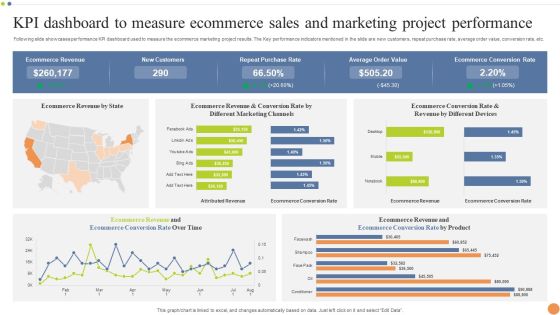
KPI Dashboard To Measure Ecommerce Sales And Marketing Project Performance Portrait PDF
Following slide showcases performance KPI dashboard used to measure the ecommerce marketing project results. The Key performance indicators mentioned in the slide are new customers, repeat purchase rate, average order value, conversion rate, etc. Pitch your topic with ease and precision using this KPI Dashboard To Measure Ecommerce Sales And Marketing Project Performance Portrait PDF. This layout presents information on Purchase Rate, Average Order Value, Ecommerce Conversion Rate. It is also available for immediate download and adjustment. So, changes can be made in the color, design, graphics or any other component to create a unique layout.
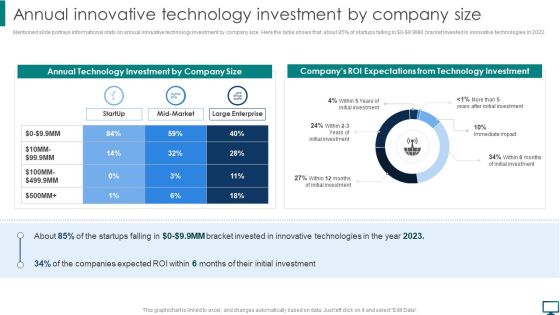
Annual Innovative Technology Investment By Company Size Microsoft PDF
Mentioned slide portrays informational stats on annual innovative technology investment by company size. Here the table shows that about 85 percent of startups falling in doller 0 dollar 9.9MM bracket invested in innovative technologies in 2022. Presenting this PowerPoint presentation, titled Annual Innovative Technology Investment By Company Size Microsoft PDF, with topics curated by our researchers after extensive research. This editable presentation is available for immediate download and provides attractive features when used. Download now and captivate your audience. Presenting this Annual Innovative Technology Investment By Company Size Microsoft PDF. Our researchers have carefully researched and created these slides with all aspects taken into consideration. This is a completely customizable Annual Innovative Technology Investment By Company Size Microsoft PDF that is available for immediate downloading. Download now and make an impact on your audience. Highlight the attractive features available with our PPTs.

Retail Analytics Dashboard To Measure Merchandise Planning Effectiveness Microsoft PDF
This slide shows the retail analytics dashboard to measure merchandise planning effectiveness which includes conversion rate, sell through rate, return on investment, website traffic, abandonment rate, etc. Make sure to capture your audiences attention in your business displays with our gratis customizable Retail Analytics Dashboard To Measure Merchandise Planning Effectiveness Microsoft PDF. These are great for business strategies, office conferences, capital raising or task suggestions. If you desire to acquire more customers for your tech business and ensure they stay satisfied, create your own sales presentation with these plain slides.

Cloud Performance Tracking Dashboard Managing Complexity Of Multiple Cloud Platforms Download PDF
This slide covers the key performance indicators for tracking performance of the cloud such as violations break down, sources, rules and severity.Presenting this PowerPoint presentation, titled Cloud Performance Tracking Dashboard Managing Complexity Of Multiple Cloud Platforms Download PDF, with topics curated by our researchers after extensive research. This editable presentation is available for immediate download and provides attractive features when used. Download now and captivate your audience. Presenting this Cloud Performance Tracking Dashboard Managing Complexity Of Multiple Cloud Platforms Download PDF. Our researchers have carefully researched and created these slides with all aspects taken into consideration. This is a completely customizable Cloud Performance Tracking Dashboard Managing Complexity Of Multiple Cloud Platforms Download PDF that is available for immediate downloading. Download now and make an impact on your audience. Highlight the attractive features available with our PPTs.

Cost Management Dashboard In Cloud Managing Complexity Of Multiple Cloud Platforms Portrait PDF
This slide covers dashboard platform for the resource organization, resource security, auditing, and cost. It also includes reporting, dashboards, budgets, optimizations, etc. Take your projects to the next level with our ultimate collection of Cost Management Dashboard In Cloud Managing Complexity Of Multiple Cloud Platforms Portrait PDF. Slidegeeks has designed a range of layouts that are perfect for representing task or activity duration, keeping track of all your deadlines at a glance. Tailor these designs to your exact needs and give them a truly corporate look with your own brand colors they all make your projects stand out from the rest.
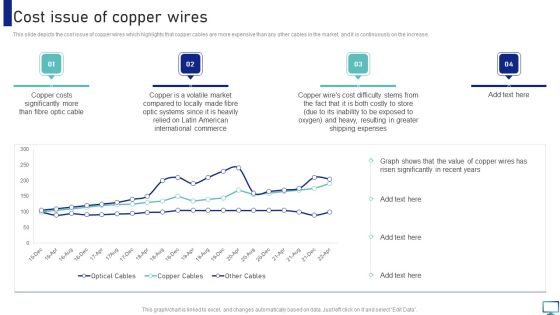
Optimizing Fiber Distributed Data Interface To Enhance Processes Cost Issue Of Copper Wires Professional PDF
This slide depicts the cost issue of copper wires which highlights that copper cables are more expensive than any other cables in the market, and it is continuously on the increase. Take your projects to the next level with our ultimate collection of Optimizing Fiber Distributed Data Interface To Enhance Processes Cost Issue Of Copper Wires Professional PDF. Slidegeeks has designed a range of layouts that are perfect for representing task or activity duration, keeping track of all your deadlines at a glance. Tailor these designs to your exact needs and give them a truly corporate look with your own brand colors they will make your projects stand out from the rest.
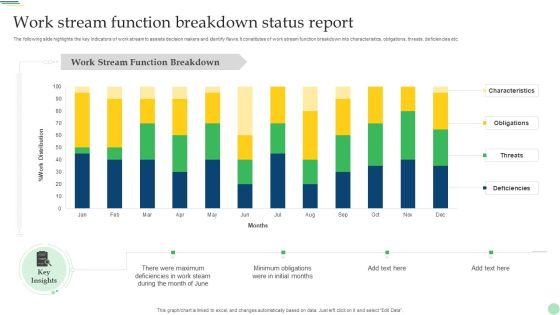
Work Stream Function Breakdown Status Report Demonstration PDF
The following slide highlights the key indicators of work stream to assists decision makers and identify flaws. It constitutes of work stream function breakdown into characteristics, obligations, threats, deficiencies etc. Pitch your topic with ease and precision using this Work Stream Function Breakdown Status Report Demonstration PDF. This layout presents information on Characteristics, Obligations, Threats, Deficiencies. It is also available for immediate download and adjustment. So, changes can be made in the color, design, graphics or any other component to create a unique layout.
Workforce Productivity Tracking Report Slide2 Professional PDF
The following slide highlights the KPIs of work streams to identify the threats and formulate strategies to mitigate its effect. It includes elements such as summary, health report etc. Pitch your topic with ease and precision using this Workforce Productivity Tracking Report Slide2 Professional PDF. This layout presents information on Sales, Issues, Budget, Workforce. It is also available for immediate download and adjustment. So, changes can be made in the color, design, graphics or any other component to create a unique layout.

Analysis Of Diary Segment In Food Manufacturing Industry Industry Analysis Of Food Elements PDF
This slide showcase the market analysis of diary segment in food manufacturing industry providing information regarding yearly growth in milk production, top three milk producing states, species wise milk production, most exported products and top export locations.Make sure to capture your audiences attention in your business displays with our gratis customizable Analysis Of Diary Segment In Food Manufacturing Industry Industry Analysis Of Food Elements PDF. These are great for business strategies, office conferences, capital raising or task suggestions. If you desire to acquire more customers for your tech business and ensure they stay satisfied, create your own sales presentation with these plain slides.

Real Time Dashboard For Change Impact Analysis Ppt Pictures Layouts PDF
This slide represents business change impact assessment metric dashboard. It includes impacted organizations and groups, impact severity, impacted users, impacted jobs etc. Pitch your topic with ease and precision using this Real Time Dashboard For Change Impact Analysis Ppt Pictures Layouts PDF. This layout presents information on Impact Severity, Role Changes Impact, High, Low, Medium. It is also available for immediate download and adjustment. So, changes can be made in the color, design, graphics or any other component to create a unique layout.

Retail Store Data Map Dashboard Ppt PowerPoint Presentation Gallery Display PDF
This slide shows retail store data inventory dashboard. It provides information such as units sold, on hand, stock availability, top selling items, average inventory value by product category, etc. Pitch your topic with ease and precision using this Retail Store Data Map Dashboard Ppt PowerPoint Presentation Gallery Display PDF. This layout presents information on Inventory Turn, Over Ratio, Gross Margin ROI. It is also available for immediate download and adjustment. So, changes can be made in the color, design, graphics or any other component to create a unique layout.

Training Process Audit Checklist For HRM Department Ppt Inspiration Deck PDF
This slide shows the checklist prepared for auditing the training program organized by the human resource management department. It includes information related to the auditee, auditor, tasks performed, proof of evidence along with remarks. Persuade your audience using this Training Process Audit Checklist For HRM Department Ppt Inspiration Deck PDF. This PPT design covers four stages, thus making it a great tool to use. It also caters to a variety of topics including Checklist Item, Organizational Level, Been Documented. Download this PPT design now to present a convincing pitch that not only emphasizes the topic but also showcases your presentation skills.
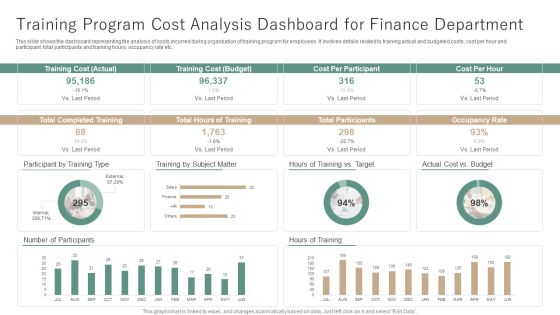
Training Program Cost Analysis Dashboard For Finance Department Ppt Example PDF
This slide shows the dashboard representing the analysis of costs incurred during organization of training program for employees. It involves details related to training actual and budgeted costs, cost per hour and participant, total participants and training hours, occupancy rate etc. Pitch your topic with ease and precision using this Training Program Cost Analysis Dashboard For Finance Department Ppt Example PDF. This layout presents information on Training Cost, Number Participants, Hours Of Training. It is also available for immediate download and adjustment. So, changes can be made in the color, design, graphics or any other component to create a unique layout.

Project Earned Value Analysis Management Report Ppt PowerPoint Presentation Gallery Outline PDF
This slide represents project earned value analysis report showcasing project task, budget cost, planned value, actual cost, earned value, project performance metrics etc. Pitch your topic with ease and precision using this Project Earned Value Analysis Management Report Ppt PowerPoint Presentation Gallery Outline PDF. This layout presents information on Project Software Development, Phase Management, Communication Planning. It is also available for immediate download and adjustment. So, changes can be made in the color, design, graphics or any other component to create a unique layout.

Earned Value Management Representing Project Progress Ppt Layouts Slide Portrait PDF
This slide represents earned value management key parameters representing project progress upto week 7 such as planned value, actual cost and earned value. Pitch your topic with ease and precision using this Earned Value Management Representing Project Progress Ppt Layouts Slide Portrait PDF. This layout presents information on Planned Value, Actual Cost, Earned Value. It is also available for immediate download and adjustment. So, changes can be made in the color, design, graphics or any other component to create a unique layout.
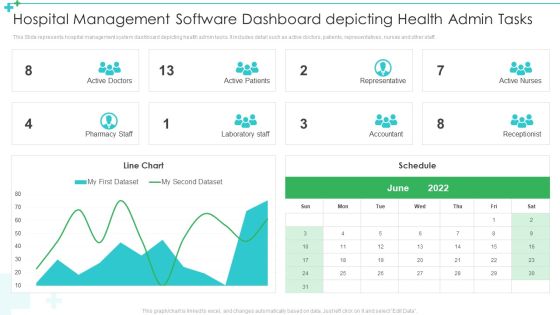
Hospital Management Software Dashboard Depicting Health Admin Tasks Ppt Pictures Inspiration PDF
This Slide represents hospital management system dashboard depicting health admin tasks. It includes detail such as active doctors, patients, representatives, nurses and other staff. Pitch your topic with ease and precision using this Hospital Management Software Dashboard Depicting Health Admin Tasks Ppt Pictures Inspiration PDF. This layout presents information on Active Doctors, Active Patients, Representative. It is also available for immediate download and adjustment. So, changes can be made in the color, design, graphics or any other component to create a unique layout.

Hospital Management Software Dashboard To Track Covid 19 Cases Ppt Professional Inspiration PDF
This slide shows hospital management system dashboard for tracking details of COVID-19 cases. It includes information about confirmed cases, recovered, deaths, death rate, etc. Pitch your topic with ease and precision using this Hospital Management Software Dashboard To Track Covid 19 Cases Ppt Professional Inspiration PDF. This layout presents information on Recovered Cases, Deaths, Mortality. It is also available for immediate download and adjustment. So, changes can be made in the color, design, graphics or any other component to create a unique layout.

Managing Cyber Security Incident Response KPI Dashboard Ppt Layouts Shapes PDF
This slide covers cyber security incident response KPI dashboard. It involves details such as intent alarm, event trend sources, event trend, sensor activity, major operating systems and asset information. Pitch your topic with ease and precision using this Managing Cyber Security Incident Response KPI Dashboard Ppt Layouts Shapes PDF. This layout presents information on Top Alarms Method, Alarms Intent, Timely Event Trend. It is also available for immediate download and adjustment. So, changes can be made in the color, design, graphics or any other component to create a unique layout.
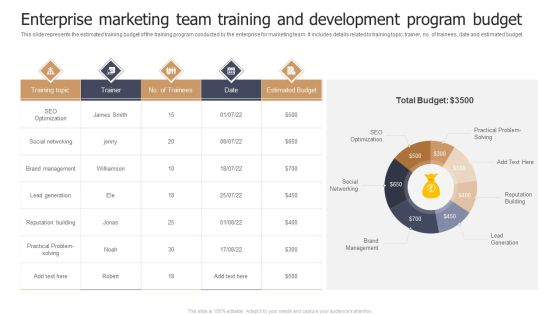
Enterprise Marketing Team Training And Development Program Budget Infographics PDF
This slide represents the estimated training budget of the training program conducted by the enterprise for marketing team. It includes details related to training topic, trainer, no. of trainees, date and estimated budget. Pitch your topic with ease and precision using this Enterprise Marketing Team Training And Development Program Budget Infographics PDF. This layout presents information on SEO Optimization, Social Networking, Brand Management. It is also available for immediate download and adjustment. So, changes can be made in the color, design, graphics or any other component to create a unique layout.

Marketing Team Training And Development Program KPI Dashboard Designs PDF
This slide represents the checklist of the training program conducted for the development of the marketing team of the organization. It includes activities related to conduct of marketing teams training program. Pitch your topic with ease and precision using this Marketing Team Training And Development Program KPI Dashboard Designs PDF. This layout presents information on Training Cost Actual, Cost Per Participant, Cost Per Hour. It is also available for immediate download and adjustment. So, changes can be made in the color, design, graphics or any other component to create a unique layout.
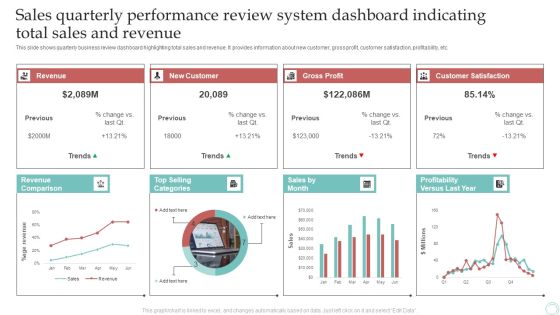
Sales Quarterly Performance Review System Dashboard Indicating Total Sales And Revenue Download PDF
This slide shows quarterly business review dashboard highlighting total sales and revenue. It provides information about new customer, gross profit, customer satisfaction, profitability, etc. Pitch your topic with ease and precision using this Sales Quarterly Performance Review System Dashboard Indicating Total Sales And Revenue Download PDF. This layout presents information on Revenue, New Customer, Gross Profit. It is also available for immediate download and adjustment. So, changes can be made in the color, design, graphics or any other component to create a unique layout.

Business Threats Landscape Dashboard With Cyber Attacks Analysis Ppt Summary Brochure PDF
This slide illustrates risk landscape dashboard with cyber attacks analysis which contains malware attack frequency, country wise attacks, top 10 attacks, etc. It can assist IT managers in analyzing top threats so that they can be dealt with proper efficiency. Pitch your topic with ease and precision using this Business Threats Landscape Dashboard With Cyber Attacks Analysis Ppt Summary Brochure PDF. This layout presents information on Malware Attack Frequency, Every Minute, Every Second. It is also available for immediate download and adjustment. So, changes can be made in the color, design, graphics or any other component to create a unique layout.

Statistics Depicting Risk Magnitude In Business Threats Landscape Ppt File Example Introduction PDF
This slide illustrates statistics which highlight magnitude of threats faced by various business units in a risk landscape. It entails information about cybersecurity, data privacy, digital innovation, cloud computing, transformational projects, mergers and acquisition and regulatory environment. Pitch your topic with ease and precision using this Statistics Depicting Risk Magnitude In Business Threats Landscape Ppt File Example Introduction PDF. This layout presents information on Business Units, Risk Magnitude, Business Landscape. It is also available for immediate download and adjustment. So, changes can be made in the color, design, graphics or any other component to create a unique layout.

Change Order Administration Dashboard With Priority Assessment Ppt Portfolio Inspiration PDF
This slide showcases change order management dashboard with priority assessment. It provides information about order stats, summary, latest change orders and priority according to rank. Pitch your topic with ease and precision using this Change Order Administration Dashboard With Priority Assessment Ppt Portfolio Inspiration PDF. This layout presents information on Change Orders Priority, Change Order Stats, Change Orders Summary. It is also available for immediate download and adjustment. So, changes can be made in the color, design, graphics or any other component to create a unique layout.

Monthly Project Progress Report Dashboard With Assigned Tasks Ppt Styles Clipart PDF
This slide showcases monthly project status dashboard with assigned tasks. It provides information about kick off meeting, resource plan, technical requests, development, hardware configuration, budget, pending items, etc. Pitch your topic with ease and precision using this Monthly Project Progress Report Dashboard With Assigned Tasks Ppt Styles Clipart PDF. This layout presents information on Pending Items, Budget, Kick Off Meeting. It is also available for immediate download and adjustment. So, changes can be made in the color, design, graphics or any other component to create a unique layout.

Monthly Project Progress Report With Total Budget Ppt Inspiration Shapes PDF
This slide showcases monthly project status with total budget. It provides information about project understanding, design, development, internal and external testing, deployment, etc. Pitch your topic with ease and precision using this Monthly Project Progress Report With Total Budget Ppt Inspiration Shapes PDF. This layout presents information on Pending, Completed, Project Understanding. It is also available for immediate download and adjustment. So, changes can be made in the color, design, graphics or any other component to create a unique layout.

Annual Innovative Technology Investment By Company Size Investment In Latest Technology To Ensure Microsoft PDF
Mentioned slide portrays informational stats on annual innovative technology investment by company size. Here the table shows that about 8precent of startups falling in dollar 0 dollar9.9MM bracket invested in innovative technologies in 2020.Presenting this PowerPoint presentation, titled Annual Innovative Technology Investment By Company Size Investment In Latest Technology To Ensure Microsoft PDF, with topics curated by our researchers after extensive research. This editable presentation is available for immediate download and provides attractive features when used. Download now and captivate your audience. Presenting this Annual Innovative Technology Investment By Company Size Investment In Latest Technology To Ensure Microsoft PDF. Our researchers have carefully researched and created these slides with all aspects taken into consideration. This is a completely customizable Annual Innovative Technology Investment By Company Size Investment In Latest Technology To Ensure Microsoft PDF that is available for immediate downloading. Download now and make an impact on your audience. Highlight the attractive features available with our PPTs.

Social Media Channels Used By Recruiters Tactical Plan To Enhance Social Media Hiring Process Summary PDF
This slide covers social media channels used by recruiters which shows twitter, facebook, youtube, blog, instagram and linkedin having main focus on recruiting high-quality candidates. Do you have an important presentation coming up Are you looking for something that will make your presentation stand out from the rest Look no further than Social Media Channels Used By Recruiters Tactical Plan To Enhance Social Media Hiring Process Summary PDF. With our professional designs, you can trust that your presentation will pop and make delivering it a smooth process. And with Slidegeeks, you can trust that your presentation will be unique and memorable. So why wait Grab Social Media Channels Used By Recruiters Tactical Plan To Enhance Social Media Hiring Process Summary PDF today and make your presentation stand out from the rest.
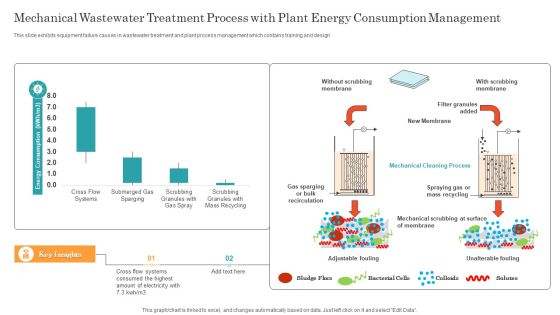
Mechanical Wastewater Treatment Process With Plant Energy Consumption Management Ppt Pictures File Formats PDF
This slide exhibits equipment failure causes in wastewater treatment and plant process management which contains training and design. Pitch your topic with ease and precision using this Mechanical Wastewater Treatment Process With Plant Energy Consumption Management Ppt Pictures File Formats PDF. This layout presents information on Cross Flow Systems, Mechanical Cleaning Process, New Membrane. It is also available for immediate download and adjustment. So, changes can be made in the color, design, graphics or any other component to create a unique layout.
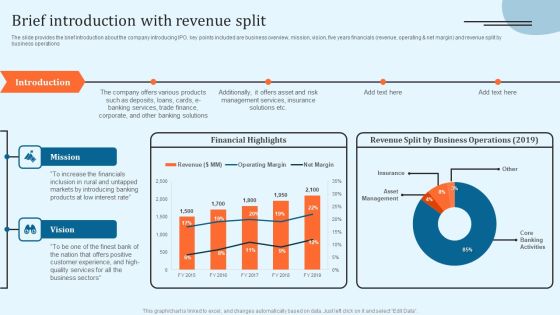
Equity Debt And Convertible Bond Investment Banking Pitch Book Brief Introduction With Revenue Split Structure PDF
The slide provides the brief introduction about the company introducing IPO. key points included are business overview, mission, vision, five years financials revenue, operating and net margin and revenue split by business operations, Presenting this PowerPoint presentation, titled Equity Debt And Convertible Bond Investment Banking Pitch Book Brief Introduction With Revenue Split Structure PDF, with topics curated by our researchers after extensive research. This editable presentation is available for immediate download and provides attractive features when used. Download now and captivate your audience. Presenting this Equity Debt And Convertible Bond Investment Banking Pitch Book Brief Introduction With Revenue Split Structure PDF. Our researchers have carefully researched and created these slides with all aspects taken into consideration. This is a completely customizable Equity Debt And Convertible Bond Investment Banking Pitch Book Brief Introduction With Revenue Split Structure PDF that is available for immediate downloading. Download now and make an impact on your audience. Highlight the attractive features available with our PPTs.
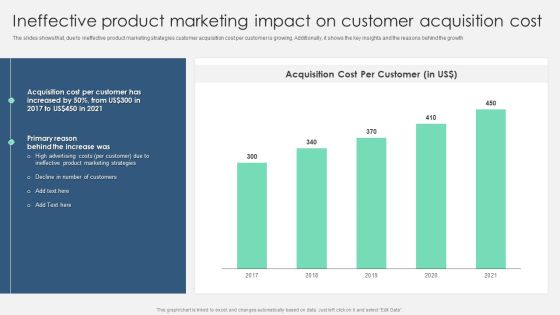
Ineffective Product Marketing Impact On Customer Acquisition Cost Graphics PDF
The slides shows that, due to ineffective product marketing strategies customer acquisition cost per customer is growing. Additionally, it shows the key insights and the reasons behind the growth. Presenting this PowerPoint presentation, titled Ineffective Product Marketing Impact On Customer Acquisition Cost Graphics PDF, with topics curated by our researchers after extensive research. This editable presentation is available for immediate download and provides attractive features when used. Download now and captivate your audience. Presenting this Ineffective Product Marketing Impact On Customer Acquisition Cost Graphics PDF. Our researchers have carefully researched and created these slides with all aspects taken into consideration. This is a completely customizable Ineffective Product Marketing Impact On Customer Acquisition Cost Graphics PDF that is available for immediate downloading. Download now and make an impact on your audience. Highlight the attractive features available with our PPTs.

Product Marketing Dashboard For Pay Per Click Campaign Sample PDF
Take your projects to the next level with our ultimate collection of Product Marketing Dashboard For Pay Per Click Campaign Sample PDF. Slidegeeks has designed a range of layouts that are perfect for representing task or activity duration, keeping track of all your deadlines at a glance. Tailor these designs to your exact needs and give them a truly corporate look with your own brand colors they will make your projects stand out from the rest.

Post Project Completion Analysis Dashboard To Manage Overall Effectiveness Professional PDF
This slide provides information regarding post project completion assessment to assess project effectiveness through comparing planned costs and benefits with actual costs and benefits to determine overall projects value.Do you have an important presentation coming up Are you looking for something that will make your presentation stand out from the rest Look no further than Post Project Completion Analysis Dashboard To Manage Overall Effectiveness Professional PDF. With our professional designs, you can trust that your presentation will pop and make delivering it a smooth process. And with Slidegeeks, you can trust that your presentation will be unique and memorable. So why wait Grab Post Project Completion Analysis Dashboard To Manage Overall Effectiveness Professional PDF today and make your presentation stand out from the rest.
