Bar Graph
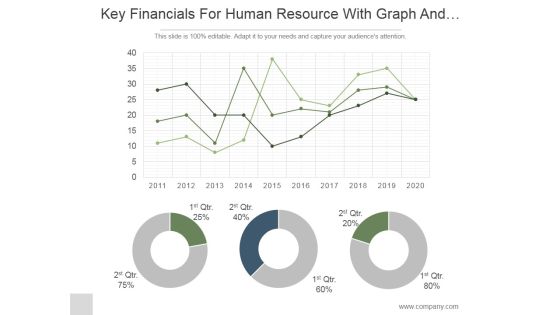
Key Financials For Human Resource With Graph And Pie Chart Ppt PowerPoint Presentation Ideas
This is a key financials for human resource with graph and pie chart ppt powerpoint presentation ideas. This is a three stage process. The stages in this process are business, strategy, marketing, analysis, donut, growth.
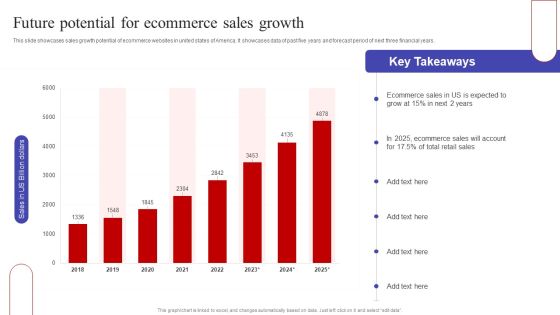
Future Potential For Ecommerce Sales Growth Ppt PowerPoint Presentation Diagram Graph Charts PDF
This slide showcases sales growth potential of ecommerce websites in united states of America. It showcases data of past five years and forecast period of next three financial years. Here you can discover an assortment of the finest PowerPoint and Google Slides templates. With these templates, you can create presentations for a variety of purposes while simultaneously providing your audience with an eye catching visual experience. Download Future Potential For Ecommerce Sales Growth Ppt PowerPoint Presentation Diagram Graph Charts PDF to deliver an impeccable presentation. These templates will make your job of preparing presentations much quicker, yet still, maintain a high level of quality. Slidegeeks has experienced researchers who prepare these templates and write high quality content for you. Later on, you can personalize the content by editing the Future Potential For Ecommerce Sales Growth Ppt PowerPoint Presentation Diagram Graph Charts PDF.
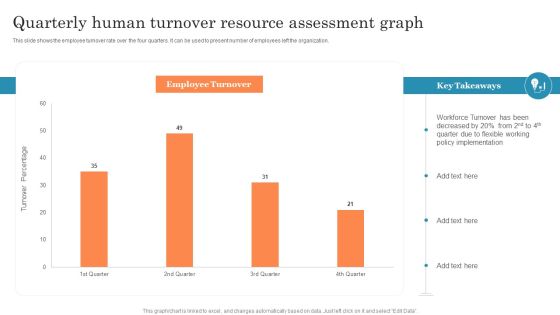
Quarterly Human Turnover Resource Assessment Graph Ppt PowerPoint Presentation Styles Infographic Template PDF
This slide shows the employee turnover rate over the four quarters. It can be used to present number of employees left the organization. Showcasing this set of slides titled Quarterly Human Turnover Resource Assessment Graph Ppt PowerPoint Presentation Styles Infographic Template PDF. The topics addressed in these templates are Flexible Working, Policy Implementation, Turnover Been. All the content presented in this PPT design is completely editable. Download it and make adjustments in color, background, font etc. as per your unique business setting.

Business Case Summary With Graph And Key Findings Ppt PowerPoint Presentation Outline Design Templates PDF
Pitch your topic with ease and precision using this business case summary with graph and key findings ppt powerpoint presentation outline design templates pdf. This layout presents information on business case highlights, market value, time, approach followed, key findings, year 2020, cost. It is also available for immediate download and adjustment. So, changes can be made in the color, design, graphics or any other component to create a unique layout.
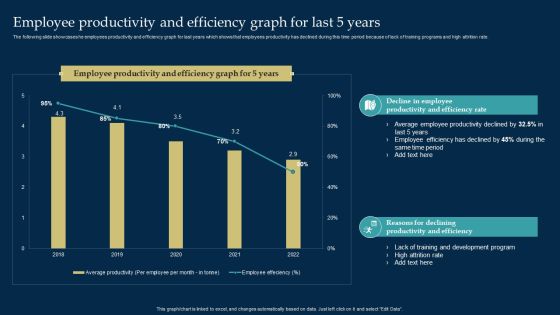
Employee Training And Development Strategy Employee Productivity And Efficiency Graph For Last 5 Years Graphics PDF
The following slide showcases he employees productivity and efficiency graph for last years which shows that employees productivity has declined during this time period because of lack of training programs and high attrition rate. Do you know about Slidesgeeks Employee Training And Development Strategy Employee Productivity And Efficiency Graph For Last 5 Years Graphics PDF These are perfect for delivering any kind od presentation. Using it, create PowerPoint presentations that communicate your ideas and engage audiences. Save time and effort by using our pre designed presentation templates that are perfect for a wide range of topic. Our vast selection of designs covers a range of styles, from creative to business, and are all highly customizable and easy to edit. Download as a PowerPoint template or use them as Google Slides themes.

Graph Highlighting Cost Involved In Multiple Clinical Trial Phases New Clinical Drug Trial Process Mockup PDF
This slide visually represents the money spent in each phase of the clinical trial procedure to check the safety and efficacy of the newly developed drug. Find highly impressive Graph Highlighting Cost Involved In Multiple Clinical Trial Phases New Clinical Drug Trial Process Mockup PDF on Slidegeeks to deliver a meaningful presentation. You can save an ample amount of time using these presentation templates. No need to worry to prepare everything from scratch because Slidegeeks experts have already done a huge research and work for you. You need to download Graph Highlighting Cost Involved In Multiple Clinical Trial Phases New Clinical Drug Trial Process Mockup PDF for your upcoming presentation. All the presentation templates are 100 percent editable and you can change the color and personalize the content accordingly. Download now.
Downturn Graph Showing Decrease In Income Over The Years Ppt PowerPoint Presentation Icon File Formats PDF
Showcasing this set of slides titled downturn graph showing decrease in income over the years ppt powerpoint presentation icon file formats pdf. The topics addressed in these templates are middle class share of total income, middle class share of income, union membership rate, 2013 to 2020. All the content presented in this PPT design is completely editable. Download it and make adjustments in color, background, font etc. as per your unique business setting.

Departmental Workforce Increase Graph Of Organization Ppt Infographics Graphics Pictures PDF
This slide shows increase in headcount of various departments of corporate. It includes departments such as marketing, finance, production, sales, etc. Showcasing this set of slides titled Departmental Workforce Increase Graph Of Organization Ppt Infographics Graphics Pictures PDF. The topics addressed in these templates are Customer Support Department, Number Customers, Highest Headcount. All the content presented in this PPT design is completely editable. Download it and make adjustments in color, background, font etc. as per your unique business setting.
Financial Line Graph Vector Icon Ppt PowerPoint Presentation Infographic Template Mockup
Presenting this set of slides with name financial line graph vector icon ppt powerpoint presentation infographic template mockup. This is a three stage process. The stages in this process are financial line graph vector icon. This is a completely editable PowerPoint presentation and is available for immediate download. Download now and impress your audience.

Problems Related To Current Product Positioning Ppt PowerPoint Presentation Diagram Graph Charts PDF
This slide highlights the problems related to current product positioning which showcases in graphical format depicting downgrading product sales and changing consumer trends. Do you have an important presentation coming up Are you looking for something that will make your presentation stand out from the rest Look no further than Problems Related To Current Product Positioning Ppt PowerPoint Presentation Diagram Graph Charts PDF. With our professional designs, you can trust that your presentation will pop and make delivering it a smooth process. And with Slidegeeks, you can trust that your presentation will be unique and memorable. So why wait Grab Problems Related To Current Product Positioning Ppt PowerPoint Presentation Diagram Graph Charts PDF today and make your presentation stand out from the rest
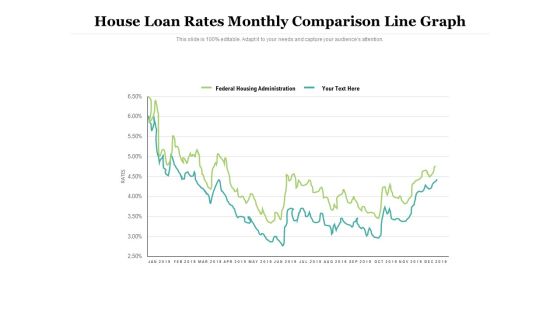
House Loan Rates Monthly Comparison Line Graph Ppt PowerPoint Presentation Slides Graphics Pictures PDF
Showcasing this set of slides titled house loan rates monthly comparison line graph ppt powerpoint presentation slides graphics pictures pdf. The topics addressed in these templates are federal housing administration, house loan rates, line graph. All the content presented in this PPT design is completely editable. Download it and make adjustments in color, background, font etc. as per your unique business setting.
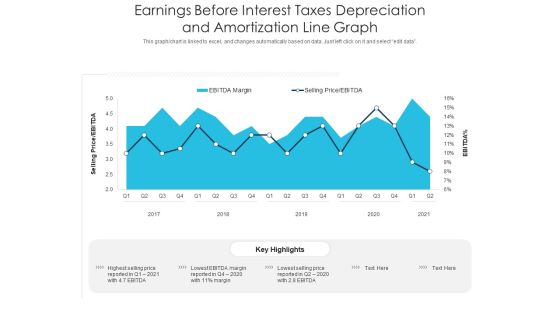
Earnings Before Interest Taxes Depreciation And Amortization Line Graph Ppt PowerPoint Presentation Layouts Aids PDF
Showcasing this set of slides titled earnings before interest taxes depreciation and amortization line graph ppt powerpoint presentation layouts aids pdf. The topics addressed in these templates are earnings before interest taxes depreciation and amortization line graph. All the content presented in this PPT design is completely editable. Download it and make adjustments in color, background, font etc. as per your unique business setting.

Budgetary Trends Graph Icon With Magnifying Glass And Trend Line Introduction PDF
Presenting Budgetary Trends Graph Icon With Magnifying Glass And Trend Line Introduction PDF to dispense important information. This template comprises four stages. It also presents valuable insights into the topics including Budgetary Trends, Graph Icon, Magnifying Glass. This is a completely customizable PowerPoint theme that can be put to use immediately. So, download it and address the topic impactfully.

Stakeholder Assessment Analysis Graph With Power And Interest Ppt Gallery Skills PDF
This slide shows the stakeholder assessment analysis graph with interest and power positions such as procurement, technicians, supervisors, operators, etc. This is a stakeholder assessment analysis graph with power and interest ppt gallery skills pdf. template with various stages. Focus and dispense information on four stages using this creative set, that comes with editable features. It contains large content boxes to add your information on topics like technicians, procurement, supervisors, operators. You can also showcase facts, figures, and other relevant content using this PPT layout. Grab it now.
Expenses And Income Comparison Graph With Budget Summary Ppt PowerPoint Presentation Icon Inspiration PDF
This slide illustrates budget summary of expenditure of a company. it includes income and expenditure comparative data and expenditure chart etc.Pitch your topic with ease and precision using this Expenses And Income Comparison Graph With Budget Summary Ppt PowerPoint Presentation Icon Inspiration PDF. This layout presents information on Budget Summary, Expenditure Comparative, Actual Income. It is also available for immediate download and adjustment. So, changes can be made in the color, design, graphics or any other component to create a unique layout.
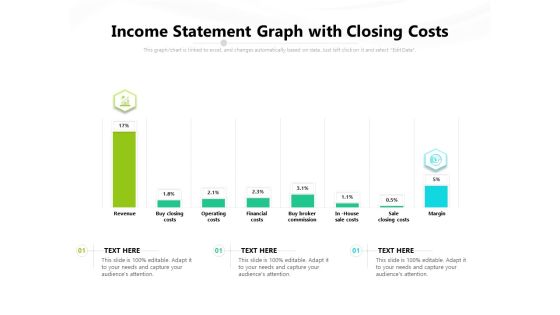
Income Statement Graph With Closing Costs Ppt PowerPoint Presentation Gallery Example Topics PDF
Presenting this set of slides with name income statement graph with closing costs ppt powerpoint presentation gallery example topics pdf. The topics discussed in these slides are revenue, buy closing costs, operating costs, financial costs, buy broker commission, in house sale costs, sale closing costs, margin. This is a completely editable PowerPoint presentation and is available for immediate download. Download now and impress your audience.

Pie Graph Representing United States Coast Guard Soldiers Ethic Diversity Ppt PowerPoint Presentation Layouts Backgrounds PDF
Pitch your topic with ease and precision using this pie graph representing united states coast guard soldiers ethic diversity ppt powerpoint presentation layouts backgrounds pdf. This layout presents information on hispanic, latino, asian, african american, ethnicity unknown, non resident alien. It is also available for immediate download and adjustment. So, changes can be made in the color, design, graphics or any other component to create a unique layout.

Product Graph Showing Cost Of Bad Quality At Various Levels Ppt PowerPoint Styles Model PDF
Pitch your topic with ease and precision using this product graph showing cost of bad quality at various levels ppt powerpoint styles model pdf. This layout presents information on minimum quality cost, minimum quality for minimum cost, total quality cost. It is also available for immediate download and adjustment. So, changes can be made in the color, design, graphics or any other component to create a unique layout.

Pie Graph 15 85 Percent Business PowerPoint Templates And PowerPoint Themes 0512
Pie Graph 15 85 Percent Business PowerPoint Templates And PowerPoint Themes PPT designs-Microsoft Powerpoint Templates and Background with fifteen and eighty five percent proportion pie chart

Substitute Financing Pitch Deck Shareholding Structure Graph Pre And Post Funding Rules PDF
The slide provides the graph of shareholding structure at the time of founding, before crowdfunding and after crowdfunding. Deliver an awe inspiring pitch with this creative substitute financing pitch deck shareholding structure graph pre and post funding rules pdf bundle. Topics like shareholding structure graph pre and post funding can be discussed with this completely editable template. It is available for immediate download depending on the needs and requirements of the user.
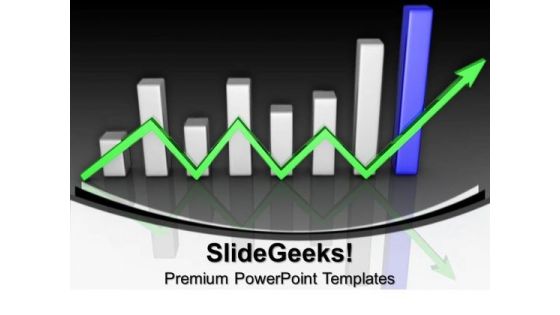
Graph With Success Arrow Finance PowerPoint Templates And PowerPoint Themes 0912
Graph With Success Arrow Finance PowerPoint Templates And PowerPoint Themes 0912-Microsoft Powerpoint Templates and Background with business success with arrow-Business success with arrow, finance, marketing, business, arrows, success

People In Business 3d Men Lifting Graph Piece Growth PowerPoint Templates
We present our people in business 3d men lifting graph piece growth PowerPoint templates.Download our Business PowerPoint Templates because Our PowerPoint Templates and Slides are effectively colour coded to prioritise your plans They automatically highlight the sequence

Business Strategy And Policy 3d Man With Money Market Graph Characters
Connect The Dots With Our business strategy and policy 3d man with money market graph characters Powerpoint Templates. Watch The Whole Picture Clearly Emerge.

Business Diagram Round Annual Graph 8 Stages Business Finance Strategy Development
Our Business Diagram Round Annual Graph 8 Stages Business Finance Strategy Development Powerpoint Templates Team Are A Dogged Lot. They Keep At It Till They Get It Right.
Three Sections Pie Graph With Icons Ppt PowerPoint Presentation Portfolio Good PDF
Presenting this set of slides with name three sections pie graph with icons ppt powerpoint presentation portfolio good pdf. This is a three stage process. The stages in this process are three sections pie graph with icons. This is a completely editable PowerPoint presentation and is available for immediate download. Download now and impress your audience.
Line Graph Icon For Business Statistical Analysis Ppt PowerPoint Presentation Gallery Clipart Images PDF
Presenting this set of slides with name line graph icon for business statistical analysis ppt powerpoint presentation gallery clipart images pdf. The topics discussed in these slide is line graph icon for business statistical analysis. This is a completely editable PowerPoint presentation and is available for immediate download. Download now and impress your audience.

Past Trends In Market Share Of ABC Carbonated Drink Company Ppt Diagram Graph Charts PDF
This slide shows the past trends in market share of ABC Carbonated Beverage Company worldwide. The market share has decreased due to decline in sales as people have become more health conscious and avoid beverages that have high sugar content and caffeine. Deliver an awe inspiring pitch with this creative past trends in market share of abc carbonated drink company ppt diagram graph charts pdf bundle. Topics like past trends in market share of abc carbonated drink company can be discussed with this completely editable template. It is available for immediate download depending on the needs and requirements of the user.

Attain Production Goals And Objectives Graph And Table Ppt Infographic Template Visuals PDF
This slide displays graphical representation of targeted and achieved production variance. It also includes critical insights such as target units, achieved production, achieved percentage, overachieved percentage, etc. Pitch your topic with ease and precision using this Attain Production Goals And Objectives Graph And Table Ppt Infographic Template Visuals PDF. This layout presents information on Target Vs Achieved, Key insight Table, Quarterly. It is also available for immediate download and adjustment. So, changes can be made in the color, design, graphics or any other component to create a unique layout.

Business People Images 3d Men Free PowerPoint Templates Success Graph Slides
We present our business people images 3d men free powerpoint templates success graph Slides.Download our People PowerPoint Templates because You are working at that stage with an air of royalty. Let our PowerPoint Templates and Slides be the jewels in your crown. Present our Business PowerPoint Templates because Our PowerPoint Templates and Slides are conceived by a dedicated team. Use them and give form to your wondrous ideas. Use our Handshake PowerPoint Templates because Your success is our commitment. Our PowerPoint Templates and Slides will ensure you reach your goal. Download and present our Arrows PowerPoint Templates because Our PowerPoint Templates and Slides are truly out of this world. Even the MIB duo has been keeping tabs on our team. Download and present our Flow Charts PowerPoint Templates because Our PowerPoint Templates and Slides are endowed to endure. Ideas conveyed through them will pass the test of time.Use these PowerPoint slides for presentations relating to 3d, abstract, agreement, business, cartoon, character, chart, concept, conceptual,contract, corporate, deal, figure, graph, graphic, handshake, human, illustration,isolated, man, market, partnership, person, presentation, render, stocks, success,symbolic. The prominent colors used in the PowerPoint template are White, Red, Gray. Professionals tell us our business people images 3d men free powerpoint templates success graph Slides look good visually. Professionals tell us our business PowerPoint templates and PPT Slides will make the presenter successul in his career/life. People tell us our business people images 3d men free powerpoint templates success graph Slides are incredible easy to use. Customers tell us our character PowerPoint templates and PPT Slides will help you be quick off the draw. Just enter your specific text and see your points hit home. The feedback we get is that our business people images 3d men free powerpoint templates success graph Slides are topically designed to provide an attractive backdrop to any subject. Use our chart PowerPoint templates and PPT Slides provide you with a vast range of viable options. Select the appropriate ones and just fill in your text.

Quarterly Declining Graph Of A Manufacturing Plant Ppt PowerPoint Presentation File Example Topics PDF
This chart shows how the production of the manufacturing plan is declining in every quarter because of some critical reasons and how it is effecting the companys growth and goodwill. Showcasing this set of slides titled Quarterly Declining Graph Of A Manufacturing Plant Ppt PowerPoint Presentation File Example Topics PDF. The topics addressed in these templates are Production Declined, Lack Of Technology, Unskilled Laborers. All the content presented in this PPT design is completely editable. Download it and make adjustments in color, background, font etc. as per your unique business setting.
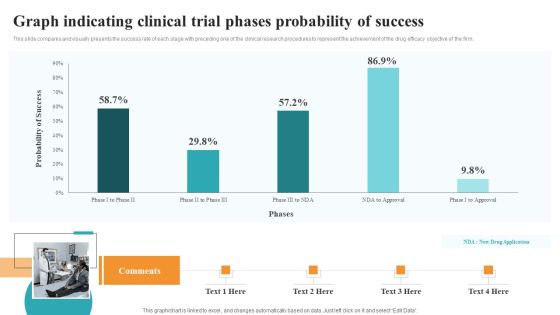
Graph Indicating Clinical Trial Phases Probability Of Success Medical Research Phases For Clinical Tests Graphics PDF
This slide compares and visually presents the success rate of each stage with preceding one of the clinical research procedures to represent the achievement of the drug efficacy objective of the firm. There are so many reasons you need a Graph Indicating Clinical Trial Phases Probability Of Success Medical Research Phases For Clinical Tests Graphics PDF. The first reason is you can not spend time making everything from scratch, Thus, Slidegeeks has made presentation templates for you too. You can easily download these templates from our website easily.

Graph Indicating Clinical Trial Phases Probability Of Success New Clinical Drug Trial Process Information PDF
This slide compares and visually presents the success rate of each stage with preceding one of the clinical research procedures to represent the achievement of the drug efficacy objective of the firm. If your project calls for a presentation, then Slidegeeks is your go-to partner because we have professionally designed, easy-to-edit templates that are perfect for any presentation. After downloading, you can easily edit Graph Indicating Clinical Trial Phases Probability Of Success New Clinical Drug Trial Process Information PDF and make the changes accordingly. You can rearrange slides or fill them with different images. Check out all the handy templates

Digital Advertising Plan For Bakery Business Dough Nut Graph Showing Demand Rules PDF
Do you know about Slidesgeeks Digital Advertising Plan For Bakery Business Dough Nut Graph Showing Demand Rules PDF These are perfect for delivering any kind od presentation. Using it, create PowerPoint presentations that communicate your ideas and engage audiences. Save time and effort by using our pre designed presentation templates that are perfect for a wide range of topic. Our vast selection of designs covers a range of styles, from creative to business, and are all highly customizable and easy to edit. Download as a PowerPoint template or use them as Google Slides themes.
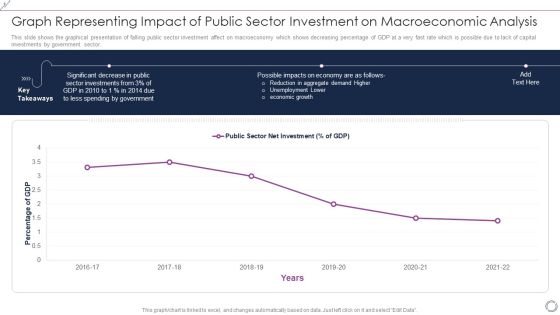
Graph Representing Impact Of Public Sector Investment On Macroeconomic Analysis Themes PDF
This slide shows the graphical presentation of falling public sector investment affect on macroeconomy which shows decreasing percentage of GDP at a very fast rate which is possible due to lack of capital investments by government sector. Showcasing this set of slides titled Graph Representing Impact Of Public Sector Investment On Macroeconomic Analysis Themes PDF. The topics addressed in these templates are Percentage GDP, 2016 to 2022, Public Sector Net Investment. All the content presented in this PPT design is completely editable. Download it and make adjustments in color, background, font etc. as per your unique business setting.

Breakeven Point Graph With Degree Of Operational Leverage Ppt Layouts Graphics Pictures PDF
This slide illustrates graphical representation of breakeven point and key insights. It includes figures of contribution margin, fixed costs, total cost, operating costs etc. Showcasing this set of slides titled Breakeven Point Graph With Degree Of Operational Leverage Ppt Layouts Graphics Pictures PDF. The topics addressed in these templates are Total Sales, Net income, Total Costs, Total Variables Costs. All the content presented in this PPT design is completely editable. Download it and make adjustments in color, background, font etc. as per your unique business setting.

6 Year Revenue Declining Graph Ppt PowerPoint Presentation Outline Sample PDF
This slide shows the revenues of the company over the last years to have a clear idea of organization growth and financial status . It includes the 6 year 2017 to 2022 revenue earned by the company.Showcasing this set of slides titled 6 Year Revenue Declining Graph Ppt PowerPoint Presentation Outline Sample PDF. The topics addressed in these templates are Revenue Company, Highest Comparison, Conditions Restrictions. All the content presented in this PPT design is completely editable. Download it and make adjustments in color, background, font etc. as per your unique business setting.
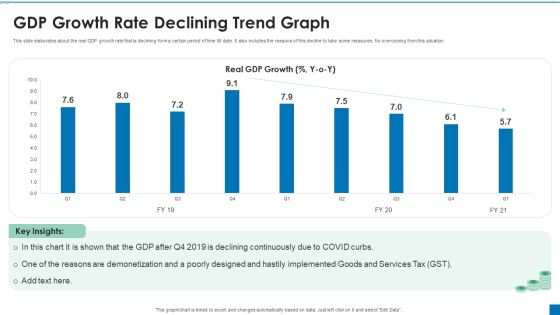
GDP Growth Rate Declining Trend Graph Ppt PowerPoint Presentation Slides Professional PDF
This slide elaborates about the real GDP growth rate that is declining form a certain period of time till date. It also includes the reasons of this decline to take some measures for overcoming from this situation. Showcasing this set of slides titled GDP Growth Rate Declining Trend Graph Ppt PowerPoint Presentation Slides Professional PDF. The topics addressed in these templates are Declining Continuously, Poorly Designed, Reasons Demonetization. All the content presented in this PPT design is completely editable. Download it and make adjustments in color, background, font etc. as per your unique business setting.

Chart Icon Illustrates Diminishing Graph And Chart Company Sales Professional PDF
Presenting Chart Icon Illustrates Diminishing Graph And Chart Company Sales Professional PDF to dispense important information. This template comprises four stages. It also presents valuable insights into the topics including Chart Icon Illustrates Diminishing, Graph Chart Company Sales. This is a completely customizable PowerPoint theme that can be put to use immediately. So, download it and address the topic impactfully.

Pie Chart For Business Graph PowerPoint Templates Ppt Backgrounds For Slides 0413
Drive your passion with our Pie Chart For Business Graph PowerPoint Templates PPT Backgrounds For Slides 0413. Steer yourself to achieve your aims. Drink from the fountain of our Pie Chart For Business Graph PowerPoint Templates PPT Backgrounds For Slides 0413. Refresh your audience with your bubbling ideas.

Financial R2R Icon With Graph And Chart Ppt PowerPoint Presentation Slides Design Inspiration PDF
Presenting Financial R2R Icon With Graph And Chart Ppt PowerPoint Presentation Slides Design Inspiration PDF to dispense important information. This template comprises three stages. It also presents valuable insights into the topics including Financial R2r Icon, Graph Chart. This is a completely customizable PowerPoint theme that can be put to use immediately. So, download it and address the topic impactfully.

5S Methodology Slide For Graph Visualization Tools Ppt PowerPoint Presentation Summary Graphics Template PDF
Presenting 5s methodology slide for graph visualization tools ppt powerpoint presentation summary graphics template pdf to dispense important information. This template comprises five stages. It also presents valuable insights into the topics including 5s methodology for graph visualization tools. This is a completely customizable PowerPoint theme that can be put to use immediately. So, download it and address the topic impactfully.

Colorful Pie Business Graph Marketing PowerPoint Templates Ppt Backgrounds For Slides 0513
Establish your dominion with our Colorful Pie Business Graph Marketing PowerPoint Templates PPT Backgrounds For Slides. Rule the stage with your thoughts. Your ideas demand attention. Our Leadership PowerPoint Templates will get it done.There is never a dull moment with our Colorful Pie Business Graph Marketing PowerPoint Templates Ppt Backgrounds For Slides 0513 PowerPoint Templates. They will keep the excitement at high pitch.

Data Outline Pie Graph Vector Icon Ppt PowerPoint Presentation Infographic Template Maker PDF
Showcasing this set of slides titled data outline pie graph vector icon ppt powerpoint presentation infographic template maker pdf. The topics addressed in these templates are data outline pie graph vector icon. All the content presented in this PPT design is completely editable. Download it and make adjustments in color, background, font etc. as per your unique business setting.
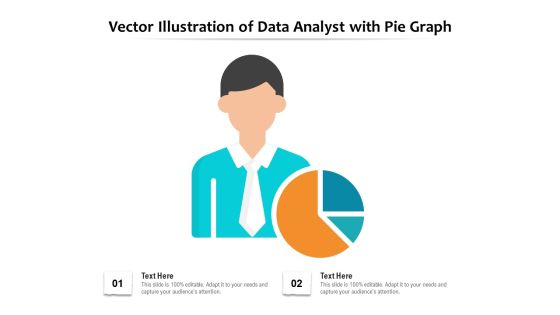
Vector Illustration Of Data Analyst With Pie Graph Ppt PowerPoint Presentation Infographic Template Information PDF
Showcasing this set of slides titled vector illustration of data analyst with pie graph ppt powerpoint presentation infographic template information pdf. The topics addressed in these templates are vector illustration of data analyst with pie graph. All the content presented in this PPT design is completely editable. Download it and make adjustments in color, background, font etc. as per your unique business setting.
Financial Loss Graph Vector Icon Ppt PowerPoint Presentation Infographic Template Layouts PDF
Presenting this set of slides with name financial loss graph vector icon ppt powerpoint presentation infographic template layouts pdf. This is a three stage process. The stages in this process are financial loss graph vector icon. This is a completely editable PowerPoint presentation and is available for immediate download. Download now and impress your audience.
Growth Graph In Magnifying Glass Vector Icon Ppt PowerPoint Presentation Model Graphics Template PDF
Presenting this set of slides with name growth graph in magnifying glass vector icon ppt powerpoint presentation model graphics template pdf. This is a three stage process. The stages in this process are growth graph in magnifying glass vector icon. This is a completely editable PowerPoint presentation and is available for immediate download. Download now and impress your audience.
Edit Graph With Pencil Vector Icon Ppt PowerPoint Presentation Infographic Template Graphics Download PDF
Presenting this set of slides with name edit graph with pencil vector icon ppt powerpoint presentation infographic template graphics download pdf. This is a three stage process. The stages in this process are edit graph with pencil vector icon. This is a completely editable PowerPoint presentation and is available for immediate download. Download now and impress your audience.
Workforce Downward Turnover Graph Vector Icon Ppt PowerPoint Presentation Icon Template PDF
Presenting this set of slides with name workforce downward turnover graph vector icon ppt powerpoint presentation icon template pdf. This is a three stage process. The stages in this process are workforce downward turnover graph vector icon. This is a completely editable PowerPoint presentation and is available for immediate download. Download now and impress your audience.

Company Process Improvement With Gear And Graph Icon Ppt PowerPoint Presentation Gallery Templates PDF
Presenting this set of slides with name company process improvement with gear and graph icon ppt powerpoint presentation gallery templates pdf. This is a three stage process. The stages in this process are company process improvement with gear and graph icon. This is a completely editable PowerPoint presentation and is available for immediate download. Download now and impress your audience.
Graph For Money Flow Assessment With Magnifying Glass Ppt PowerPoint Presentation Gallery Design Templates PDF
Presenting this set of slides with name graph for money flow assessment with magnifying glass ppt powerpoint presentation gallery design templates pdf. This is a three stage process. The stages in this process are graph for money flow assessment with magnifying glass. This is a completely editable PowerPoint presentation and is available for immediate download. Download now and impress your audience.

Business Meeting Icon With Sales Growth Graph Ppt PowerPoint Presentation Slides Template PDF
Presenting this set of slides with name business meeting icon with sales growth graph ppt powerpoint presentation slides template pdf. This is a three stage process. The stages in this process are business meeting icon with sales growth graph. This is a completely editable PowerPoint presentation and is available for immediate download. Download now and impress your audience.

Graph For Fluctuation In Business Cycle Ppt PowerPoint Presentation File Infographic Template PDF
Presenting this set of slides with name graph for fluctuation in business cycle ppt powerpoint presentation file infographic template pdf. This is a two stage process. The stages in this process are graph for fluctuation in business cycle. This is a completely editable PowerPoint presentation and is available for immediate download. Download now and impress your audience.
Downturn Graph Vector Icon With Text Holders Ppt PowerPoint Presentation Infographic Template Layout PDF
Pitch your topic with ease and precision using this downturn graph vector icon with text holders ppt powerpoint presentation infographic template layout pdf. This layout presents information on downturn graph vector icon with text holders. It is also available for immediate download and adjustment. So, changes can be made in the color, design, graphics or any other component to create a unique layout.
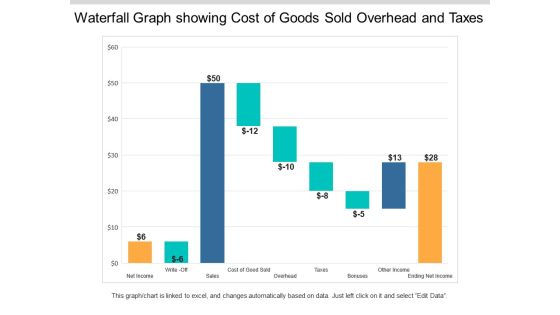
Waterfall Graph Showing Cost Of Goods Sold Overhead And Taxes Ppt PowerPoint Presentation Styles Example Topics
This is a waterfall graph showing cost of goods sold overhead and taxes ppt powerpoint presentation styles example topics. This is a three stage process. The stages in this process are profit and loss, balance sheet, income statement, benefit and loss.
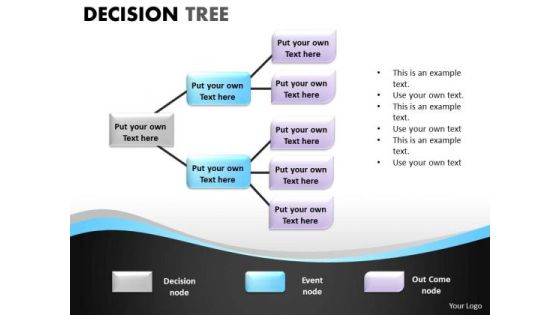
Business Finance Strategy Development Decision Tree Ppt Graph Mba Models And Frameworks
With Our Business Finance Strategy Development Decision Tree PPT graph MBA models and frameworks Powerpoint Templates You Will Be Doubly Sure. They Possess That Stamp Of Authority. Our Business Finance Strategy Development Decision Tree PPT graph MBA models and frameworks Powerpoint Templates Do It In Double Quick Time. Speed Up The Process In A Tangible Way.

Vector Showing Career Growth Graph Of Businessman Ppt PowerPoint Presentation File Background Designs PDF
Presenting vector showing career growth graph of businessman ppt powerpoint presentation file background designs pdf to dispense important information. This template comprises three stages. It also presents valuable insights into the topics including vector showing career growth graph of businessman. This is a completely customizable PowerPoint theme that can be put to use immediately. So, download it and address the topic impactfully.

Business Statistics Assessment Graph Icon Ppt PowerPoint Presentation Slides Background Images PDF
Presenting business statistics assessment graph icon ppt powerpoint presentation slides background images pdf to dispense important information. This template comprises three stages. It also presents valuable insights into the topics including business statistics assessment graph icon. This is a completely customizable PowerPoint theme that can be put to use immediately. So, download it and address the topic impactfully.
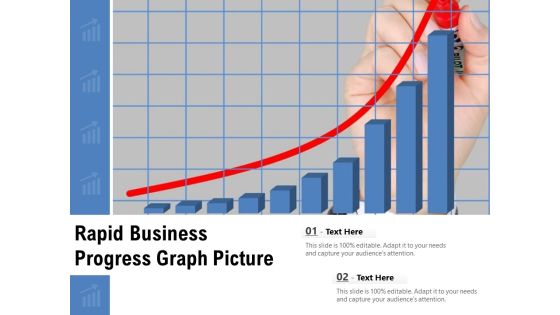
Rapid Business Progress Graph Picture Ppt PowerPoint Presentation Gallery File Formats PDF
Presenting rapid business progress graph picture ppt powerpoint presentation gallery file formats pdf to dispense important information. This template comprises two stages. It also presents valuable insights into the topics including rapid business progress graph picture. This is a completely customizable PowerPoint theme that can be put to use immediately. So, download it and address the topic impactfully.
Good Financial Position Shown With Graph Ppt PowerPoint Presentation Model Elements PDF
Presenting good financial position shown with graph ppt powerpoint presentation model elements pdf to dispense important information. This template comprises two stages. It also presents valuable insights into the topics including good financial position shown with graph. This is a completely customizable PowerPoint theme that can be put to use immediately. So, download it and address the topic impactfully.
Statistics Analysis Graph Vector Icon Ppt PowerPoint Presentation Professional Show PDF
Showcasing this set of slides titled statistics analysis graph vector icon ppt powerpoint presentation professional show pdf. The topics addressed in these templates are statistics analysis graph vector icon. All the content presented in this PPT design is completely editable. Download it and make adjustments in color, background, font etc. as per your unique business setting.

 Home
Home