AI PPT Maker
Templates
PPT Bundles
Design Services
Business PPTs
Business Plan
Management
Strategy
Introduction PPT
Roadmap
Self Introduction
Timelines
Process
Marketing
Agenda
Technology
Medical
Startup Business Plan
Cyber Security
Dashboards
SWOT
Proposals
Education
Pitch Deck
Digital Marketing
KPIs
Project Management
Product Management
Artificial Intelligence
Target Market
Communication
Supply Chain
Google Slides
Research Services
 One Pagers
All Categories
-
Home
- Customer Favorites
- Bar Graph
Bar Graph

Chart Showing Retail Channels Distribution Share Ppt PowerPoint Presentation Styles Format PDF
Pitch your topic with ease and precision using this chart showing retail channels distribution share ppt powerpoint presentation styles format pdf. This layout presents information on home shopping, duty free stores, departmental stores, hyermarkets, online. It is also available for immediate download and adjustment. So, changes can be made in the color, design, graphics or any other component to create a unique layout.
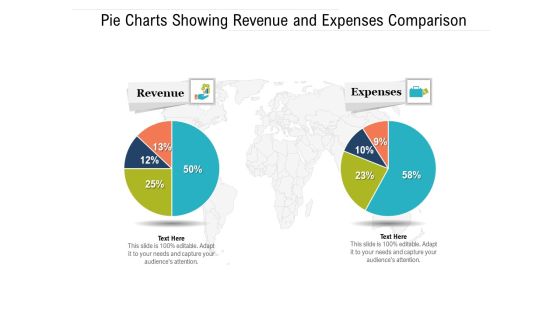
Pie Charts Showing Revenue And Expenses Comparison Ppt PowerPoint Presentation File Objects PDF
Pitch your topic with ease and precision using this pie charts showing revenue and expenses comparison ppt powerpoint presentation file objects pdf. This layout presents information on revenue, expenses. It is also available for immediate download and adjustment. So, changes can be made in the color, design, graphics or any other component to create a unique layout.
Workforce Planning Pie Chart Showing Personnel Education And Department Ppt PowerPoint Presentation Icon Gallery PDF
Pitch your topic with ease and precision using this workforce planning pie chart showing personnel education and department ppt powerpoint presentation icon gallery pdf. This layout presents information on gender, department, education, management, department, marketing, accounts. It is also available for immediate download and adjustment. So, changes can be made in the color, design, graphics or any other component to create a unique layout.

Coronavirus Disease 19 Contagiousness Comparison Chart Ppt PowerPoint Presentation Professional Background Designs PDF
Pitch your topic with ease and precision using this coronavirus disease 19 contagiousness comparison chart ppt powerpoint presentation professional background designs pdf. This layout presents information on x values seasonal norovirus case fatality rate. It is also available for immediate download and adjustment. So, changes can be made in the color, design, graphics or any other component to create a unique layout.

Monthly Website Performance Analysis Chart Ppt PowerPoint Presentation Model Skills PDF
Pitch your topic with ease and precision using this monthly website performance analysis chart ppt powerpoint presentation model skills pdf. This layout presents information on visitor devices, maverage time, the breakdown, laptop, desktop, mobile. It is also available for immediate download and adjustment. So, changes can be made in the color, design, graphics or any other component to create a unique layout.

Monthly Website Performance Analysis Chart Ppt PowerPoint Presentation Ideas Master Slide PDF
Pitch your topic with ease and precision using this monthly website performance analysis chart ppt powerpoint presentation ideas master slide pdf. This layout presents information on visitor devices, website traffic trends, the breakdown, average time. It is also available for immediate download and adjustment. So, changes can be made in the color, design, graphics or any other component to create a unique layout.

Pie Chart Showing Product Classification Of A Business Ppt PowerPoint Presentation File Guide PDF
Pitch your topic with ease and precision using this pie chart showing product classification of a business ppt powerpoint presentation file guide pdf. This layout presents information on entertainment products, hardware products, software products. It is also available for immediate download and adjustment. So, changes can be made in the color, design, graphics or any other component to create a unique layout.

Financial Chart Showing Business Life Cycle Ppt PowerPoint Presentation Gallery Designs PDF
Introducing our financial chart showing business life cycle ppt powerpoint presentation gallery designs pdf set of slides. The topics discussed in these slides are sales, profits, business. This is an immediately available PowerPoint presentation that can be conveniently customized. Download it and convince your audience.
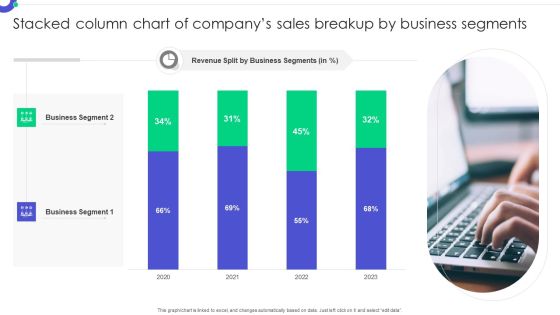
Stacked Column Chart Of Companys Sales Breakup By Business Segments Rules PDF
Pitch your topic with ease and precision using this Stacked Column Chart Of Companys Sales Breakup By Business Segments Rules PDF. This layout presents information on Business Segment, Revenue Split, Business Segments. It is also available for immediate download and adjustment. So, changes can be made in the color, design, graphics or any other component to create a unique layout.

Stacked Column Chart Of Product Sold By A Healthcare Company Download PDF
Pitch your topic with ease and precision using this Stacked Column Chart Of Product Sold By A Healthcare Company Download PDF. This layout presents information on Sales Split Products, Medical Product, Healthcare Company. It is also available for immediate download and adjustment. So, changes can be made in the color, design, graphics or any other component to create a unique layout.
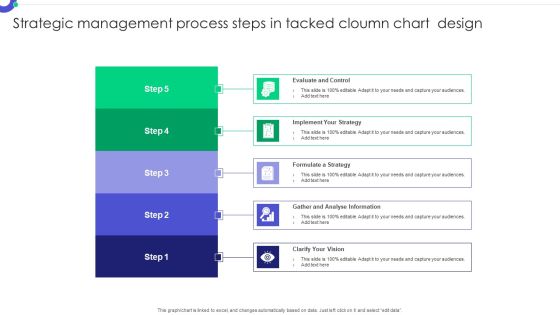
Strategic Management Process Steps In Tacked Cloumn Chart Design Pictures PDF
Pitch your topic with ease and precision using this Strategic Management Process Steps In Tacked Cloumn Chart Design Pictures PDF. This layout presents information on Evaluate Control, Implement Strategy, Formulate Strategy. It is also available for immediate download and adjustment. So, changes can be made in the color, design, graphics or any other component to create a unique layout.

Mobile Ad Budget With Actual State Chart Ppt PowerPoint Presentation Infographics Professional PDF
Presenting this set of slides with name mobile ad budget with actual state chart ppt powerpoint presentation infographics professional pdf. The topics discussed in these slides are mobile ad budget, mobile ad budget, actual state, high fill rate platform, ttl traffic, high fill rate, low fill rate. This is a completely editable PowerPoint presentation and is available for immediate download. Download now and impress your audience.

Data Driven Chart For Workers Turnover Assessment In Various Sectors Ppt PowerPoint Presentation Layouts Demonstration PDF
Presenting this set of slides with name data driven chart for workers turnover assessment in various sectors ppt powerpoint presentation layouts demonstration pdf. The topics discussed in these slides are share of workers quitting position annually, share of workers let go annually, leisure and hospitality, food services, manufacturing, construction. This is a completely editable PowerPoint presentation and is available for immediate download. Download now and impress your audience.
Donut Chart To Optimize Market Strategy Ppt PowerPoint Presentation Icon Designs Download PDF
Presenting this set of slides with name donut chart to optimize market strategy ppt powerpoint presentation icon designs download pdf. The topics discussed in these slides are enter markets, develop advertising materials, innovate, measure performance of products and or services, optimize market strategy, develop great products and services. This is a completely editable PowerPoint presentation and is available for immediate download. Download now and impress your audience.

Chart Showing Quarterly Product Sales By Various Vendors Ppt PowerPoint Presentation Professional Vector PDF
Pitch your topic with ease and precision using this chart showing quarterly product sales by various vendors ppt powerpoint presentation professional vector pdf. This layout presents information on number of products sold, region abc region, year 2020, product sales, supplier. It is also available for immediate download and adjustment. So, changes can be made in the color, design, graphics or any other component to create a unique layout.

Power Grid Statistics Chart For Year Over Year Analysis Ppt PowerPoint Presentation Show Model PDF
Pitch your topic with ease and precision using this power grid statistics chart for year over year analysis ppt powerpoint presentation show model pdf. This layout presents information on investments by distribution system operators, investments by transmission system operators, 2017 to 2020. It is also available for immediate download and adjustment. So, changes can be made in the color, design, graphics or any other component to create a unique layout.

Chart Showing Time And Business Impact Ppt PowerPoint Presentation Example 2015 PDF
Pitch your topic with ease and precision using this chart showing time and business impact ppt powerpoint presentation example 2015 pdf. This layout presents information on business impact mobilization, ramp up, steady state, time, conscious change, renewal, effort. It is also available for immediate download and adjustment. So, changes can be made in the color, design, graphics or any other component to create a unique layout.
Project Management Chart With Monitor And Control Ppt PowerPoint Presentation Summary Icons PDF
Pitch your topic with ease and precision using this project management chart with monitor and control ppt powerpoint presentation summary icons pdf. This layout presents information on executing, planning, monitor and control, closing, initiating, start, time, end. It is also available for immediate download and adjustment. So, changes can be made in the color, design, graphics or any other component to create a unique layout.
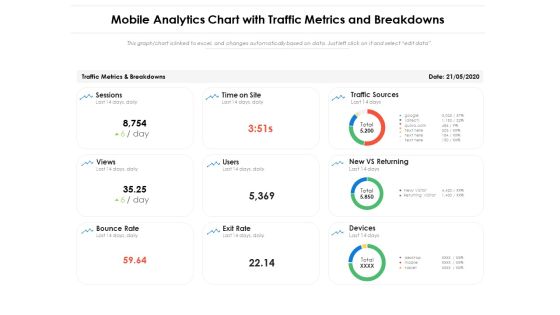
Mobile Analytics Chart With Traffic Metrics And Breakdowns Ppt PowerPoint Presentation Ideas Layout PDF
Pitch your topic with ease and precision using this mobile analytics chart with traffic metrics and breakdowns ppt powerpoint presentation ideas layout pdf. This layout presents information on traffic sources, new vs returning, devices, bounce rate, sessions. It is also available for immediate download and adjustment. So, changes can be made in the color, design, graphics or any other component to create a unique layout.

Famous Technology Trends Charts With Multichannel Analytics Ppt PowerPoint Presentation Ideas Graphics Tutorials PDF
Pitch your topic with ease and precision using this famous technology trends charts with multichannel analytics ppt powerpoint presentation ideas graphics tutorials pdf. This layout presents information on multichannel analytics, content marketing, paid media, social media marketing, email marketing . It is also available for immediate download and adjustment. So, changes can be made in the color, design, graphics or any other component to create a unique layout.
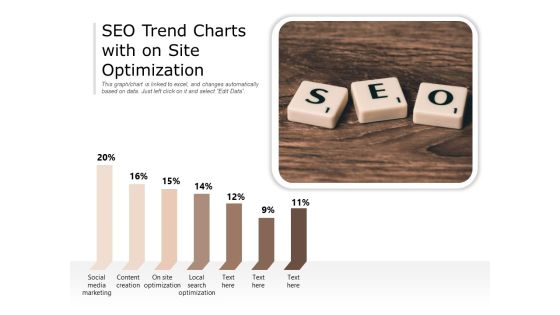
SEO Trend Charts With On Site Optimization Ppt PowerPoint Presentation Gallery Inspiration PDF
Pitch your topic with ease and precision using this seo trend charts with on site optimization ppt powerpoint presentation gallery inspiration pdf. This layout presents information on social media marketing, content creation, site optimization, local search optimization. It is also available for immediate download and adjustment. So, changes can be made in the color, design, graphics or any other component to create a unique layout.
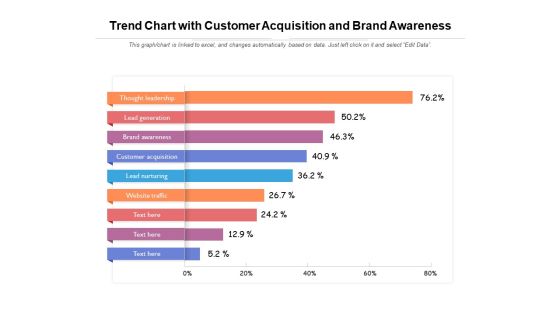
Trend Chart With Customer Acquisition And Brand Awareness Ppt PowerPoint Presentation Show Samples PDF
Pitch your topic with ease and precision using this trend chart with customer acquisition and brand awareness ppt powerpoint presentation show samples pdf. This layout presents information on thought leadership, lead generation, brand awareness, customer acquisition, lead nurturing. It is also available for immediate download and adjustment. So, changes can be made in the color, design, graphics or any other component to create a unique layout.
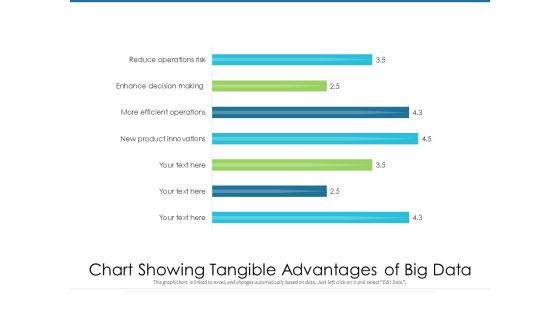
Chart Showing Tangible Advantages Of Big Data Ppt PowerPoint Presentation Infographics Clipart PDF
Pitch your topic with ease and precision using this chart showing tangible advantages of big data ppt powerpoint presentation infographics clipart pdf. This layout presents information on new product innovations, more efficient operations, enhance decision making, reduce operations risk. It is also available for immediate download and adjustment. So, changes can be made in the color, design, graphics or any other component to create a unique layout.

Chart Indicating United States Marine Corps Yearly Attrition Rate Ppt PowerPoint Presentation File Background Images PDF
Pitch your topic with ease and precision using this chart indicating united states marine corps yearly attrition rate ppt powerpoint presentation file background images pdf. This layout presents information on hart indicating united states marine corps yearly attrition rate. It is also available for immediate download and adjustment. So, changes can be made in the color, design, graphics or any other component to create a unique layout.

Budget Chart With Income And Expenditure Comparison Ppt PowerPoint Presentation Infographics Designs PDF
This slide illustrates graphical representation of income and expenditure of a company. It includes cashflow table with total income and total expense etc.Pitch your topic with ease and precision using this Budget Chart With Income And Expenditure Comparison Ppt PowerPoint Presentation Infographics Designs PDF. This layout presents information on Total Expense, Total Income, Total Cash. It is also available for immediate download and adjustment. So, changes can be made in the color, design, graphics or any other component to create a unique layout.

Bubble Chart Developing Employee Retention Techniques To Minimize Turnover Rate Background PDF
Make sure to capture your audiences attention in your business displays with our gratis customizable Bubble Chart Developing Employee Retention Techniques To Minimize Turnover Rate Background PDF. These are great for business strategies, office conferences, capital raising or task suggestions. If you desire to acquire more customers for your tech business and ensure they stay satisfied, create your own sales presentation with these plain slides.

Customised Advertising Strategies Area Chart Ppt PowerPoint Presentation File Background Designs PDF
Take your projects to the next level with our ultimate collection of Customised Advertising Strategies Area Chart Ppt PowerPoint Presentation File Background Designs PDF. Slidegeeks has designed a range of layouts that are perfect for representing task or activity duration, keeping track of all your deadlines at a glance. Tailor these designs to your exact needs and give them a truly corporate look with your own brand colors they will make your projects stand out from the rest.
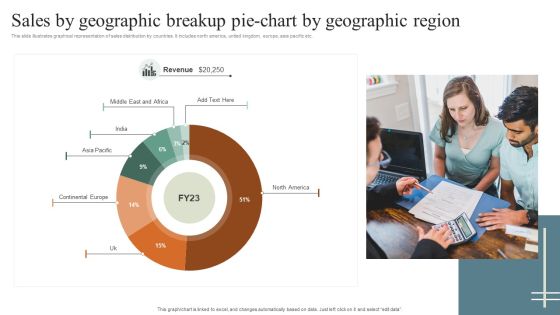
Sales By Geographic Breakup Pie Chart By Geographic Region Rules PDF
This slide illustrates graphical representation of sales distribution by countries. It includes north america, united kingdom, europe, asia pacific etc. Pitch your topic with ease and precision using this Sales By Geographic Breakup Pie Chart By Geographic Region Rules PDF. This layout presents information on Sales By Geographic, Geographic Region. It is also available for immediate download and adjustment. So, changes can be made in the color, design, graphics or any other component to create a unique layout.

Quarterly Non Profit Marketing Strategy For Fundraising Campaign Performance Chart Diagrams PDF
This slide depicts different strategies applied annually to gain investment for non profit organizations. It includes direct mail, event, e-mail, social media and content marketing tactics. Pitch your topic with ease and precision using this Quarterly Non Profit Marketing Strategy For Fundraising Campaign Performance Chart Diagrams PDF. This layout presents information on Marketing Strategies, Event Marketing, Social Media. It is also available for immediate download and adjustment. So, changes can be made in the color, design, graphics or any other component to create a unique layout.

Cost Scrum Kpis Chart And Key Statistics Ppt Layouts Example Introduction PDF
This slide illustrates graphical representation of cost scrum metrics. It provides Projected Hours per story and actual hours per story point and other key statistics. Pitch your topic with ease and precision using this Cost Scrum Kpis Chart And Key Statistics Ppt Layouts Example Introduction PDF. This layout presents information on Projected Hours, Cost Per Story, Metrics, Actual Cost. It is also available for immediate download and adjustment. So, changes can be made in the color, design, graphics or any other component to create a unique layout.
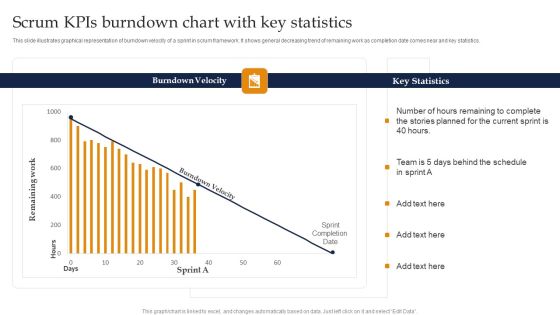
Scrum Kpis Burndown Chart With Key Statistics Ppt Pictures Visual Aids PDF
This slide illustrates graphical representation of burndown velocity of a sprint in scrum framework. It shows general decreasing trend of remaining work as completion date comes near and key statistics. Pitch your topic with ease and precision using this Scrum Kpis Burndown Chart With Key Statistics Ppt Pictures Visual Aids PDF. This layout presents information on Burndown Velocity, Key Statistics, Current Sprint. It is also available for immediate download and adjustment. So, changes can be made in the color, design, graphics or any other component to create a unique layout.

Construction Industry Market Share Chart Comparison Of Big Players Ppt Portfolio Shapes PDF
This slide shows the year over year market share comparison of major construction firms. It also illustrates that market share of brand B has increased by slight margin. Pitch your topic with ease and precision using this Construction Industry Market Share Chart Comparison Of Big Players Ppt Portfolio Shapes PDF. This layout presents information on Market Share Percentage, 2022 To 2023, Market Share. It is also available for immediate download and adjustment. So, changes can be made in the color, design, graphics or any other component to create a unique layout.
Revenue Chart Of Abc Bank Across Global Market Ppt Icon Images PDF
This slide illustrates information about revenue generated by ABC bank in last eight years across global market. Continuous digitalization is the main contributing factor for the same. Pitch your topic with ease and precision using this Revenue Chart Of Abc Bank Across Global Market Ppt Icon Images PDF. This layout presents information on Continuous Digitalization, 2016 To 2023, Revenue. It is also available for immediate download and adjustment. So, changes can be made in the color, design, graphics or any other component to create a unique layout.

Company Age Wise Employee Count Column Chart With Key Insights Microsoft PDF
This slide illustrates employee count by age to find the recruitment rate for company. It includes aspects such as the number of employees and age.Pitch your topic with ease and precision using this Company Age Wise Employee Count Column Chart With Key Insights Microsoft PDF. This layout presents information on Employees Working, Total Workforce, Require Replacement. It is also available for immediate download and adjustment. So, changes can be made in the color, design, graphics or any other component to create a unique layout.
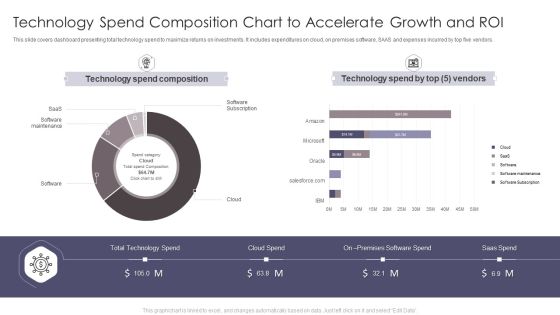
Technology Spend Composition Chart To Accelerate Growth And Roi Summary PDF
This slide covers dashboard presenting total technology spend to maximize returns on investments. It includes expenditures on cloud, on premises software, SAAS and expenses incurred by top five vendors. Pitch your topic with ease and precision using this Technology Spend Composition Chart To Accelerate Growth And Roi Summary PDF. This layout presents information on Technology Spend Composition, Technology Spend. It is also available for immediate download and adjustment. So, changes can be made in the color, design, graphics or any other component to create a unique layout.

Area Chart Employee Performance Management System To Enhance Workforce Productivity Ideas PDF
This Area Chart Employee Performance Management System To Enhance Workforce Productivity Ideas PDF from Slidegeeks makes it easy to present information on your topic with precision. It provides customization options, so you can make changes to the colors, design, graphics, or any other component to create a unique layout. It is also available for immediate download, so you can begin using it right away. Slidegeeks has done good research to ensure that you have everything you need to make your presentation stand out. Make a name out there for a brilliant performance.

Executing Automotive Marketing Tactics For Sales Boost Doughnut Chart Professional PDF
This Executing Automotive Marketing Tactics For Sales Boost Doughnut Chart Professional PDF from Slidegeeks makes it easy to present information on your topic with precision. It provides customization options, so you can make changes to the colors, design, graphics, or any other component to create a unique layout. It is also available for immediate download, so you can begin using it right away. Slidegeeks has done good research to ensure that you have everything you need to make your presentation stand out. Make a name out there for a brilliant performance.
Food Company Financial Performance Summary Historical Food Product Sales Chart Icons PDF
The following slide shows the comparative sales growth of agricultural products and processed foods. It shows the product sales from more than three decades to assess the change in demand of company products. This Food Company Financial Performance Summary Historical Food Product Sales Chart Icons PDF from Slidegeeks makes it easy to present information on your topic with precision. It provides customization options, so you can make changes to the colors, design, graphics, or any other component to create a unique layout. It is also available for immediate download, so you can begin using it right away. Slidegeeks has done good research to ensure that you have everything you need to make your presentation stand out. Make a name out there for a brilliant performance.
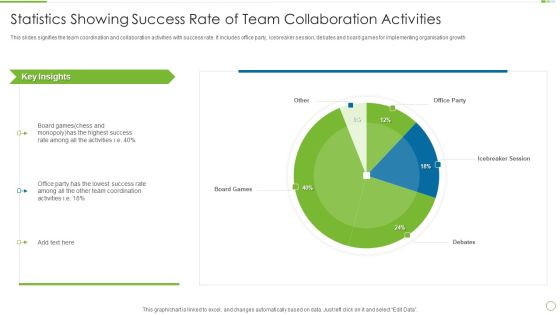
Statistics Showing Success Rate Of Team Collaboration Activities Information PDF
This slides signifies the team coordination and collaboration activities with success rate. It includes office party, icebreaker session, debates and board games for implementing organisation growth. Pitch your topic with ease and precision using this Statistics Showing Success Rate Of Team Collaboration Activities Information PDF This layout presents information on Highest Success, Lowest Success, Team Coordination It is also available for immediate download and adjustment. So, changes can be made in the color, design, graphics or any other component to create a unique layout.

Key Prioritization Techniques For Project Team Management Project Completion Gantt Chart Ppt PowerPoint Presentation Professional Visual Aids PDF
Presenting this set of slides with name key prioritization techniques for project team management project completion gantt chart ppt powerpoint presentation professional visual aids pdf. The topics discussed in these slides are project completion, gantt chart, key insights. This is a completely editable PowerPoint presentation and is available for immediate download. Download now and impress your audience.
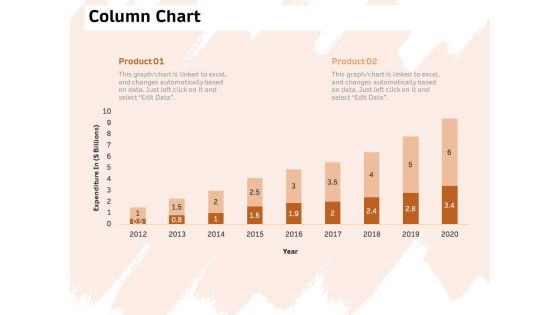
Investor Deck For Capital Generation From Substitute Funding Options Column Chart Ppt PowerPoint Presentation Infographics Background Image PDF
Presenting this set of slides with name investor deck for capital generation from substitute funding options column chart ppt powerpoint presentation infographics background image pdf. The topics discussed in these slide is column chart. This is a completely editable PowerPoint presentation and is available for immediate download. Download now and impress your audience.

Statistical Chart Showing Revenue From Export Of Tea And Coffee Ppt PowerPoint Presentation Gallery Background Image PDF
Presenting this set of slides with name statistical chart showing revenue from export of tea and coffee ppt powerpoint presentation gallery background image pdf. The topics discussed in these slides are export of tea, export of coffee. This is a completely editable PowerPoint presentation and is available for immediate download. Download now and impress your audience.
New Technologies Trend Chart With Internet Of Things And Cloud Computing Ppt PowerPoint Presentation Icon Slide PDF
Pitch your topic with ease and precision using this new technologies trend chart with internet of things and cloud computing ppt powerpoint presentation icon slide pdf. This layout presents information on bioengineering, cloud computing and services, mobile solutions, internet of things, cognitive computing. It is also available for immediate download and adjustment. So, changes can be made in the color, design, graphics or any other component to create a unique layout.

Chart Depicting Number Of Days Coronavirus Disease 19 Can Last On Various Surface Ppt PowerPoint Presentation Styles Example PDF
Pitch your topic with ease and precision using this chart depicting number of days coronavirus disease 19 can last on various surface ppt powerpoint presentation styles example pdf. This layout presents information on cardboard, stainless steel, limit of detection, more concentrated, confidence interval, plastic. It is also available for immediate download and adjustment. So, changes can be made in the color, design, graphics or any other component to create a unique layout.

Digital Marketing Project Administration And Employee Performance Guidelines PDF
Statistics presented in the following slide showcase project coordination and employees performance in marketing campaign. It is based on following tasks SEO, SCO, Email Campaign and Blog writing. Pitch your topic with ease and precision using this digital marketing project administration and employee performance guidelines pdf. This layout presents information on digital marketing project administration and employee performance. It is also available for immediate download and adjustment. So, changes can be made in the color, design, graphics or any other component to create a unique layout.
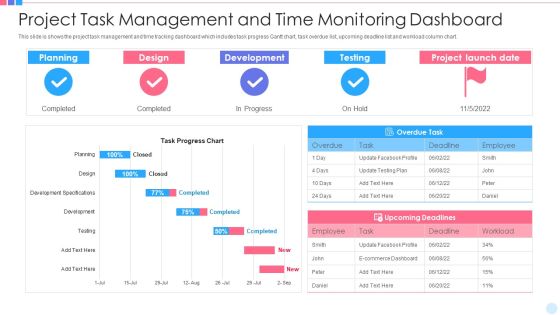
Project Task Management And Time Monitoring Dashboard Infographics PDF
This slide is shows the project task management and time tracking dashboard which includes task progress Gantt chart, task overdue list, upcoming deadline list and workload column chart. Pitch your topic with ease and precision using this project task management and time monitoring dashboard infographics pdf. This layout presents information on planning, design, development. It is also available for immediate download and adjustment. So, changes can be made in the color, design, graphics or any other component to create a unique layout.

Car Manufacturing Organization Executive Report Background PDF
This slide illustrate overview of organization that design, develop, manufacture and distribute automotive components. It includes elements such as overview, product, competitors, market share coverage, key facts, and sales growth chart. Pitch your topic with ease and precision using this Car Manufacturing Organization Executive Report Background PDF. This layout presents information on Competitors, Market Share Coverage, Sales Growth Chart. It is also available for immediate download and adjustment. So, changes can be made in the color, design, graphics or any other component to create a unique layout.

Fashion Clothing Brand Executive Report Download PDF
This slide illustrate descriptions of fashion and knitwear clothing brand that provide latest trend to end consumer. It includes elements such as overview, products, company stats, sales by geographical area, growth chart, CEO and founder. Pitch your topic with ease and precision using this Fashion Clothing Brand Executive Report Download PDF. This layout presents information on Sales Contribution, Geographical Area, Growth Chart. It is also available for immediate download and adjustment. So, changes can be made in the color, design, graphics or any other component to create a unique layout.

Annual Net Promoter Score Trends And Key Insights Professional PDF
This slide presents NPS trend over period of twelve months with important insights that highlight main reasons for changing scores based on pricing, usability, customer service and brand reputation. It includes chart showing changes in elements and trend chart for overall net promoter score each month Pitch your topic with ease and precision using this Annual Net Promoter Score Trends And Key Insights Professional PDF. This layout presents information on Key Insights, Score Trend, Detractors. It is also available for immediate download and adjustment. So, changes can be made in the color, design, graphics or any other component to create a unique layout.

Area Chat Finance Investment Ppt PowerPoint Presentation Model Information
Presenting this set of slides with name area chat finance investment ppt powerpoint presentation model information. The topics discussed in these slides are area chart, finance, marketing, analysis, investment. This is a completely editable PowerPoint presentation and is available for immediate download. Download now and impress your audience.

Doughnut Finance Marketing Ppt PowerPoint Presentation Portfolio Display
Presenting this set of slides with name doughnut finance marketing ppt powerpoint presentation portfolio display. The topics discussed in these slides are donut chart, finance, marketing, analysis, investment. This is a completely editable PowerPoint presentation and is available for immediate download. Download now and impress your audience.

Healthcare Management KPI Dashboard Showing Incident By Type Ppt PowerPoint Presentation Professional Graphics Example
Presenting this set of slides with name healthcare management kpi dashboard showing incident by type ppt powerpoint presentation professional graphics example. The topics discussed in these slides are area chart, finance, marketing, management, investment. This is a completely editable PowerPoint presentation and is available for immediate download. Download now and impress your audience.

Dashboard For Statistical Analysis Of Product Sales Ppt PowerPoint Presentation Infographics Graphics Pictures PDF
Presenting this set of slides with name dashboard for statistical analysis of product sales ppt powerpoint presentation infographics graphics pictures pdf. The topics discussed in these slides are sales chart, product. This is a completely editable PowerPoint presentation and is available for immediate download. Download now and impress your audience.
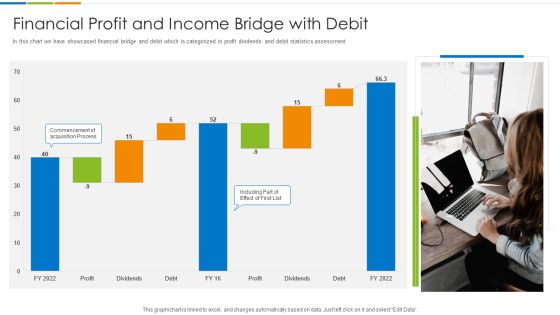
Financial Profit And Income Bridge With Debit Ppt PowerPoint Presentation File Outline PDF
In this chart we have showcased financial bridge and debit which is categorized in profit dividends and debit statistics assessment. Pitch your topic with ease and precision using this Financial Profit And Income Bridge With Debit Ppt PowerPoint Presentation File Outline PDF. This layout presents information on Profit Dividends, Debt Commencement, Acquisition Process. It is also available for immediate download and adjustment. So, changes can be made in the color, design, graphics or any other component to create a unique layout.
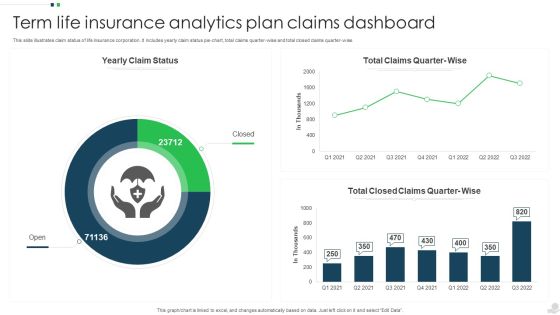
Term Life Insurance Analytics Plan Claims Dashboard Structure PDF
This slide illustrates claim status of life insurance corporation. It includes yearly claim status pie chart, total claims quarter-wise and total closed claims quarter wise. Pitch your topic with ease and precision using this Term Life Insurance Analytics Plan Claims Dashboard Structure PDF. This layout presents information on Insurance Analytics, Plan Claims Dashboard. It is also available for immediate download and adjustment. So, changes can be made in the color, design, graphics or any other component to create a unique layout.
Project Tracking And Evaluation Dashboard Portrait PDF
This slide illustrates graphical representation and facts and figures relating to project management data. It includes budget by employee, overdue tasks, workload charts etc. Pitch your topic with ease and precision using this Project Tracking And Evaluation Dashboard Portrait PDF. This layout presents information on Employee Budget, Target, Design, Development. It is also available for immediate download and adjustment. So, changes can be made in the color, design, graphics or any other component to create a unique layout.

Two Consecutive Years Revenue Comparison Topics PDF
This slide showcases profitability comparison with the help of a trend chart. It represents revenue, cost of goods sold, gross profit, net profit, etc. Pitch your topic with ease and precision using this Two Consecutive Years Revenue Comparison Topics PDF. This layout presents information on Revenue, Gross Profit, Net Income. It is also available for immediate download and adjustment. So, changes can be made in the color, design, graphics or any other component to create a unique layout.

Agile Team Member Customer Relationship Management Dashboard With Deals Funnel Mockup PDF
This slide illustrates graphical representation of CRM sales team member data. It includes pipeline, business components and activity level, categories etc. Pitch your topic with ease and precision using this Agile Team Member Customer Relationship Management Dashboard With Deals Funnel Mockup PDF. This layout presents information on Funnel Of Deals, Sent Campaigns Emails, Sales Chart. It is also available for immediate download and adjustment. So, changes can be made in the color, design, graphics or any other component to create a unique layout.
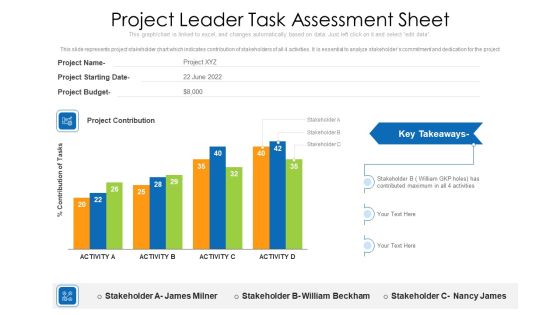
Project Leader Task Assessment Sheet Ppt PowerPoint Presentation Gallery Outline PDF
This slide represents project stakeholder chart which indicates contribution of stakeholders of all 4 activities. It is essential to analyze stakeholders commitment and dedication for the project. Pitch your topic with ease and precision using this project leader task assessment sheet ppt powerpoint presentation gallery outline pdf. This layout presents information on project leader task assessment sheet. It is also available for immediate download and adjustment. So, changes can be made in the color, design, graphics or any other component to create a unique layout.
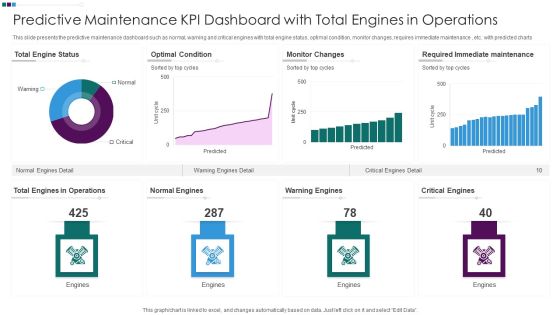
Predictive Maintenance KPI Dashboard With Total Engines In Operations Ppt Professional Inspiration PDF
This slide presents the predictive maintenance dashboard such as normal, warning and critical engines with total engine status, optimal condition, monitor changes, requires immediate maintenance , etc. with predicted charts. Pitch your topic with ease and precision using this Predictive Maintenance KPI Dashboard With Total Engines In Operations Ppt Professional Inspiration PDF. This layout presents information on Total Engine Status, Optimal Condition Monitor, Changes Warning Engines, Required Immediate Maintenance. It is also available for immediate download and adjustment. So, changes can be made in the color, design, graphics or any other component to create a unique layout.
