Bar Graph

Consulting Diagram Annual Financial Growth Graph Strategic Management
Analyze Ailments On Our Consulting Diagram Annual Financial Growth Graph Strategic Management Powerpoint Templates. Bring Out The Thinking Doctor In You. Dock Your Thoughts With Our Consulting Diagram Annual Financial Growth Graph Strategic Management Powerpoint Templates. They Will Launch Them Into Orbit.

Stakeholder Assessment Analysis Graph With Power And Interest Formats PDF
Deliver an awe-inspiring pitch with this creative stakeholder assessment analysis graph with power and interest formats pdf bundle. Topics like stakeholder assessment analysis graph with power and interest can be discussed with this completely editable template. It is available for immediate download depending on the needs and requirements of the user.
Staff Performance Evaluation Icon With Rising Graph Summary PDF
Presenting staff performance evaluation icon with rising graph summary pdf to dispense important information. This template comprises three stages. It also presents valuable insights into the topics including staff performance evaluation icon with rising graph. This is a completely customizable PowerPoint theme that can be put to use immediately. So, download it and address the topic impactfully.
Statistical Data Graph Icon Showing Financial Forecast Rules PDF
Presenting statistical data graph icon showing financial forecast rules pdf to dispense important information. This template comprises four stages. It also presents valuable insights into the topics including statistical data graph icon showing financial forecast. This is a completely customizable PowerPoint theme that can be put to use immediately. So, download it and address the topic impactfully.
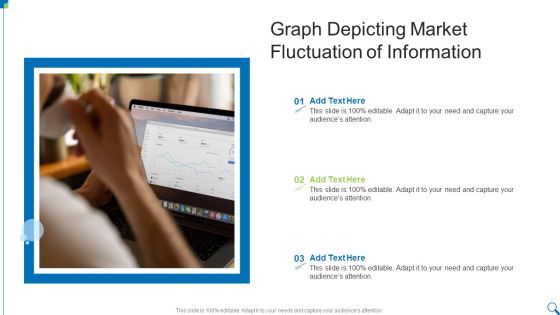
Graph Depicting Market Fluctuation Of Information Guidelines PDF
Presenting Graph Depicting Market Fluctuation Of Information Guidelines PDF to dispense important information. This template comprises three stages. It also presents valuable insights into the topics including Graph Depicting, Market Fluctuation, Information This is a completely customizable PowerPoint theme that can be put to use immediately. So, download it and address the topic impactfully.

Business Plan Sprint Review Icon With Graph Themes PDF
Presenting Business Plan Sprint Review Icon With Graph Themes PDF to dispense important information. This template comprises four stages. It also presents valuable insights into the topics including Review Icon With Graph, Business Plan Sprint. This is a completely customizable PowerPoint theme that can be put to use immediately. So, download it and address the topic impactfully.

Doughnut Graph Icon Highlighting IT Team Structure Structure PDF
Presenting Doughnut Graph Icon Highlighting IT Team Structure Structure PDF to dispense important information. This template comprises four stages. It also presents valuable insights into the topics including Doughnut Graph, Icon Highlighting, IT Team Structure. This is a completely customizable PowerPoint theme that can be put to use immediately. So, download it and address the topic impactfully.
Graph Comparison Icon For Liquidity Financial Ratios Analysis Summary PDF
Presenting Graph Comparison Icon For Liquidity Financial Ratios Analysis Summary PDF to dispense important information. This template comprises Three stages. It also presents valuable insights into the topics including Graph Comparison, Icon For Liquidity, Financial Ratios Analysis. This is a completely customizable PowerPoint theme that can be put to use immediately. So, download it and address the topic impactfully.
Financial Yearly Forecast Icon With Graph And Checklist Summary PDF
Presenting Financial Yearly Forecast Icon With Graph And Checklist Summary PDF to dispense important information. This template comprises Three stages. It also presents valuable insights into the topics including Financial Yearly Forecast, Graph And Checklist . This is a completely customizable PowerPoint theme that can be put to use immediately. So, download it and address the topic impactfully.
ITIL Demand Management Growth Graph Icon Rules PDF
Presenting ITIL Demand Management Growth Graph Icon Rules PDF to dispense important information. This template comprises three stages. It also presents valuable insights into the topics including Itil Demand Management, Growth Graph Icon. This is a completely customizable PowerPoint theme that can be put to use immediately. So, download it and address the topic impactfully.

Cloud System Checking Monitoring With Graph Icon Mockup PDF
Presenting Cloud System Checking Monitoring With Graph Icon Mockup PDF to dispense important information. This template comprises three stages. It also presents valuable insights into the topics including Cloud System Checking, Monitoring With Graph Icon. This is a completely customizable PowerPoint theme that can be put to use immediately. So, download it and address the topic impactfully.
Industry Decline And Recession Graph Icon Ideas PDF
Presenting Industry Decline And Recession Graph Icon Ideas PDF to dispense important information. This template comprises three stages. It also presents valuable insights into the topics including Industry Decline, Recession Graph Icon. This is a completely customizable PowerPoint theme that can be put to use immediately. So, download it and address the topic impactfully.
Managers Self Advancement Plan Icon With Graph Guidelines PDF
Presenting Managers Self Advancement Plan Icon With Graph Guidelines PDF to dispense important information. This template comprises four stages. It also presents valuable insights into the topics including Managers Self Advancement, Plan Icon With Graph. This is a completely customizable PowerPoint theme that can be put to use immediately. So, download it and address the topic impactfully.

Car Types Used In Usa Stacked Percentage Graph Sample PDF
This slide shows car use percentage chart in USA to compare vehicle buying decisions. It includes types of cars and car use percentage. Pitch your topic with ease and precision using this Car Types Used In Usa Stacked Percentage Graph Sample PDF. This layout presents information on Limited Space In City, Less Parking Space, Easy To Commute. It is also available for immediate download and adjustment. So, changes can be made in the color, design, graphics or any other component to create a unique layout.

Ppt Linear Abstraction Arrow Animated Graph PowerPoint 2007 Templates
PPT linear abstraction arrow animated graph powerpoint 2007 Templates-Use this diagram to show a progression or sequential steps in a task, process, or workflow. They help to lay the base of your trend of thought and enhance the essence of your viable ideas. Create captivating presentations to deliver comparative and weighted arguments.-PPT linear abstraction arrow animated graph powerpoint 2007 Templates-analysis, arrow, background, business, chart, communication, concept, construction, delivery, design, development, engineering, fabrication, feasibiliti, generated, growth, idea, industry, making, production, products, science, sequence, shape
Straight Line Graph Ppt PowerPoint Presentation Visual Aids Inspiration Cpb
Presenting this set of slides with name straight line graph ppt powerpoint presentation visual aids inspiration cpb. This is an editable Powerpoint three stages graphic that deals with topics like straight line graph to help convey your message better graphically. This product is a premium product available for immediate download and is 100 percent editable in Powerpoint. Download this now and use it in your presentations to impress your audience.
Harvey Ball Graph Ppt PowerPoint Presentation Complete Deck With Slides
If designing a presentation takes a lot of your time and resources and you are looking for a better alternative, then this Harvey Ball Graph Ppt PowerPoint Presentation Complete Deck With Slides is the right fit for you. This is a prefabricated set that can help you deliver a great presentation on the topic. All the Twelve slides included in this sample template can be used to present a birds eye view of the topic. These slides are also fully editable, giving you enough freedom to add specific details to make this layout more suited to your business setting. Apart from the content, all other elements like color, design, theme are also replaceable and editable. This helps in designing a variety of presentations with a single layout. Not only this, you can use this PPT design in formats like PDF, PNG, and JPG once downloaded. Therefore, without any further ado, download and utilize this sample presentation as per your liking.

Clustered Column Line Graph Ppt PowerPoint Presentation Ideas Demonstration
This is a clustered column line graph ppt powerpoint presentation ideas demonstration. This is a three stage process. The stages in this process are financial, minimum, maximum, marketing, strategy.

Clustered Column Line Graph Ppt PowerPoint Presentation File Clipart
This is a clustered column line graph ppt powerpoint presentation file clipart. This is a three stage process. The stages in this process are finance, marketing, management, investment, analysis.

Clustered Column Line Graph Ppt PowerPoint Presentation Inspiration Deck
This is a clustered column line graph ppt powerpoint presentation inspiration deck. This is a three stage process. The stages in this process are finance, marketing, analysis, investment, million.

Graph Important Concept Diagram Business Plan Template PowerPoint Templates
We present our graph important concept diagram business plan template PowerPoint templates.Use our Arrows PowerPoint Templates because Watching this your Audience will Grab their eyeballs, they wont even blink. Present our Finance PowerPoint Templates because Our PowerPoint Templates and Slides will Activate the energies of your audience. Get their creative juices flowing with your words. Download our Marketing PowerPoint Templates because Our PowerPoint Templates and Slides are topically designed to provide an attractive backdrop to any subject. Use our Signs PowerPoint Templates because Our PowerPoint Templates and Slides are specially created by a professional team with vast experience. They diligently strive to come up with the right vehicle for your brilliant Ideas. Use our Business PowerPoint Templates because It will get your audience in sync.Use these PowerPoint slides for presentations relating to chart, bar, data, pie, percent, forecasting, economy, white, achievement, future, business, arrow, sign, line, symbol, diagram, styles, finance, stock, report, marketing, gray, analyzing, shape, abstract, graph, modern, economic, up, money, solution, design, making, growth, moving, grid, progress, artistic, profit, inspiration, background, investment, successful, financial, concepts, structure, ideas. The prominent colors used in the PowerPoint template are Blue, Green, Black.
Line Graph Icon Representing Growth In Internet Trend Rules PDF
Persuade your audience using this Line Graph Icon Representing Growth In Internet Trend Rules PDF This PPT design covers Four stages, thus making it a great tool to use. It also caters to a variety of topics including Line Graph, Icon Representing, Growth Internet Trend Download this PPT design now to present a convincing pitch that not only emphasizes the topic but also showcases your presentation skills.
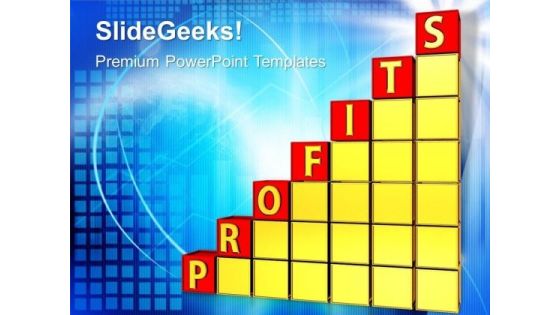
Business Profit Graph PowerPoint Templates And PowerPoint Themes 1012
Business Profit Graph PowerPoint Templates And PowerPoint Themes 1012-Create stunning Microsoft office PPT Presentations with our professional templates containing a graphic of success chart. This PowerPoint template shows the increasing graph with each letter of Success on each step. This template portrays the concepts of winning, leadership, finance, success, competition, sports, business, shapes, people and abstract. Present your views using our innovative slides and be assured of leaving a lasting impression.-Business Profit Graph PowerPoint Templates And PowerPoint Themes 1012-This PowerPoint template can be used for presentations relating to-Success profit chart graphic, business, finance, success, money, marketing

Money Graph Business PowerPoint Templates And PowerPoint Themes 1012
Money Graph Business PowerPoint Templates And PowerPoint Themes 1012-Visually support your Microsoft office PPT Presentation with our above template illustrating rising money chart. This image has been professionally designed to emphasize the business success concept. Our unique image makes your presentations professional showing that you care about even the smallest details. The structure of our templates allows you to effectively highlight the key issues concerning the growth of your business.-Money Graph Business PowerPoint Templates And PowerPoint Themes 1012-This PowerPoint template can be used for presentations relating to-Money graph, business, success, finance, money, marketing
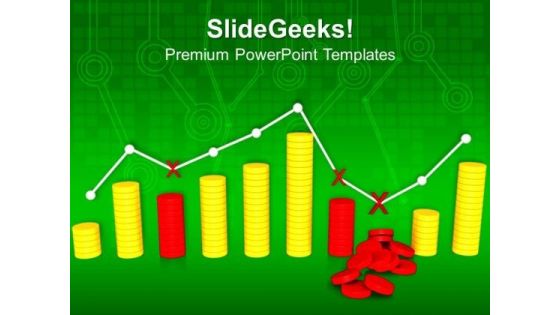
Graph With Business Fluctuations PowerPoint Templates And PowerPoint Themes 1012
Graph With Business Fluctuations PowerPoint Templates And PowerPoint Themes 1012-Emphatically define your message with our above template which contains a graphic of stack of coins with business graph showing fluctuations. This image represents the concept of business failure and success. Use this template for Business and Marketing purposes. The structure of our templates allows you to effectively highlight the key issues concerning the growth of your business.-Graph With Business Fluctuations PowerPoint Templates And PowerPoint Themes 1012-This PowerPoint template can be used for presentations relating to-Graph with fluctuations, business, finance, success, marketing, leadership

Percentage Graph Progress Business PowerPoint Templates And PowerPoint Themes 1012
Percentage Graph Progress Business PowerPoint Templates And PowerPoint Themes 1012-Using This Beautiful PowerPoint Template you will be able to illustrate the Growth, Progress, development, advancement, improvement, evolution, headway, steps forward, movement, evolvement etc. Our template will help pinpoint their viability. Refine them all as you take them through the numerous filtering stages of the funnel of your quality control process.-Percentage Graph Progress Business PowerPoint Templates And PowerPoint Themes 1012-This PowerPoint template can be used for presentations relating to-Graph Percent Going Up, Success, Business, Finance, Marketing, Money
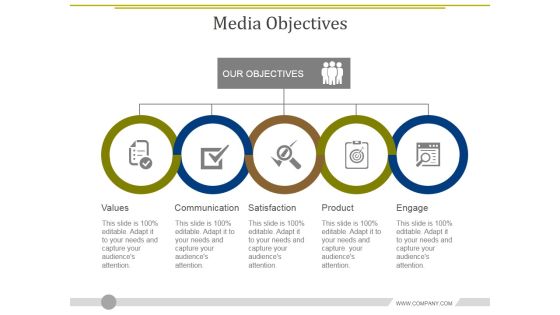
Media Objectives Template 2 Ppt PowerPoint Presentation Diagram Graph Charts
This is a media objectives template 2 ppt powerpoint presentation diagram graph charts. This is a five stage process. The stages in this process are values, communication, satisfaction, product, engage.
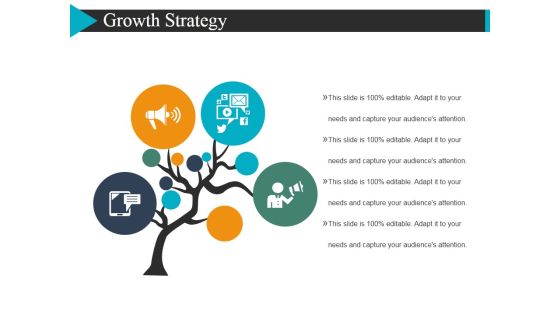
Growth Strategy Template 2 Ppt Powerpoint Presentation Diagram Graph Charts
This is a growth strategy template 2 ppt powerpoint presentation diagram graph charts. This is a four stage process. The stages in this process are tree, marketing, business, icons.
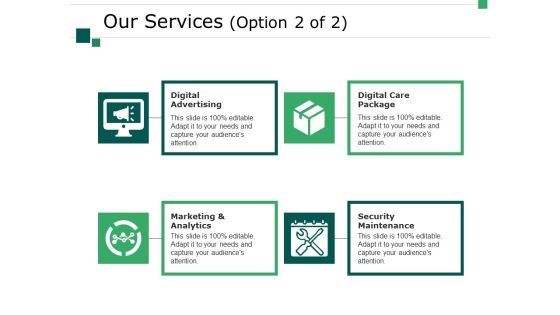
Our Services Template 2 Ppt PowerPoint Presentation Diagram Graph Charts
This is a our services template 2 ppt powerpoint presentation diagram graph charts. This is a four stage process. The stages in this process are business, digital advertising, digital care package, security maintenance, marketing and analytics, marketing, icons.

Scatter Bubble Chart Graph Ppt PowerPoint Presentation Infographic Template Maker
This is a scatter bubble chart graph ppt powerpoint presentation infographic template maker. This is a two stage process. The stages in this process are finance, marketing, management, investment, analysis.

Combo Chart Graph Ppt PowerPoint Presentation Infographic Template Layout Ideas
This is a combo chart graph ppt powerpoint presentation infographic template layout ideas. This is a three stage process. The stages in this process are finance, marketing, analysis, investment, million.
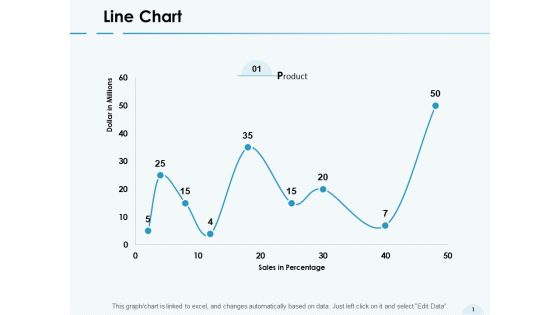
Line Chart Graph Ppt PowerPoint Presentation Gallery Structure
Presenting this set of slides with name line chart graph ppt powerpoint presentation gallery structure. The topics discussed in these slides are marketing, business, management, planning, strategy. This is a completely editable PowerPoint presentation and is available for immediate download. Download now and impress your audience.
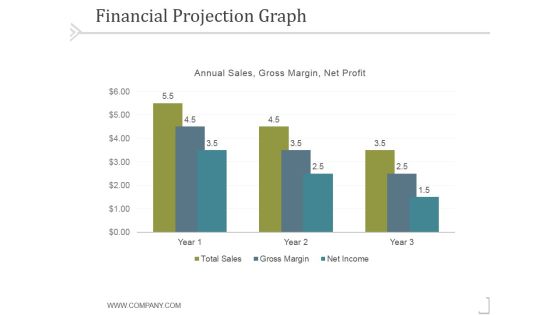
Financial Projection Graph Template 2 Ppt PowerPoint Presentation Template
This is a financial projection graph template 2 ppt powerpoint presentation template. This is a three stage process. The stages in this process are business, strategy, marketing, success, analysis.

Graph Demand Supply Ppt PowerPoint Presentation Layouts Design Templates Cpb
Presenting this set of slides with name graph demand supply ppt powerpoint presentation layouts design templates cpb. This is an editable Powerpoint six stages graphic that deals with topics like graph demand supply to help convey your message better graphically. This product is a premium product available for immediate download and is 100 percent editable in Powerpoint. Download this now and use it in your presentations to impress your audience.

Percentage Graph Finance PowerPoint Templates And PowerPoint Themes 0512
Microsoft Powerpoint Templates and Background with growing percents-These templates can be used for presentations relating to-Growing percent sales, business, finance, marketing, money, success-Percentage Graph Finance PowerPoint Templates And PowerPoint Themes 0512
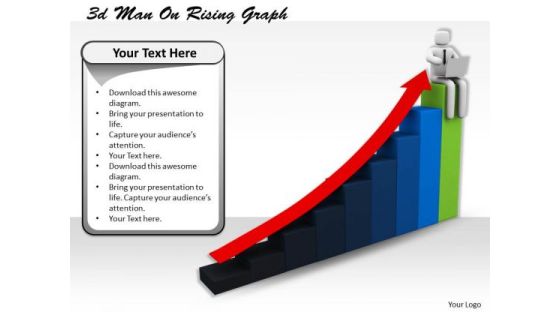
Business Development Strategy Template 3d Man On Rising Graph Characters
Establish The Dominance Of Your Ideas. Our Business Development Strategy Template 3d Man On Rising Graph Characters Powerpoint Templates Will Put Them On Top. Put Yourself In A Dominant Position. Our Arrows Powerpoint Templates Will Confirm Your Superiority.
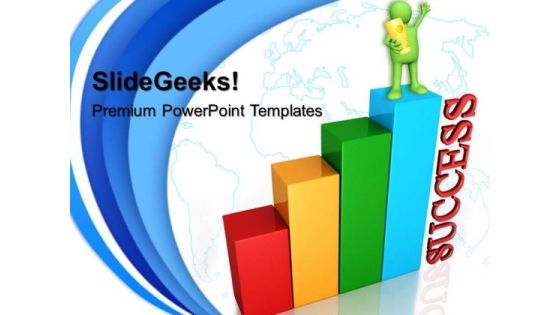
Global Graph Success PowerPoint Templates And PowerPoint Themes 0512
Microsoft Powerpoint Templates and Background with success-Global Graph Success PowerPoint Templates And PowerPoint Themes 0512-These PowerPoint designs and slide layouts can be used for themes relating to -Success, business, shapes, marketing, sales, finance, shapes

Success Graph Business PowerPoint Templates And PowerPoint Themes 0512
Microsoft Powerpoint Templates and Background with success-Success Graph Business PowerPoint Templates And PowerPoint Themes 0512-These PowerPoint designs and slide layouts can be used for themes relating to -Success, business, shapes, marketing, handshake, finance
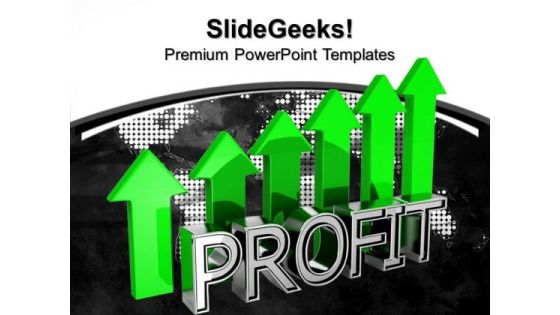
Profit Graph Business PowerPoint Templates And PowerPoint Themes 0912
Profit Graph Business PowerPoint Templates And PowerPoint Themes 0912-Microsoft Powerpoint Templates and Background with arrows pointing up business and financial growth concept-Arrows pointing up business and financial growth concept, business, arrows, success, finance, targets

Business Diagram Creative Graph For Business Reports Presentation Template
Download this diagram to display planning and analysis concepts. This business diagram contains the graphic of creative graph for business reports. Use this template to highlight the key issues of your presentation.
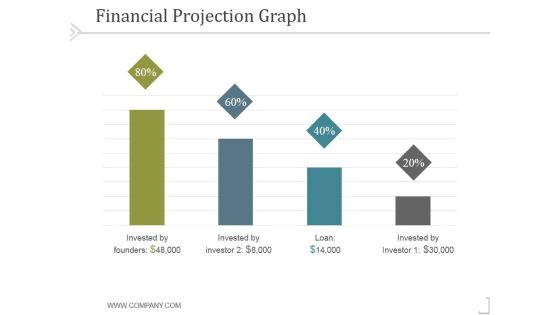
Financial Projection Graph Template 1 Ppt PowerPoint Presentation Model
This is a financial projection graph template 1 ppt powerpoint presentation model. This is a four stage process. The stages in this process are business, strategy, marketing, success, analysis.

Financial Projection Graph Template 1 Ppt PowerPoint Presentation Graphics
This is a financial projection graph template 1 ppt powerpoint presentation graphics. This is a three stage process. The stages in this process are annual sales, business, management, marketing, strategy.

Financial Projection Graph Template 2 Ppt PowerPoint Presentation Ideas
This is a financial projection graph template 2 ppt powerpoint presentation ideas. This is a nine stage process. The stages in this process are annual sales, business, management, marketing, strategy.

Financial Projection Graph Template 1 Ppt PowerPoint Presentation Clipart
This is a financial projection graph template 1 ppt powerpoint presentation clipart. This is a three stage process. The stages in this process are annual, sales, forecast, finance, marketing.
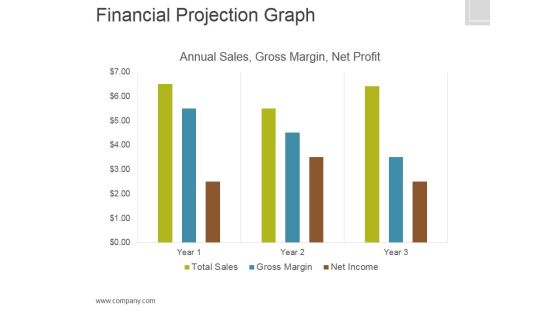
Financial Projection Graph Template 2 Ppt PowerPoint Presentation Graphics
This is a financial projection graph template 2 ppt powerpoint presentation graphics. This is a three stage process. The stages in this process are annual sales, gross margin, net profit, finance.

Price Quality Relationship Graph Ppt PowerPoint Presentation Show Design Templates
This is a price quality relationship graph ppt powerpoint presentation show design templates. This is a two stage process. The stages in this process are cost benefit analysis, cost benefit investigation, cost benefit examination.

Marketing Management Dashboard Graph Ppt PowerPoint Presentation Infographic Template Portfolio
This is a marketing management dashboard graph ppt powerpoint presentation infographic template portfolio. The topics discussed in this diagram are marketing, business, management, planning, strategy This is a completely editable PowerPoint presentation, and is available for immediate download.

Graph Clustering 2d PowerPoint Slides And Ppt Diagram Templates
Graph Clustering 2D PowerPoint Slides And PPT Diagram Templates-These high quality, editable pre-designed powerpoint slides have been carefully created by our professional team to help you impress your audience. Each graphic in every slide is vector based and is 100% editable in powerpoint. Each and every property of any slide - color, size, shading etc can be modified to build an effective powerpoint presentation. Use these slides to convey complex business concepts in a simplified manner. Any text can be entered at any point in the powerpoint slide. Simply DOWNLOAD, TYPE and PRESENT!

Business Strategy Concepts 3d Man Sitting Graph Statement
Touch Base With Our business strategy concepts 3d man sitting graph statement Powerpoint Templates. Review Your Growth With Your Audience. Take A Deep Dive With Our Finance Powerpoint Templates. Get Into The Nitti Gritty Of It All.
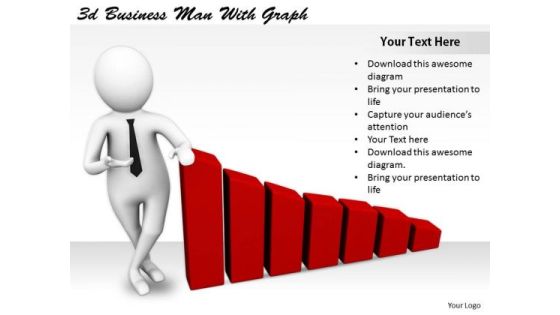
Company Business Strategy 3d Man With Graph Characters
Ace A Drive Into Unknown Territory. Our company business strategy 3d man with graph characters Powerpoint Templates Will Provide The Co Ordinates. Drive Out Of Difficulty With Our Finance Powerpoint Templates. They Will Steer You To Safety.

Business And Strategy 3d Man On Growth Graph Character
Analyze Ailments On Our Business And Strategy 3d Man On Growth Graph Character Powerpoint Templates. Bring Out The Thinking Doctor In You. Dock Your Thoughts With Our People Powerpoint Templates. They Will Launch Them Into Orbit.
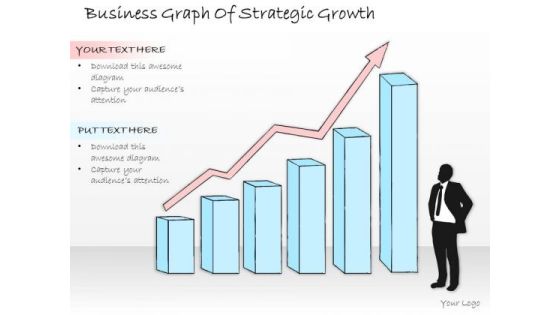
Ppt Slide Business Graph Of Strategic Growth Diagrams
Our PPT Slide Business Graph Of Strategic Growth Diagrams Powerpoint Templates Abhor Doodling. They Never Let The Interest Flag. Our Business Diagrams Powerpoint Templates Make Good Beasts Of Burden. Place All Your Demands On Them.

Ppt Slide Graph Of Product Lifecycle Marketing Plan
Delight Them With Our PPT Slide Graph Of Product Lifecycle Marketing Plan Powerpoint Templates. Your Audience Will Be Ecstatic. Our Sales Plan Powerpoint Templates Are Created Cost Effective. They Understand The Need For Economy.
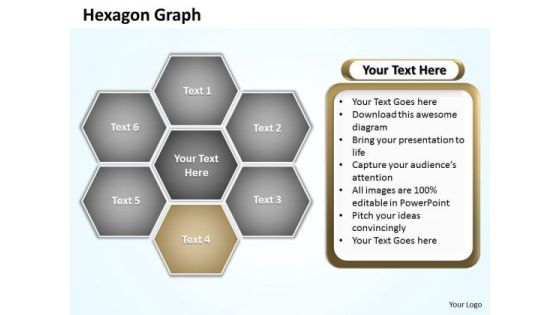
Ppt Hexagon Shapes Graph Editable PowerPoint Templates 2010
PPT hexagon shapes graph editable powerpoint templates 2010-Use this diagram to show the relationship to a central idea. Emphasizes both information in the center hexagon and how information in the outer hexagons contributes to the central idea. Transmit your thoughts via this slide and prod your team to action-PPT hexagon shapes graph editable powerpoint templates 2010-Abstract, Background, Design, Digital, Elements, Graphic, Grey, Hexagon, Illustration, Light, Modern, Perspective, Triangles, Shapes, Shiny, Style, Technology, Template, Vector, Vertical, Virtual, Wallpaper, Web

Growth Graph With Arrow On Target Board Powerpoint Slides
This PowerPoint template is useful for making presentations on business goals and strategy formation. This PPT background has a design of growth graph with arrow on target. This PPT slide is suitable for topics like corporate strategic planning.
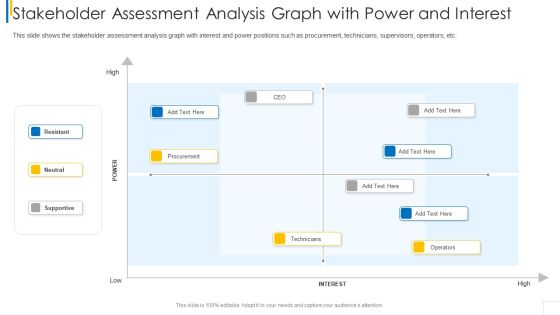
Stakeholder Assessment Analysis Graph With Power And Interest Ideas PDF
This slide shows the stakeholder assessment analysis graph with interest and power positions such as procurement, technicians, supervisors, operators, etc.Deliver an awe inspiring pitch with this creative stakeholder assessment analysis graph with power and interest ideas pdf bundle. Topics like resistant, neutral, supportive, procurement, technicians can be discussed with this completely editable template. It is available for immediate download depending on the needs and requirements of the user.
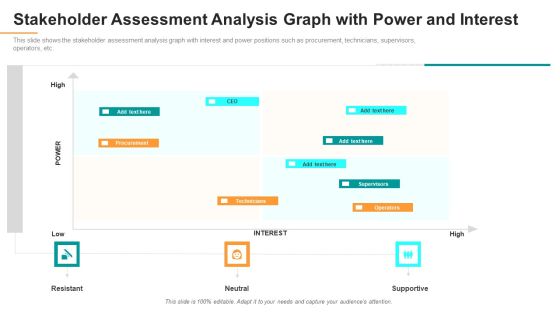
Stakeholder Assessment Analysis Graph With Power And Interest Introduction PDF
This slide shows the stakeholder assessment analysis graph with interest and power positions such as procurement, technicians, supervisors, operators, etc. Deliver and pitch your topic in the best possible manner with this stakeholder assessment analysis graph with power and interest introduction pdf. Use them to share invaluable insights on technicians, operators, interest and impress your audience. This template can be altered and modified as per your expectations. So, grab it now.

Knowledge On Our Competitors Ppt PowerPoint Presentation Diagram Graph Charts
This is a knowledge on our competitors ppt powerpoint presentation diagram graph charts. This is a six stage process. The stages in this process are services, strategy, quality, prices, other.
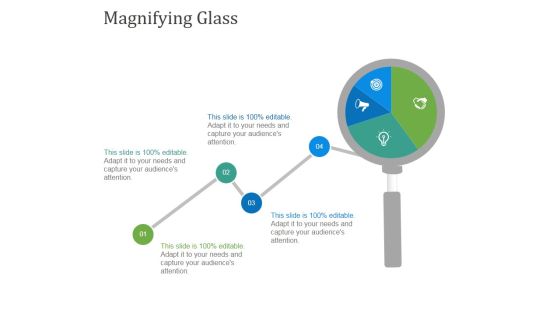
Magnifying Glass Ppt PowerPoint Presentation Diagram Graph Charts
This is a magnifying glass ppt powerpoint presentation diagram graph charts. This is a one stage process. The stages in this process are magnifying glass, planning, marketing, business, management, strategy.

Our Goal Ppt PowerPoint Presentation Diagram Graph Charts
This is a our goal ppt powerpoint presentation diagram graph charts. This is a three stage process. The stages in this process are trust and sincerity, reliability, commitment and dedication.

 Home
Home