Bar Graph

Business Loss Graph Finance PowerPoint Templates And PowerPoint Themes 0812
Business Loss Graph Finance PowerPoint Templates And PowerPoint Themes 0812-Microsoft Powerpoint Templates and Background with upset person showing loss graph
Upward Arrow Dollar Graph PowerPoint Templates And PowerPoint Themes 0812
Upward Arrow Dollar Graph PowerPoint Templates And PowerPoint Themes 0812-Microsoft Powerpoint Templates and Background with upward arrow dollar graph

Career Graph Growth Success PowerPoint Templates And PowerPoint Themes 0812
Career Graph Growth Success PowerPoint Templates And PowerPoint Themes 0812-Microsoft Powerpoint Templates and Background with career graph growth

Failure Finance Graph Business PowerPoint Templates And PowerPoint Themes 0812
Failure Finance Graph Business PowerPoint Templates And PowerPoint Themes 0812-Microsoft Powerpoint Templates and Background with business graph with failure

Graph Profit Concept Business PowerPoint Templates And PowerPoint Themes 0812
Graph Profit Concept Business PowerPoint Templates And PowerPoint Themes 0812-Microsoft Powerpoint Templates and Background with graph profit concept

Graph With Image Globe PowerPoint Templates And PowerPoint Themes 0812
Graph With Image Globe PowerPoint Templates And PowerPoint Themes 0812-Microsoft Powerpoint Templates and Background with graph and globe on top

Loss Graph Business PowerPoint Templates And PowerPoint Themes 0812
Loss Graph Business PowerPoint Templates And PowerPoint Themes 0812-Microsoft Powerpoint Templates and Background with loss graph business

Profit Graph Cylinders PowerPoint Templates And PowerPoint Themes 0812
Profit Graph Cylinders PowerPoint Templates And PowerPoint Themes 0812-Microsoft Powerpoint Templates and Background with cylinders graph business growth concept
Business Graph Growth Success PowerPoint Templates And PowerPoint Themes 0812
Business Graph Growth Success PowerPoint Templates And PowerPoint Themes 0812-Microsoft Powerpoint Templates and Background with business graph growth

Business Graph Growth Success PowerPoint Templates And PowerPoint Themes 0912
Business Graph Growth Success PowerPoint Templates And PowerPoint Themes 0912-Microsoft Powerpoint Templates and Background with business graph growth

Handle Project Escalations Gantt Chart With Project Progress Bar Ppt Layouts Graphics Design PDF
This slide provides the glimpse about the project progress bar graph in gantt chart form which covers the general release, open and closed beta and development. Introducing our handle project escalations gantt chart with project progress bar ppt layouts graphics design pdf that is designed to showcase some of the vital components that will help you create timelines, roadmaps, and project plans. In addition, also communicate your project durations, milestones, tasks, subtasks, dependencies, and other attributes using this well structured handle project escalations gantt chart with project progress bar ppt layouts graphics design pdf template. You can also exhibit preeminence against time by deploying this easily adaptable slide to your business presentation. Our experts have designed this template in such a way that it is sure to impress your audience. Thus, download it and steer your project meetings, meetups, and conferences.
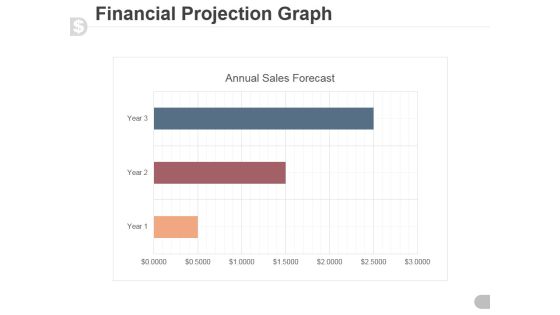
Financial Projection Graph Template 2 Ppt PowerPoint Presentation Samples
This is a financial projection graph template 2 ppt powerpoint presentation samples. This is a three stage process. The stages in this process are annual sales forecast, timeline, marketing, graph, management.

Plotting Line Graph Ppt Powerpoint Presentation Styles Maker
This is a plotting line graph ppt powerpoint presentation styles maker. This is a five stage process. The stages in this process are scatter plot, probability plots, plot diagram.

Budget Performance Comparison Graph For Project Planning Pictures PDF
This slide covers comparison graph of revenue generation in financial management of project. Showcasing this set of slides titled budget performance comparison graph for project planning pictures pdf. The topics addressed in these templates are budget performance comparison graph for project planning. All the content presented in this PPT design is completely editable. Download it and make adjustments in color, background, font etc. as per your unique business setting.

Monthly Sales Volume Report With Graph Demonstration PDF
The following slide highlights the monthly sales volume report with graph illustrating key headings which includes sales report, current month sales volume and current month volume vs last month volume. Showcasing this set of slides titled Monthly Sales Volume Report With Graph Demonstration PDF. The topics addressed in these templates are Monthly Sales, Volume Report, Graph. All the content presented in this PPT design is completely editable. Download it and make adjustments in color, background, font etc. as per your unique business setting.
Lego Profit Graph Business PowerPoint Templates And PowerPoint Themes 0512
Microsoft Powerpoint Templates and Background with Profit Graph made out of lego blocks
Bar Chart Positive Growth Finance PowerPoint Templates Ppt Backgrounds For Slides 0413
We present our Bar Chart Positive Growth Finance PowerPoint Templates PPT Backgrounds For Slides 0413.Use our Arrows PowerPoint Templates because Our PowerPoint Templates and Slides team portray an attitude of elegance. Personify this quality by using them regularly. Use our Success PowerPoint Templates because They will bring a lot to the table. Their alluring flavours will make your audience salivate. Download our Signs PowerPoint Templates because Our PowerPoint Templates and Slides will Embellish your thoughts. They will help you illustrate the brilliance of your ideas. Download our Shapes PowerPoint Templates because Our PowerPoint Templates and Slides are conceived by a dedicated team. Use them and give form to your wondrous ideas. Present our Finance PowerPoint Templates because You are an avid believer in ethical practices. Highlight the benefits that accrue with our PowerPoint Templates and Slides.Use these PowerPoint slides for presentations relating to Bar graph growth, arrows, success, signs, finance, shapes. The prominent colors used in the PowerPoint template are Green, Red, Yellow.

Approach Avoidance Conflict Gantt Chart With Project Progress Bar Topics PDF
This slide provides the glimpse about the project progress bar graph in gantt chart form which covers the general release, open and closed beta and development. Your complex projects can be managed and organized simultaneously using this detailed approach avoidance conflict gantt chart with project progress bar topics pdf template. Track the milestones, tasks, phases, activities, and subtasks to get an updated visual of your project. Share your planning horizon and release plan with this well crafted presentation template. This exemplary template can be used to plot various dependencies to distinguish the tasks in the pipeline and their impact on the schedules and deadlines of the project. Apart from this, you can also share this visual presentation with your team members and stakeholders. It a resourceful tool that can be incorporated into your business structure. Therefore, download and edit it conveniently to add the data and statistics as per your requirement.
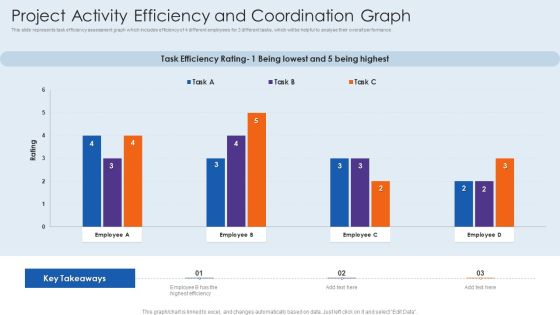
Project Activity Efficiency And Coordination Graph Microsoft PDF
Showcasing this set of slides titled project activity efficiency and coordination graph microsoft pdf. The topics addressed in these templates are project activity efficiency and coordination graph. All the content presented in this PPT design is completely editable. Download it and make adjustments in color, background, font etc. as per your unique business setting.

Graph Marketing PowerPoint Templates And PowerPoint Themes 1012
Graph Marketing PowerPoint Templates And PowerPoint Themes 1012-Microsoft Powerpoint Templates and Background with graph marketing-Graph Marketing PowerPoint Templates And PowerPoint Themes 1012-This PowerPoint template can be used for presentations relating to-Graph marketing, business, finance, globe, marketing, success

Colorful Graph Money Business PowerPoint Templates And PowerPoint Themes 0512
Microsoft Powerpoint Templates and Background with color graph-These templates can be used for presentations relating to-Color graph, business, shapes, success, finance, sales-Colorful Graph Money Business PowerPoint Templates And PowerPoint Themes 0512
Colorful Graph Profit Money PowerPoint Templates And PowerPoint Themes 0512
Microsoft Powerpoint Templates and Background with color graph-These templates can be used for presentations relating to-Color graph, business, shapes, success, finance, sales-Colorful Graph Profit Money PowerPoint Templates And PowerPoint Themes 0512

Colorful Graph Success PowerPoint Templates And PowerPoint Themes 0512
Microsoft Powerpoint Templates and Background with color graph-These templates can be used for presentations relating to-Color graph, business, shapes, success, finance, sales-Colorful Graph Success PowerPoint Templates And PowerPoint Themes 0512
Dollar And Graph Business PowerPoint Templates And PowerPoint Themes 0512
Microsoft Powerpoint Templates and Background with business graph-These templates can be used for presentations relating to-Business graph, finance, money, success, shapes, arrows-Dollar and Graph Business PowerPoint Templates And PowerPoint Themes 0512
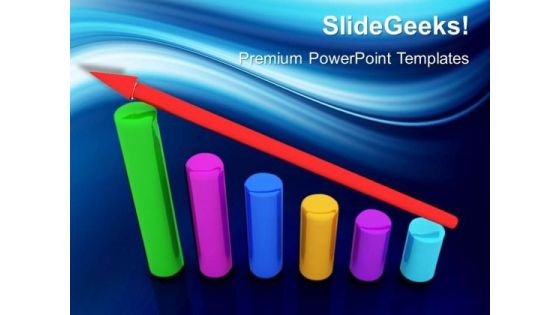
Profit Graph Success PowerPoint Templates And PowerPoint Themes 0512
Microsoft Powerpoint Templates and Background with business graph with arrow -These templates can be used for presentations relating to-Business graph with arrow, finance, background, arrows, success, business -Profit Graph Success PowerPoint Templates And PowerPoint Themes 0512
Pie Graph Business PowerPoint Templates And PowerPoint Themes 0512
Microsoft Powerpoint Templates and Background with pie graph-Pie Graph Business PowerPoint Templates And PowerPoint Themes 0512-These PowerPoint designs and slide layouts can be used for themes relating to -Pie graph, background, business, marketing, sales, success

Algorithm Graph Pattern Matching Ppt PowerPoint Presentation Inspiration Background Images
This is a algorithm graph pattern matching ppt powerpoint presentation inspiration background images. This is a two stage process. The stages in this process are graph theory, chart theory, business.
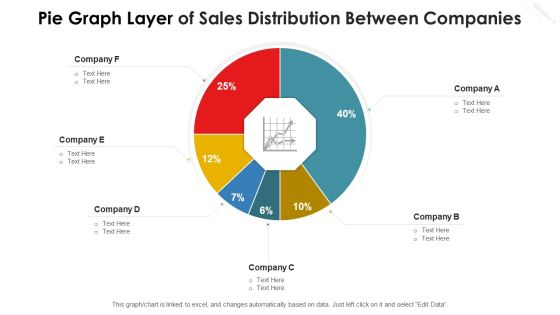
Pie Graph Layer Of Sales Distribution Between Companies Template PDF
Showcasing this set of slides titled pie graph layer of sales distribution between companies template pdf. The topics addressed in these templates are pie graph layer of sales distribution between companies. All the content presented in this PPT design is completely editable. Download it and make adjustments in color, background, font etc. as per your unique business setting.

Business Strategy Development Process Company Sales Graph Diagrams PDF
Deliver an awe inspiring pitch with this creative business strategy development process company sales graph diagrams pdf bundle. Topics like company sales graph can be discussed with this completely editable template. It is available for immediate download depending on the needs and requirements of the user.
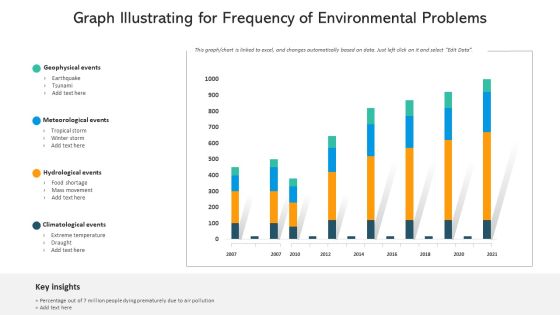
Graph Illustrating For Frequency Of Environmental Problems Background PDF
Showcasing this set of slides titled graph illustrating for frequency of environmental problems background pdf. The topics addressed in these templates are graph illustrating for frequency of environmental problems. All the content presented in this PPT design is completely editable. Download it and make adjustments in color, background, font etc. as per your unique business setting.

Business Management Company Sales Graph Ppt Inspiration Model PDF
Deliver an awe inspiring pitch with this creative business management company sales graph ppt inspiration model pdf bundle. Topics like company sales graph can be discussed with this completely editable template. It is available for immediate download depending on the needs and requirements of the user.

Gender Comparative Assessment Graph Based On Working Hours Elements PDF
Showcasing this set of slides titled gender comparative assessment graph based on working hours elements pdf. The topics addressed in these templates are gender comparative assessment graph based on working hours. All the content presented in this PPT design is completely editable. Download it and make adjustments in color, background, font etc. as per your unique business setting.

Graph Depicting Sales Representative Contribution To Revenue Growth Graphics PDF
Showcasing this set of slides titled Graph Depicting Sales Representative Contribution To Revenue Growth Graphics PDF. The topics addressed in these templates are Graph Depicting Sales, Revenue Growth. All the content presented in this PPT design is completely editable. Download it and make adjustments in color, background, font etc. as per your unique business setting.
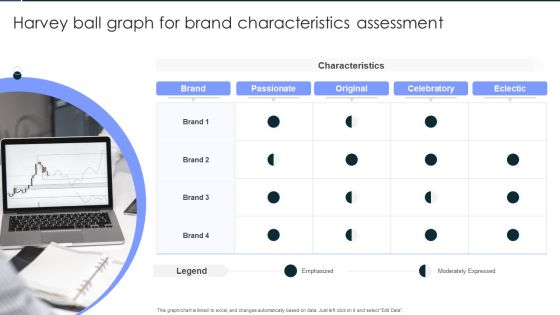
Harvey Ball Graph For Brand Characteristics Assessment Professional PDF
Showcasing this set of slides titled Harvey Ball Graph For Brand Characteristics Assessment Professional PDF. The topics addressed in these templates are Harvey Ball Graph, For Brand, Characteristics Assessment. All the content presented in this PPT design is completely editable. Download it and make adjustments in color, background, font etc. as per your unique business setting.
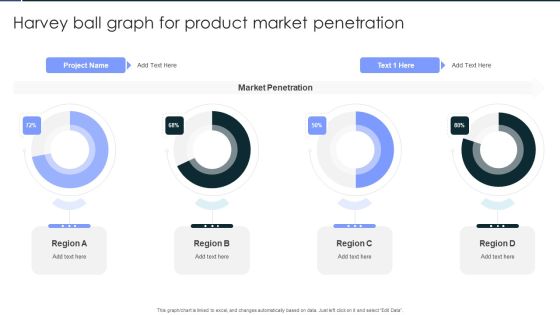
Harvey Ball Graph For Product Market Penetration Clipart PDF
Showcasing this set of slides titled Harvey Ball Graph For Product Market Penetration Clipart PDF. The topics addressed in these templates are Harvey Ball Graph, For Product, Market Penetration. All the content presented in this PPT design is completely editable. Download it and make adjustments in color, background, font etc. as per your unique business setting.
Net Promoter Score Graph Icon For Industry Trend Graphics PDF
Showcasing this set of slides titled Net Promoter Score Graph Icon For Industry Trend Graphics PDF. The topics addressed in these templates are Net Promoter, Score Graph, Industry Trend. All the content presented in this PPT design is completely editable. Download it and make adjustments in color, background, font etc. as per your unique business setting.
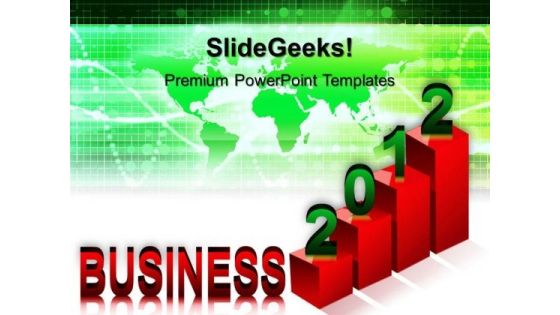
Red Graph 2012 Business PowerPoint Templates And PowerPoint Themes 0512
Red Graph 2012 Business PowerPoint Templates And PowerPoint Themes PPT designs-Microsoft Powerpoint Templates and Background with graph is showing success for 2012

Dollar And Graph Finance PowerPoint Templates And PowerPoint Themes 0612
Dollar And Graph Finance PowerPoint Templates And PowerPoint Themes Business-Microsoft Powerpoint Templates and Background with business graph with arrow showing profits

Use Pareto Chart Graph Software For Quality Administration Structure PDF
Pitch your topic with ease and precision using this use pareto chart graph software for quality administration structure pdf. This layout presents information on use pareto chart graph software for quality administration. It is also available for immediate download and adjustment. So, changes can be made in the color, design, graphics or any other component to create a unique layout.

Area Graph Analysis Ppt PowerPoint Presentation Outline Objects
Presenting this set of slides with name area graph analysis ppt powerpoint presentation outline objects. The topics discussed in these slides are area graph, product 01, product 02. This is a completely editable PowerPoint presentation and is available for immediate download. Download now and impress your audience.

Graph Showing Sales Performance Analysis Ppt PowerPoint Presentation Professional Information
Presenting this set of slides with name graph showing sales performance analysis ppt powerpoint presentation professional information. The topics discussed in these slide is graph showing sales performance analysis. This is a completely editable PowerPoint presentation and is available for immediate download. Download now and impress your audience.
Product Percentage Change Graph Ppt PowerPoint Presentation Styles Icons PDF
Presenting this set of slides with name product percentage change graph ppt powerpoint presentation styles icons pdf. The topics discussed in these slide is product percentage change graph. This is a completely editable PowerPoint presentation and is available for immediate download. Download now and impress your audience.

Graph Showing Fill Positions Counts Ppt PowerPoint Presentation Sample PDF
Presenting this set of slides with name graph showing fill positions counts ppt powerpoint presentation sample pdf. The topics discussed in these slide is graph showing fill positions counts. This is a completely editable PowerPoint presentation and is available for immediate download. Download now and impress your audience.
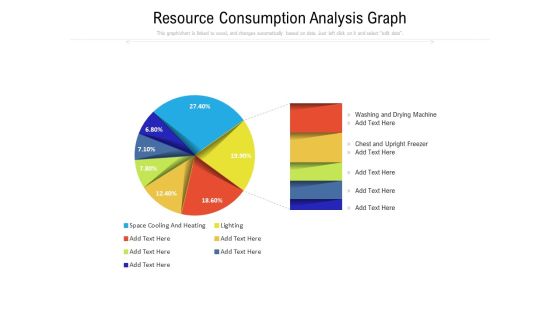
Resource Consumption Analysis Graph Ppt PowerPoint Presentation Gallery Smartart PDF
Presenting this set of slides with name resource consumption analysis graph ppt powerpoint presentation gallery smartart pdf. The topics discussed in these slide is resource consumption analysis graph. This is a completely editable PowerPoint presentation and is available for immediate download. Download now and impress your audience.

Graph Showing Key Insights Of Environmental Problems Structure PDF
Pitch your topic with ease and precision using this graph showing key insights of environmental problems structure pdf. This layout presents information on graph showing key insights of environmental problems. It is also available for immediate download and adjustment. So, changes can be made in the color, design, graphics or any other component to create a unique layout.

Graph Showing Financial Prediction Of Company Sales Revenue Topics PDF
Pitch your topic with ease and precision using this graph showing financial prediction of company sales revenue topics pdf. This layout presents information on graph showing financial prediction of company sales revenue. It is also available for immediate download and adjustment. So, changes can be made in the color, design, graphics or any other component to create a unique layout.
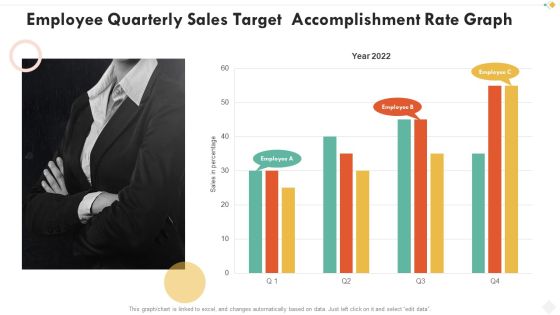
Employee Quarterly Sales Target Accomplishment Rate Graph Demonstration PDF
Pitch your topic with ease and precision using this employee quarterly sales target accomplishment rate graph demonstration pdf. This layout presents information on employee quarterly sales target accomplishment rate graph. It is also available for immediate download and adjustment. So, changes can be made in the color, design, graphics or any other component to create a unique layout.
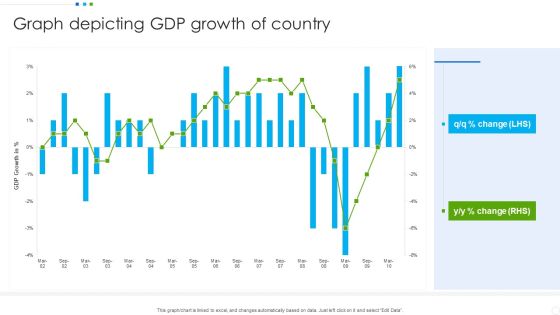
Graph Depicting Gdp Growth Of Country Background PDF
Pitch your topic with ease and precision using this Graph Depicting Gdp Growth Of Country Background PDF. This layout presents information on Graph Depicting, Growth Of Country. It is also available for immediate download and adjustment. So, changes can be made in the color, design, graphics or any other component to create a unique layout.
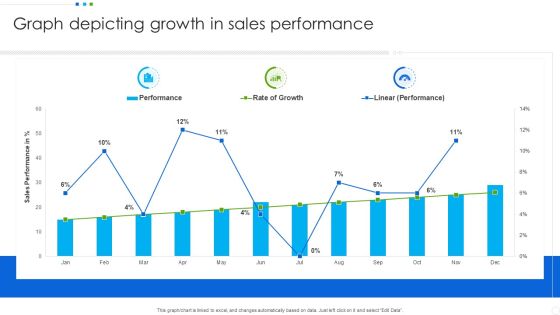
Graph Depicting Growth In Sales Performance Professional PDF
Pitch your topic with ease and precision using this Graph Depicting Growth In Sales Performance Professional PDF. This layout presents information on Graph Depicting, Sales Performance. It is also available for immediate download and adjustment. So, changes can be made in the color, design, graphics or any other component to create a unique layout.

Graph Representing Revenue Growth In B2b Sales Background PDF
Pitch your topic with ease and precision using this Graph Representing Revenue Growth In B2b Sales Background PDF. This layout presents information on Graph Representing, Revenue Growth, Sales. It is also available for immediate download and adjustment. So, changes can be made in the color, design, graphics or any other component to create a unique layout.
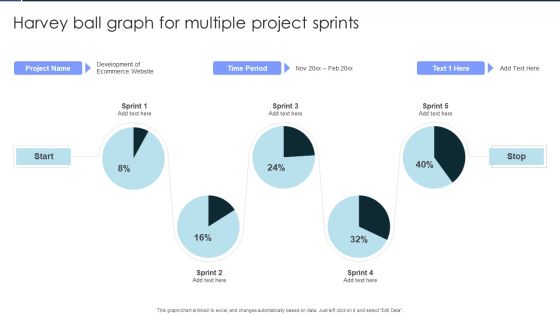
Harvey Ball Graph For Multiple Project Sprints Background PDF
Pitch your topic with ease and precision using this Harvey Ball Graph For Multiple Project Sprints Background PDF. This layout presents information on Harvey Ball Graph, For Multiple, Project Sprints. It is also available for immediate download and adjustment. So, changes can be made in the color, design, graphics or any other component to create a unique layout.
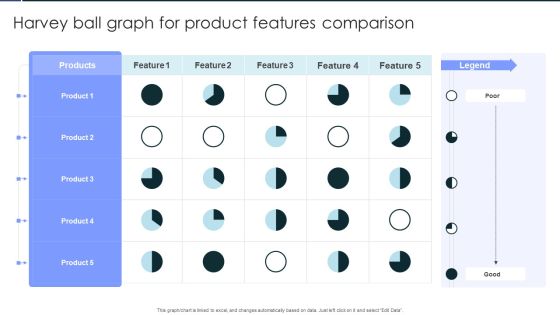
Harvey Ball Graph For Product Features Comparison Rules PDF
Pitch your topic with ease and precision using this Harvey Ball Graph For Product Features Comparison Rules PDF. This layout presents information onHarvey Ball Graph, For Product, Features Comparison. It is also available for immediate download and adjustment. So, changes can be made in the color, design, graphics or any other component to create a unique layout.
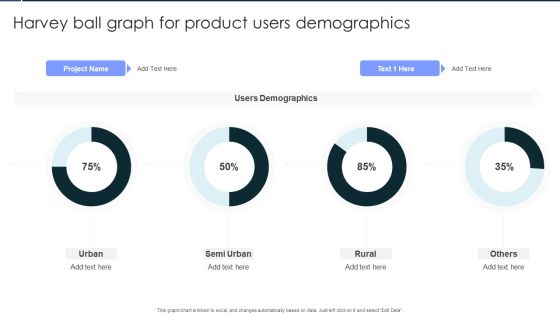
Harvey Ball Graph For Product Users Demographics Portrait PDF
Pitch your topic with ease and precision using this Harvey Ball Graph For Product Users Demographics Portrait PDF. This layout presents information on Harvey Ball Graph, For Product, Users Demographics. It is also available for immediate download and adjustment. So, changes can be made in the color, design, graphics or any other component to create a unique layout.

Harvey Ball Graph For Software Assessment Clipart PDF
Pitch your topic with ease and precision using this Harvey Ball Graph For Software Assessment Clipart PDF. This layout presents information on Harvey Ball Graph, For Software, Assessment. It is also available for immediate download and adjustment. So, changes can be made in the color, design, graphics or any other component to create a unique layout.

Business Graph Arrow Symbol PowerPoint Templates And PowerPoint Backgrounds 0511
Microsoft PowerPoint Template and Background with chart business graph with arrow showing profits and gains
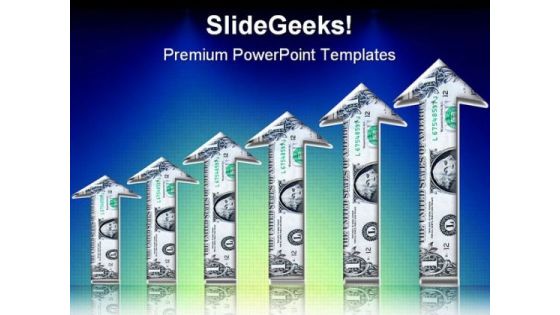
Money Graph Business PowerPoint Templates And PowerPoint Backgrounds 0711
Microsoft PowerPoint Template and Background with upward growth chart or graph of arrows made of money

Non Performing Assets Loans Graph Ppt Summary Graphic Tips PDF
This slide Provides the graph of historical and Forecasted Non-Performing Assets or Loans in percent for the period 2015 to 2023 and the Strategies used by the company to reduce NPA over that period. Deliver and pitch your topic in the best possible manner with this non performing assets loans graph ppt summary graphic tips pdf. Use them to share invaluable insights on non performing assets or loans graph and impress your audience. This template can be altered and modified as per your expectations. So, grab it now.
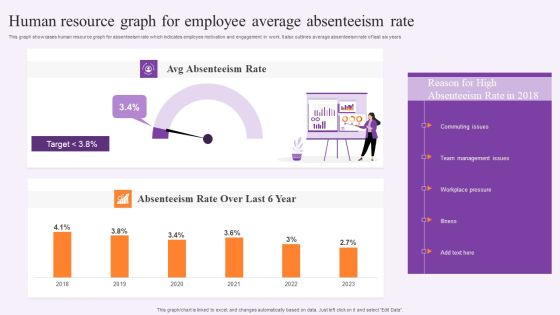
Human Resource Graph For Employee Average Absenteeism Rate Information PDF
This graph showcases human resource graph for absenteeism rate which indicates employee motivation and engagement in work. It also outlines average absenteeism rate of last six years. Showcasing this set of slides titled Human Resource Graph For Employee Average Absenteeism Rate Information PDF. The topics addressed in these templates are Team Management Issues, Workplace Pressure, Absenteeism Rate. All the content presented in this PPT design is completely editable. Download it and make adjustments in color, background, font etc. as per your unique business setting.
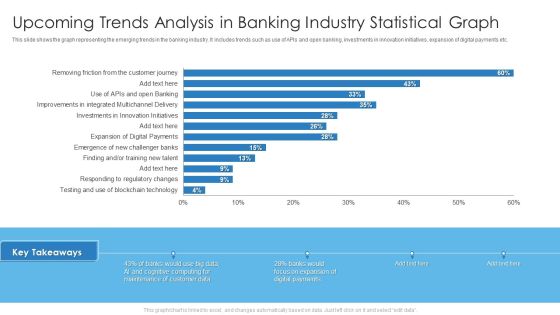
Upcoming Trends Analysis In Banking Industry Statistical Graph Brochure PDF
This slide shows the graph representing the emerging trends in the banking industry. It includes trends such as use of APIs and open banking, investments in innovation initiatives, expansion of digital payments etc. Deliver and pitch your topic in the best possible manner with this Upcoming Trends Analysis In Banking Industry Statistical Graph Brochure PDF. Use them to share invaluable insights on Upcoming Trends Analysis, Banking Industry Statistical Graph and impress your audience. This template can be altered and modified as per your expectations. So, grab it now.

Percentage Graph Marketing PowerPoint Templates And PowerPoint Themes 0612
Percentage Graph Marketing PowerPoint Templates And PowerPoint Themes Business-Microsoft Powerpoint Templates and Background with growing percents

 Home
Home