Bar Graph

Media Mix Optimization Bar Chart Ppt Slides
This is a media mix optimization bar chart ppt slides. This is a one stage process. The stages in this process are business, media, success.

Bar Chart Ppt PowerPoint Presentation Show Show
This is a bar chart ppt powerpoint presentation show show. This is a nine stage process. The stages in this process are business, marketing, chart, growth.
Bar Chart Business PowerPoint Template 0810
3D illustration of a colorful multi-segment bar chart over top of a light blue textured background with plenty of open space for your text

Target Modelling Bar Chart Ppt Slides
This is a target modelling bar chart ppt slides. This is a six stage process. The stages in this process are arrows, business, success.
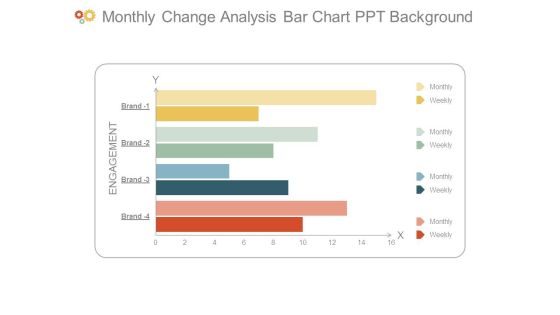
Monthly Change Analysis Bar Chart Ppt Background
This is a monthly change analysis bar chart ppt background. This is a four stage process. The stages in this process are engagement, monthly, weekly, brand.
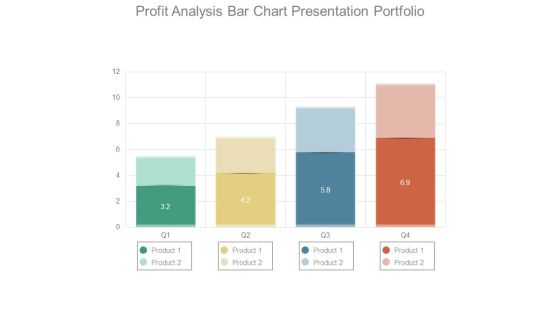
Profit Analysis Bar Chart Presentation Portfolio
This is a profit analysis bar chart presentation portfolio. This is a four stage process. The stages in this process are product.

Bar Chart For Data Analytics Ppt Examples
This is a bar chart for data analytics ppt examples. This is a five stage process. The stages in this process are category.

Data Analytics Bar Chart Ppt Sample Presentations
This is a data analytics bar chart ppt sample presentations. This is a five stage process. The stages in this process are category.

Bar Chart Ppt PowerPoint Presentation Layouts
This is a bar chart ppt powerpoint presentation layouts. This is a four stage process. The stages in this process are business, strategy, marketing, analysis, finance.

Bar Chart Ppt PowerPoint Presentation File Skills
This is a bar chart ppt powerpoint presentation file skills. This is a nine stage process. The stages in this process are business, marketing, growth, finance, management.

Bar Chart Ppt PowerPoint Presentation Summary Pictures
This is a bar chart ppt powerpoint presentation summary pictures. This is a four stage process. The stages in this process are product, unit count, finance, percentage, business.

Bar Chart Ppt PowerPoint Presentation Portfolio Inspiration
This is a bar chart ppt powerpoint presentation portfolio inspiration. This is a two stage process. The stages in this process are product, in percentage, in years.
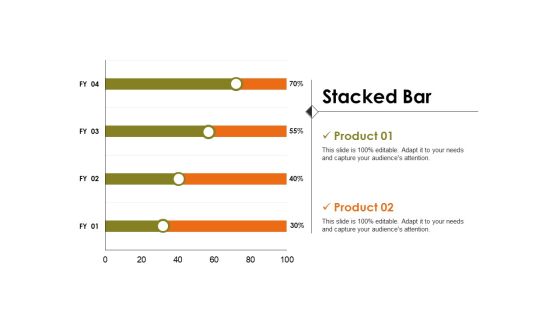
Stacked Bar Ppt PowerPoint Presentation Outline Elements
This is a stacked bar ppt powerpoint presentation outline elements. This is a two stage process. The stages in this process are chart, business, marketing, finance, strategy.

Stacked Bar Ppt PowerPoint Presentation Topics
This is a stacked bar ppt powerpoint presentation topics. This is a two stage process. The stages in this process are product, planning, business, management, strategy.
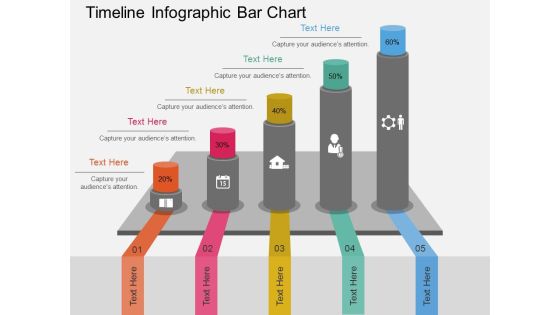
Timeline Infographic Bar Chart Powerpoint Template
This business diagram has been designed with timeline infographic bar chart. You may use this slide to display success and growth concepts. Make your mark with this unique slide and create an impression that will endure.
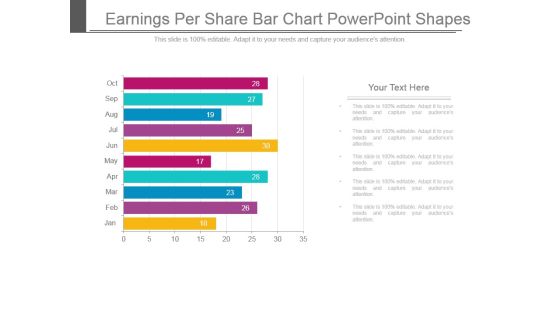
Earnings Per Share Bar Chart Powerpoint Shapes
This is a earnings per share bar chart powerpoint shapes. This is a ten stage process. The stages in this process are jan, feb, mar, apr, may, jun, jul, aug, sep, oct.

Bar Chart Ppt PowerPoint Presentation Portfolio Icons
This is a bar chart ppt powerpoint presentation portfolio icons. This is a seven stage process. The stages in this process are in years, in percentage, finance, business marketing.

Bar Chart Ppt PowerPoint Presentation Ideas Deck
This is a bar chart ppt powerpoint presentation ideas deck. This is a two stage process. The stages in this process are product, in percentage, in years, financial, business.

Stock Photo Marketing Graph And Folder PowerPoint Slide
Define your ideas in a unique and inspiring manner using this image which contains a graphic of colorful bar graph. This pre-designed and appealing bar graph offers an optimized possibility to illustrate your marketing strategy. Use this Image in presentations relating to business and sales.

Capital Consumption Adjustment Bar Chart Ppt Styles Gridlines PDF
Presenting this set of slides with name capital consumption adjustment bar chart ppt styles gridlines pdf. The topics discussed in these slide is bar graph. This is a completely editable PowerPoint presentation and is available for immediate download. Download now and impress your audience.

Clustered Bar Finance Investment Ppt PowerPoint Presentation Layouts Summary
Presenting this set of slides with name clustered bar finance investment ppt powerpoint presentation layouts summary. The topics discussed in these slides are bar graph, finance, marketing, analysis, investment. This is a completely editable PowerPoint presentation and is available for immediate download. Download now and impress your audience.

Business Graph Finance PowerPoint Template 0910
business bar chart with arrows isolated on a white background.
Business Graph Sales PowerPoint Templates And PowerPoint Themes 0512
Microsoft Powerpoint Templates and Background with Bar graph down-These templates can be used for presentations relating to-Bar graph down, business, sales, finance, arrows, cylinders-Business Graph Sales PowerPoint Templates And PowerPoint Themes 0512

Safety Net Catching Falling Bar Business PowerPoint Templates And PowerPoint Backgrounds 0811
Microsoft PowerPoint Template and Background with safety net catching falling bar graph

Safety Net Catching Falling Bar Business PowerPoint Themes And PowerPoint Slides 0811
Microsoft PowerPoint Theme and Slide with safety net catching falling bar graph
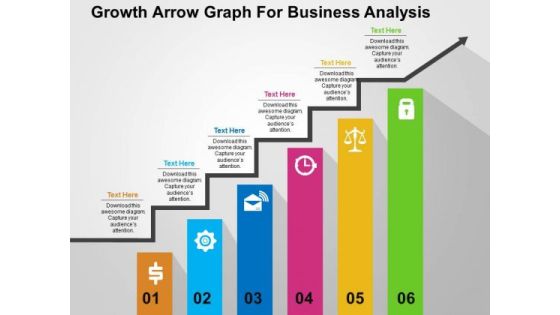
Growth Arrow Graph For Business Analysis PowerPoint Templates
Use this PowerPoint template containing growth arrow graph for business analysis. This PPT slide contains bar graph with icons. This slide is designed to attract the attention of your audience towards business plan evaluation.

Competitor Analysis Graph Ppt PowerPoint Presentation Slides Elements
This is a competitor analysis graph ppt powerpoint presentation slides elements. This is a five stage process. The stages in this process are bar graph, finance, marketing, strategy, business.
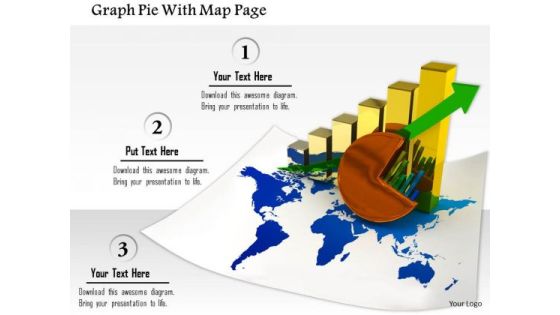
Stock Photo Graph Pie With Map Page PowerPoint Slide
This image slide contains business charts on world map. This image is designed with bar graph and pie chart on world map depicting global economy. Use this image slide to represent financial growth in any business presentation.

Business Diagram Graph Of Financial Growth Presentation Template
Tree design bar graph has been used to craft this power point template diagram. This PPT contains the concept of financial growth. Use this PPT diagram for finance and business related presentations.

Stock Photo Business Graph Of Two Thousand Fifteen PowerPoint Slide
This Business Power Point image template has been designed with graphic of bar graph of 2015 year text. This image template contains the concept of new year planning. This image slide can be used for business and finance related presentations.

Business Graph Adjust PowerPoint Icon C
Microsoft powerpoint template and Background with a multi colored bar chart inside the center opening of a large gear

Business Graph Adjust PowerPoint Icon Cc
Microsoft powerpoint template and Background with a multi colored bar chart inside the center opening of a large gear

Business Graph Adjust PowerPoint Icon F
Microsoft powerpoint template and Background with a multi colored bar chart inside the center opening of a large gear

Business Graph Adjust PowerPoint Icon R
Microsoft powerpoint template and Background with a multi colored bar chart inside the center opening of a large gear

Business Graph Adjust PowerPoint Icon S
Microsoft powerpoint template and Background with a multi colored bar chart inside the center opening of a large gear

Business Data Graph Finance PowerPoint Templates And PowerPoint Backgrounds 0511
Microsoft PowerPoint Template and Background with increasing bar chart business data graph with world map
Business Data Graph Finance PowerPoint Themes And PowerPoint Slides 0511
Microsoft PowerPoint Slide and Theme with increasing bar chart business data graph with world map

Cylinder Graph Business PowerPoint Templates And PowerPoint Themes 0512
Microsoft Powerpoint Templates and Background with bar graph-Cylinder Graph Business PowerPoint Templates And PowerPoint Themes 0512-These PowerPoint designs and slide layouts can be used for themes relating to -Bar graph,success, marketing, sales, business, finance
Cylinder Graph Success PowerPoint Templates And PowerPoint Themes 0512
Microsoft Powerpoint Templates and Background with bar graph-Cylinder Graph Success PowerPoint Templates And PowerPoint Themes 0512-These PowerPoint designs and slide layouts can be used for themes relating to -Bar graph,success, marketing, sales, business, finance

Business Graph Global PowerPoint Templates And PowerPoint Themes 0512
Microsoft Powerpoint Templates and Background with bar graphs-These templates can be used for presentations relating to-Bar graph global, global, background, business, finance, success-Business Graph Global PowerPoint Templates And PowerPoint Themes 0512
Graph Business PowerPoint Background And Template 1210
Microsoft PowerPoint Template and Background with a 3d rendering of a gold bars histogram

Business Graph With Dollars Globe PowerPoint Templates And PowerPoint Backgrounds 0311
Microsoft PowerPoint Template and Background with bar graphs dollar sign and diagram
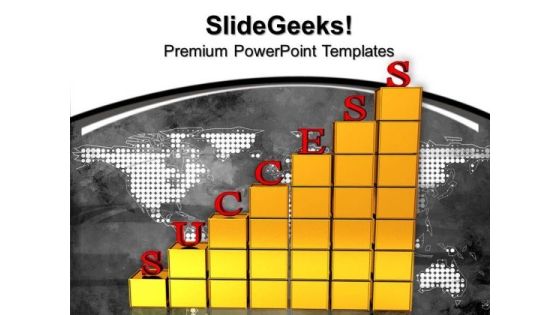
Success Graph Business PowerPoint Templates And PowerPoint Themes 1012
The above template displays a diagram of a bar graph showing success. This image represents the concept of growth in business. This image has been conceived to enable you to emphatically communicate your ideas in your Business PPT presentations. Create captivating presentations to deliver comparative and weighted arguments.
Consulting Slides Graph With Abc Steps And Icons Business Presentation
This diagram displays bar graph with ABC steps and business icons. This diagram may be used in your presentations to depict any information and data which requires visual presentation. Use this diagram, in your presentations to express view on growth, progress and success. Create eye-catching presentations using this diagram.
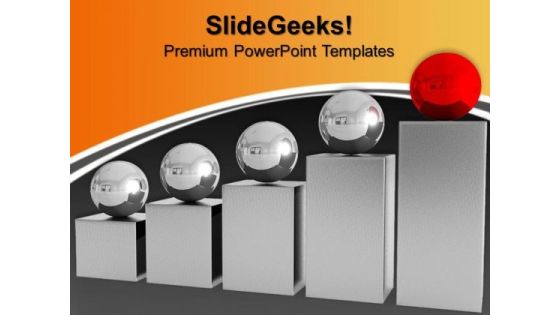
Success Graph Leadership PowerPoint Templates And PowerPoint Themes 1012
The above template displays a diagram of a bar graph. This image represents the concept of leadership. This image has been conceived to enable you to emphatically communicate your ideas in your Business PPT presentations. Create captivating presentations to deliver comparative and weighted arguments.
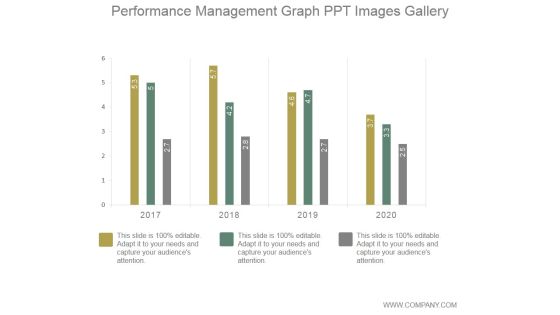
Performance Management Graph Ppt PowerPoint Presentation Template
This is a performance management graph ppt powerpoint presentation template. This is a four stage process. The stages in this process are graph, growth, performance, years, finance.

Large Graph Business PowerPoint Template 0910
Businesspeople are standing in a large graph conceptual business illustration.

Dices On Financial Graph PowerPoint Icon C
Microsoft PowerPoint Template and Background with dices on financial graph

Dices On Financial Graph PowerPoint Icon Cc
Microsoft PowerPoint Template and Background with dices on financial graph

Dices On Financial Graph PowerPoint Icon F
Microsoft PowerPoint Template and Background with dices on financial graph

Dices On Financial Graph PowerPoint Icon R
Microsoft PowerPoint Template and Background with dices on financial graph

Dices On Financial Graph PowerPoint Icon S
Microsoft PowerPoint Template and Background with dices on financial graph

Business Graph With Arrow PowerPoint Icon Cc
Microsoft PowerPoint Template and Background with business graph

Business Graph With Arrow PowerPoint Icon F
Microsoft PowerPoint Template and Background with business graph

Business Graph With Arrow PowerPoint Icon R
Microsoft PowerPoint Template and Background with business graph

Business Graph With Arrow PowerPoint Icon C
Microsoft PowerPoint Template and Background with business graph

Business Graph With Arrow PowerPoint Icon S
Microsoft PowerPoint Template and Background with business graph

Abstract Business Graph PowerPoint Icon Cc
Microsoft PowerPoint Template and Background with business graph with profits rising off the chart. Graph on a white reflective backgroun

Abstract Business Graph PowerPoint Icon F
Microsoft PowerPoint Template and Background with business graph with profits rising off the chart. Graph on a white reflective backgroun

Abstract Business Graph PowerPoint Icon R
Microsoft PowerPoint Template and Background with business graph with profits rising off the chart. Graph on a white reflective backgroun

Abstract Business Graph PowerPoint Icon C
Microsoft PowerPoint Template and Background with business graph with profits rising off the chart. Graph on a white reflective backgroun

Abstract Business Graph PowerPoint Icon S
Microsoft PowerPoint Template and Background with business graph with profits rising off the chart. Graph on a white reflective backgroun
Golden Graph Chart PowerPoint Icon C
Golden graph chart good better best on white background
Golden Graph Chart PowerPoint Icon S
Golden graph chart good better best on white background

Competitor Analysis Graph Ppt PowerPoint Presentation Styles
This is a competitor analysis graph ppt powerpoint presentation styles. This is a five stage process. The stages in this process are graph, business, marketing, competitor.
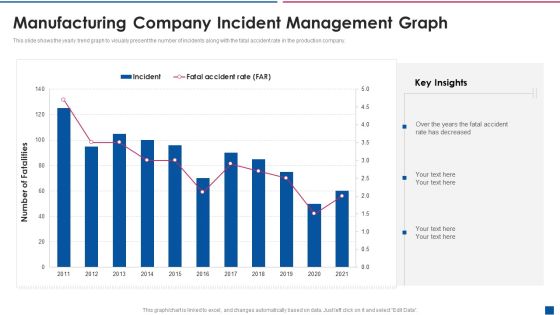
Manufacturing Company Incident Management Graph Information PDF
This slide shows the yearly trend graph to visually present the number of incidents along with the fatal accident rate in the production company. Showcasing this set of slides titled manufacturing company incident management graph information pdf. The topics addressed in these templates are manufacturing company incident management graph. All the content presented in this PPT design is completely editable. Download it and make adjustments in color, background, font etc. as per your unique business setting.

Company Profit Accomplishment Rate Graph Template PDF
Showcasing this set of slides titled company profit accomplishment rate graph template pdf. The topics addressed in these templates are company profit accomplishment rate graph. All the content presented in this PPT design is completely editable. Download it and make adjustments in color, background, font etc. as per your unique business setting.
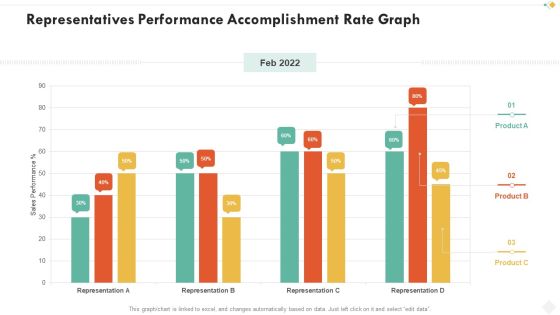
Representatives Performance Accomplishment Rate Graph Template PDF
Showcasing this set of slides titled representatives performance accomplishment rate graph template pdf. The topics addressed in these templates are representatives performance accomplishment rate graph. All the content presented in this PPT design is completely editable. Download it and make adjustments in color, background, font etc. as per your unique business setting.

Enterprise Management Company Sales Graph Themes PDF
Deliver and pitch your topic in the best possible manner with this enterprise management company sales graph themes pdf. Use them to share invaluable insights on company sales graph and impress your audience. This template can be altered and modified as per your expectations. So, grab it now.
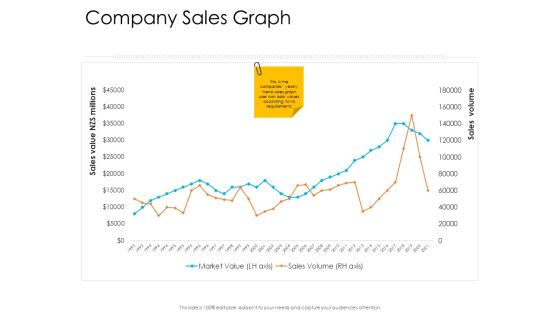
Enterprise Governance Company Sales Graph Topics PDF
Deliver an awe-inspiring pitch with this creative enterprise governance company sales graph topics pdf bundle. Topics like company sales graph can be discussed with this completely editable template. It is available for immediate download depending on the needs and requirements of the user.

Corporate Governance Company Sales Graph Background PDF
Deliver an awe inspiring pitch with this creative corporate governance company sales graph background pdf bundle. Topics like company sales graph can be discussed with this completely editable template. It is available for immediate download depending on the needs and requirements of the user.

Marketing Kpi Accomplishment Rate Graph Mockup PDF
Showcasing this set of slides titled marketing kpi accomplishment rate graph mockup pdf. The topics addressed in these templates are marketing kpi accomplishment rate graph. All the content presented in this PPT design is completely editable. Download it and make adjustments in color, background, font etc. as per your unique business setting.

Staff Task Accomplishment Rate Graph Inspiration PDF
Showcasing this set of slides titled staff task accomplishment rate graph inspiration pdf. The topics addressed in these templates are staff task accomplishment rate graph. All the content presented in this PPT design is completely editable. Download it and make adjustments in color, background, font etc. as per your unique business setting.
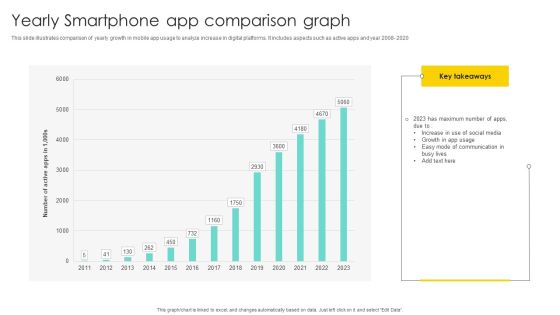
Yearly Smartphone App Comparison Graph Diagrams PDF
Showcasing this set of slides titled Yearly Smartphone App Comparison Graph Diagrams PDF. The topics addressed in these templates are Comparison Graph, Comparison Of Yearly, Growth In App . All the content presented in this PPT design is completely editable. Download it and make adjustments in color, background, font etc. as per your unique business setting.
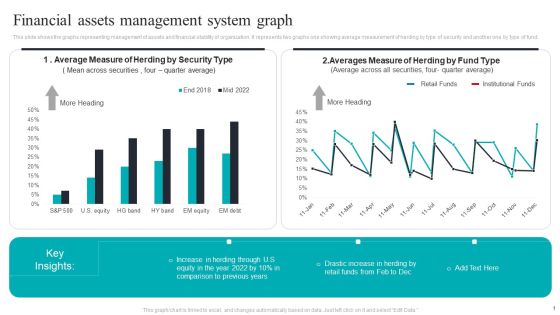
Financial Assets Management System Graph Structure PDF
This slide shows the graphs representing management of assets and financial stability of organization. It represents two graphs one showing average measurement of herding by type of security and another one by type of fund. Pitch your topic with ease and precision using this Financial Assets Management System Graph Structure PDF. This layout presents information on Financial Assets, Management System Graph. It is also available for immediate download and adjustment. So, changes can be made in the color, design, graphics or any other component to create a unique layout.
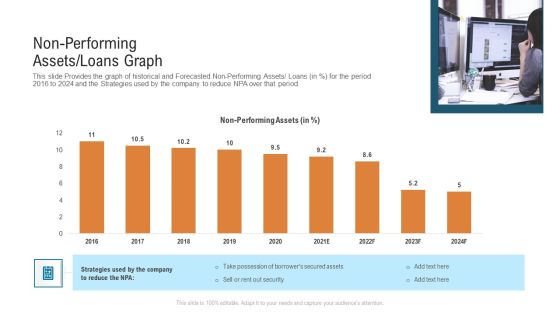
Non Performing Assets Loans Graph Structure PDF
This slide Provides the graph of historical and Forecasted Non Performing Assets or Loans in percentagefor the period 2016 to 2024 and the Strategies used by the company to reduce NPA over that period. Deliver and pitch your topic in the best possible manner with this non performing assets loans graph structure pdf. Use them to share invaluable insights on non performing assets loans graph and impress your audience. This template can be altered and modified as per your expectations. So, grab it now.

Graph Business PowerPoint Backgrounds And Templates 1210
Microsoft PowerPoint Template and Background with 3D business graph with up and fall
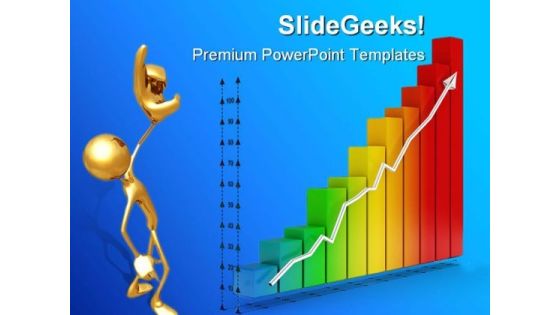
Financial Graph PowerPoint Backgrounds And Templates 0111
Microsoft PowerPoint Template and Background with 3d rendered rainbow colored financial graph showing strong growth

Graph 2011 Business PowerPoint Template 0810
2010 2011 Business graph with world background. Vector File also available

Area Graph Ppt PowerPoint Presentation Slides Ideas
This is a area graph ppt powerpoint presentation slides ideas. This is a two stage process. The stages in this process are sales in percentage, financial year, product.

PowerPoint Templates Marketing Puzzle Graph Ppt Designs
PowerPoint Templates Marketing Puzzle Graph PPT Designs-This PowerPoint slide shows 3 puzzles diagram. There is a lot of space available for writing your text. You can easily edit the size, position, text, color. \n\n-PowerPoint Templates Marketing Puzzle Graph PPT Designs
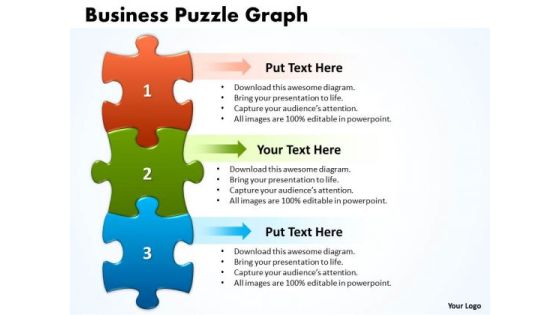
Strategic Management Business Puzzle Graph Business Diagram
Get The Doers Into Action. Activate Them With Our Strategic Management Business Puzzle Graph Business Diagram Powerpoint Templates.

Business Diagram Business Puzzle Graph Consulting Diagram
Your Listeners Will Never Doodle. Our Business Diagram Business Puzzle Graph Consulting Diagram Powerpoint Templates Will Hold Their Concentration. Do The One Thing With Your Thoughts. Uphold Custom With Our Business Diagram Business Puzzle Graph Consulting Diagram Powerpoint Templates.
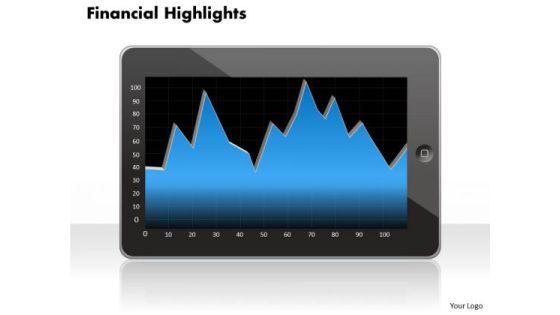
Business Framework Model Financial Graph Consulting Diagram
Document Your Views On Our Business Framework Model Financial Graph Consulting Diagram Powerpoint Templates. They Will Create A Strong Impression.
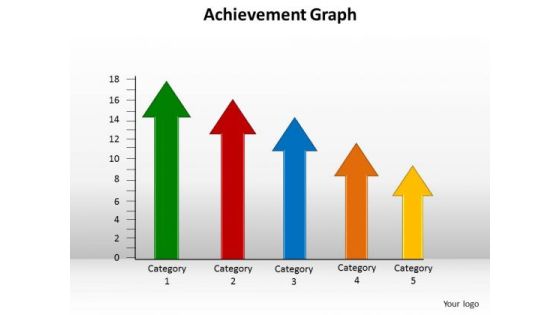
Marketing Diagram Achievement Graph Business Framework Model
Our Marketing Diagram Achievement Graph Business Framework Model Powerpoint Templates Abhor Doodling. They Never Let The Interest Flag.

Graph Down Up Business PowerPoint Template 0510
Business failure and growth graphs and arrows
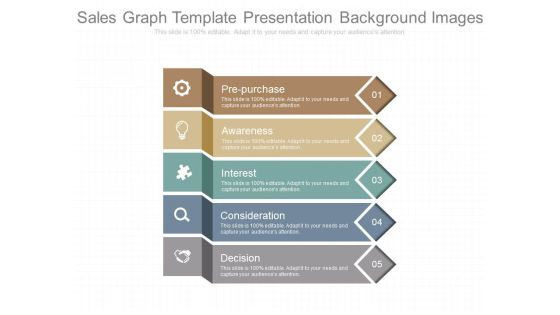
Sales Graph Template Presentation Background Images
This is a sales graph template presentation background images. This is a five stage process. The stages in this process are pre purchase, awareness, interest, consideration, decision.
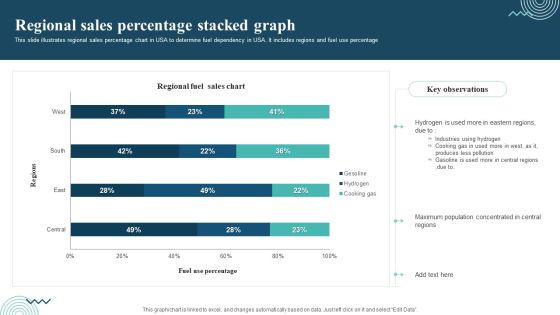
Regional Sales Percentage Stacked Graph Themes PDF
This slide illustrates regional sales percentage chart in USA to determine fuel dependency in USA. It includes regions and fuel use percentage. Pitch your topic with ease and precision using this Regional Sales Percentage Stacked Graph Themes PDF. This layout presents information on Regional Sales, Industries Using Hydrogen, Cooking Gas. It is also available for immediate download and adjustment. So, changes can be made in the color, design, graphics or any other component to create a unique layout.
Business Concepts 3d Man With Graph Character
Get Out Of The Dock With Our business concepts 3d man with graph character Powerpoint Templates. Your Mind Will Be Set Free.
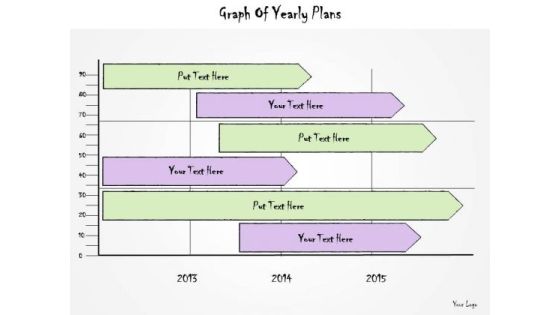
Ppt Slide Graph Of Yearly Plans Sales
Plan For All Contingencies With Our PPT Slide Graph Of Yearly Plans Sales Powerpoint Templates. Douse The Fire Before It Catches.
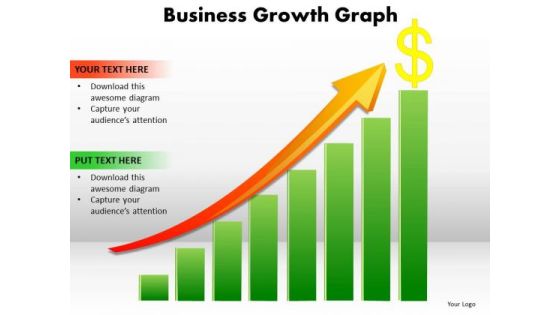
Strategic Management Business Growth Graph Consulting Diagram
Plan For All Contingencies With Our Strategic Management Business Growth Graph Consulting Diagram Powerpoint Templates. Douse The Fire Before It Catches.

Agenda Ppt PowerPoint Presentation Diagram Graph Charts
This is a agenda ppt powerpoint presentation diagram graph charts. This is a four stage process. The stages in this process are agenda, planning, management, business, list.
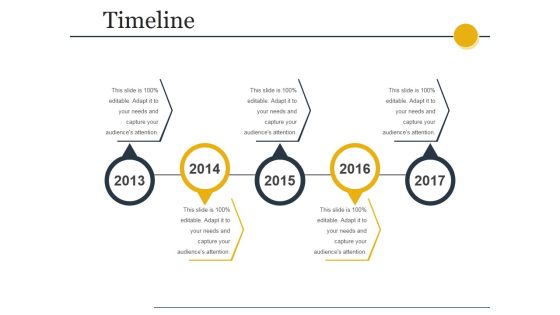
Timeline Ppt PowerPoint Presentation Diagram Graph Charts
This is a timeline ppt powerpoint presentation diagram graph charts. This is a five stage process. The stages in this process are timeline, years, business, marketing, planning.
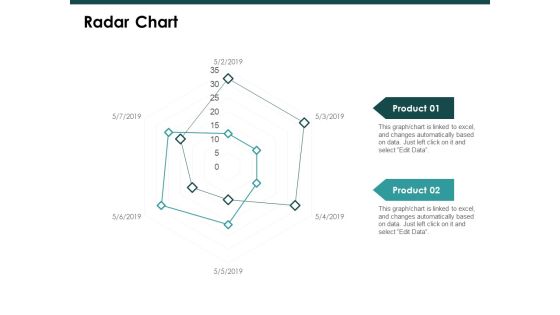
Radar Chart Graph Ppt PowerPoint Presentation Slide
This is a radar chart graph ppt powerpoint presentation slide. This is a two stage process. The stages in this process are finance, marketing, management, investment, analysis.
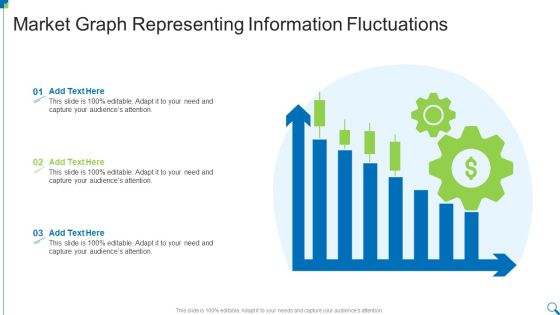
Market Graph Representing Information Fluctuations Diagrams PDF
Presenting Market Graph Representing Information Fluctuations Diagrams PDF to dispense important information. This template comprises three stages. It also presents valuable insights into the topics including Market Graph, Representing, Information Fluctuations This is a completely customizable PowerPoint theme that can be put to use immediately. So, download it and address the topic impactfully.
Investment Portfolio Advantages Graph Icon Rules PDF
Presenting Investment Portfolio Advantages Graph Icon Rules PDF to dispense important information. This template comprises three stages. It also presents valuable insights into the topics including Investment Portfolio, Advantages Graph Icon. This is a completely customizable PowerPoint theme that can be put to use immediately. So, download it and address the topic impactfully.

Business People Vector Templates Download Graph PowerPoint
We present our business people vector templates download graph PowerPoint.Download our Computer PowerPoint Templates because You have the co-ordinates for your destination of success. Let our PowerPoint Templates and Slides map out your journey. Download and present our Business PowerPoint Templates because Our PowerPoint Templates and Slides will give good value for money. They also have respect for the value of your time. Use our People PowerPoint Templates because Watching this your Audience will Grab their eyeballs, they wont even blink. Use our Technology PowerPoint Templates because You canTake a leap off the starting blocks with our PowerPoint Templates and Slides. They will put you ahead of the competition in quick time. Use our Circle Charts PowerPoint Templates because They will Put your wonderful verbal artistry on display. Our PowerPoint Templates and Slides will provide you the necessary glam and glitter.Use these PowerPoint slides for presentations relating to 3d, abstract, action, background, business, businessman, career, carpet, cartoon,challenge, color, communication, company, competition, concept, corporate,design, finance, graph, graphic,growth, high, human, idea, illustration,individual, isolated, leader, man, motion, occupation, organization, people, person,red, render, shape, stair, step, success, symbol, top, up, white, winner, work,workforce. The prominent colors used in the PowerPoint template are Pink, Green, Yellow.

Business Capital Investors Graph Powerpoint Presentation
This is a business capital investors graph powerpoint presentation. This is a five stage process. The stages in this process are public, venture capital, seed capital, angles, grants f and f$.
Graph And Chart Business PowerPoint Template 1110
Graphs and charts with compass. Workplace of businessman
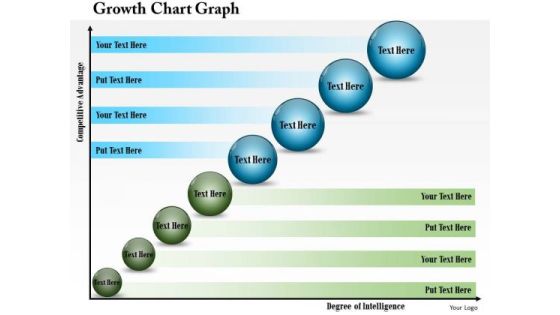
Business Diagram Growth Chart Graph Presentation Template
This business diagram has been designed x-y graph of competitive advantage and degree of intelligence. This diagram depicts the business growth chart. Give professional appearance to your presentations using this business slide.

Profit Growth Graph With Gears Powerpoint Template
This business slide contains profit growth graph with gears. This PowerPoint template helps to display outline of business plan. Use this diagram to impart more clarity to data and to create more sound impact on viewers.
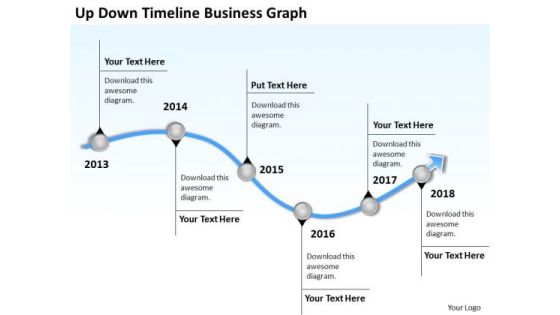
Business Analysis Diagrams PowerPoint Presentations Graph Templates
We present our business analysis diagrams powerpoint presentations graph templates.Download and present our Curves and Lines PowerPoint Templates because Your audience will believe you are the cats whiskers. Present our Business PowerPoint Templates because Our PowerPoint Templates and Slides will effectively help you save your valuable time. They are readymade to fit into any presentation structure. Present our Business PowerPoint Templates because Our PowerPoint Templates and Slides will give good value for money. They also have respect for the value of your time. Use our Arrows PowerPoint Templates because It will get your audience in sync. Present our Process and Flows PowerPoint Templates because It can Conjure up grand ideas with our magical PowerPoint Templates and Slides. Leave everyone awestruck by the end of your presentation.Use these PowerPoint slides for presentations relating to 3d, account, accounting, annual, balance, business, chart, commerce, crisis, data,earnings, economics, economy, exchange, figures, finance, financial, graph,graphic, growth, illustration, index, information, investment, list, line,management,market, marketing, money, monitoring, numbers, office, paperwork, plan, price,printout, report, research, sale, statistical, statistics, stock, success, tax, trade,work. The prominent colors used in the PowerPoint template are Blue light, Gray, White.

Circular Graph For Statistical Information PowerPoint Template
Visually support your presentation with our above template showing circular graph. This slide has been professionally designed to present statistical information. This template offers an excellent background to build impressive presentation.

Graph Showing Economy Crash PowerPoint Templates
This business slide contains design of graph. This diagram is suitable to present downfall and economy crash. Visual effect of this diagram helps in maintaining the flow of the discussion and provides more clarity to the subject.

Illustration Of Dollar Growth Graph PowerPoint Template
This business slide contains graphics of dollar symbols on graph. This diagram helps to portray concept of financial planning. Present your views using this innovative slide and be assured of leaving a lasting impression.

Spain Map With Growth Graph Powerpoint Slides
This PowerPoint template displays Spain map with growth graph. This PPT template can be used in business presentations to depict economic growth of country. This slide can also be used by school students for educational projects.
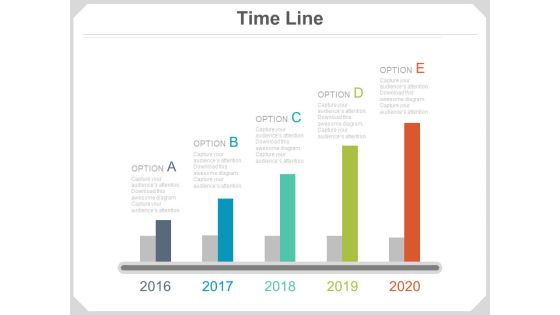
Five Growth Steps Timeline Graph Powerpoint Slides
This PowerPoint timeline slide design can be used to display growth steps. This timeline template has been designed with timeline growth graph. Download this PowerPoint timeline template to make impressive presentations.

Graph Chart Business PowerPoint Template 0810
illustration composed by charts word map and globe
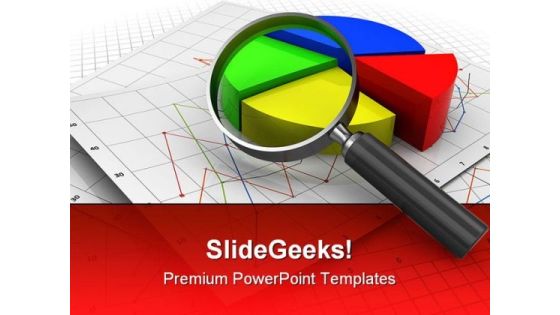
Analizing Graph Business PowerPoint Template 0910
3d illustration of business diagram prints and pie chart

Business Graph Success PowerPoint Presentation Slides C
Microsoft Powerpoint Slides and Backgrounds with isolated image of a young business man drawing increasing graphics with red line
Business Graph Success PowerPoint Presentation Slides Cc
Microsoft Powerpoint Slides and Backgrounds with isolated image of a young business man drawing increasing graphics with red line

Business Graph Success PowerPoint Presentation Slides F
Microsoft Powerpoint Slides and Backgrounds with isolated image of a young business man drawing increasing graphics with red line
Business Graph Success PowerPoint Presentation Slides R
Microsoft Powerpoint Slides and Backgrounds with isolated image of a young business man drawing increasing graphics with red line

Business Graph Success PowerPoint Presentation Slides S
Microsoft Powerpoint Slides and Backgrounds with isolated image of a young business man drawing increasing graphics with red line
Graph Symbol Business PowerPoint Presentation Slides C
Microsoft PowerPoint Templates and Backgrounds with digital footage of business symbol
Graph Symbol Business PowerPoint Presentation Slides Cc
Microsoft PowerPoint Templates and Backgrounds with digital footage of business symbol
Graph Symbol Business PowerPoint Presentation Slides F
Microsoft PowerPoint Templates and Backgrounds with digital footage of business symbol
Graph Symbol Business PowerPoint Presentation Slides R
Microsoft PowerPoint Templates and Backgrounds with digital footage of business symbol
Graph Symbol Business PowerPoint Presentation Slides S
Microsoft PowerPoint Templates and Backgrounds with digital footage of business symbol

Business Deal Graph Icons Illustration Powerpoint Template
This PowerPoint template has been designed with infographic layout. Download this diagram slide to display concepts of business deal, strategy and success. You can edit text, color, shade and style of this diagram as per you need.
 Home
Home