Bar Chart Comparison
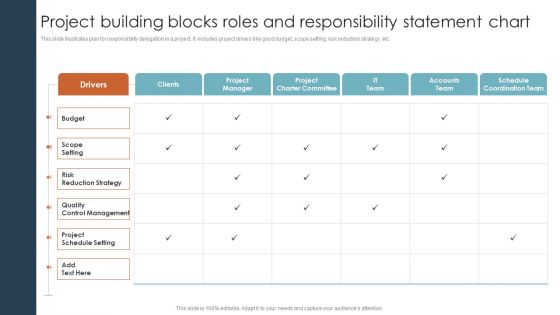
Project Building Blocks Roles And Responsibility Statement Chart Ppt Infographics Ideas PDF
This slide illustrates plan for responsibility delegation in a project. It includes project drivers like good budget, scope setting, risk reduction strategy, etc. Pitch your topic with ease and precision using this Project Building Blocks Roles And Responsibility Statement Chart Ppt Infographics Ideas PDF. This layout presents information on Scope Setting, Risk Reduction Strategy, Quality Control Management. It is also available for immediate download and adjustment. So, changes can be made in the color, design, graphics or any other component to create a unique layout.

3d Uniform Flow Arrows 8 Steps Business Chart In Business PowerPoint Templates
We present our 3d uniform flow arrows 8 steps business chart in business PowerPoint templates. Use our Business PowerPoint Templates because, Marketing Strategy Business Template: - Maximizing sales of your product is the intended destination. Use our Arrows PowerPoint Templates because, to go for Gold and not just silver. Use our Success PowerPoint Templates because, Individual components well researched and understood in their place. Use our Signs PowerPoint Templates because, this business PowerPoint template helps expound on the logic of your detailed thought process to take your company forward. Use our Process and Flows PowerPoint Templates because; illustrate your plans on using the many social media modes available to inform society at large of the benefits of your product. Use these PowerPoint slides for presentations relating to abstract, arrow, arrows, business, chart, design, development, diagram, direction, element, flow, flowchart, graph, linear, management, model, motion, organization, plan, process, program, section, segment, set, sign, solution, strategy, symbol, technology. The prominent colors used in the PowerPoint template are Red, Gray, and Black
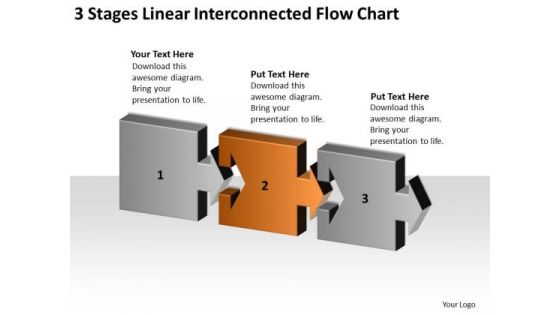
3 Stages Linear Interconnected Flow Chart Ppt Business Plan Cover Letter PowerPoint Slides
We present our 3 stages linear interconnected flow chart ppt business plan cover letter PowerPoint Slides.Use our Finance PowerPoint Templates because It is Aesthetically crafted by artistic young minds. Our PowerPoint Templates and Slides are designed to display your dexterity. Present our Marketing PowerPoint Templates because You can Connect the dots. Fan expectations as the whole picture emerges. Use our Arrows PowerPoint Templates because our PowerPoint Templates and Slides will give your ideas the shape. Download our Business PowerPoint Templates because You should Press the right buttons with our PowerPoint Templates and Slides. They will take your ideas down the perfect channel. Present our Process and Flows PowerPoint Templates because Our PowerPoint Templates and Slides are focused like a searchlight beam. They highlight your ideas for your target audience.Use these PowerPoint slides for presentations relating to Flow, design, isolated, wallpaper, input, components, display, advertise, business, concept, vector, presentation, template, circle, brochure, output, directional, analytical, modern, steps, connection, chart, strategy, interconnected, web, direction, ad, text, information, pictogram, message, arrows, communication. The prominent colors used in the PowerPoint template are Brown, Gray, Black.
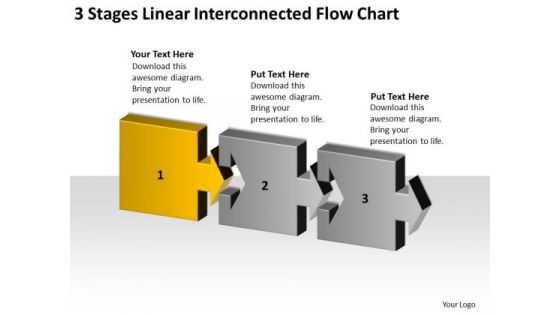
3 Stages Linear Interconnected Flow Chart Ppt Business Plans Sample PowerPoint Templates
We present our 3 stages linear interconnected flow chart ppt business plans sample PowerPoint templates.Use our Finance PowerPoint Templates because Our PowerPoint Templates and Slides will let you Hit the right notes. Watch your audience start singing to your tune. Download our Marketing PowerPoint Templates because Our PowerPoint Templates and Slides will help you be quick off the draw. Just enter your specific text and see your points hit home. Use our Arrows PowerPoint Templates because Timeline crunches are a fact of life. Meet all deadlines using our PowerPoint Templates and Slides. Present our Business PowerPoint Templates because you should Experience excellence with our PowerPoint Templates and Slides. They will take your breath away. Download and present our Process and Flows PowerPoint Templates because It will Strengthen your hand with your thoughts. They have all the aces you need to win the day.Use these PowerPoint slides for presentations relating to Flow, design, isolated, wallpaper, input, components, display, advertise, business, concept, vector, presentation, template, circle, brochure, output, directional, analytical, modern, steps, connection, chart, strategy, interconnected, web, direction, ad, text, information, pictogram, message, arrows, communication. The prominent colors used in the PowerPoint template are Yellow, Gray, Black.
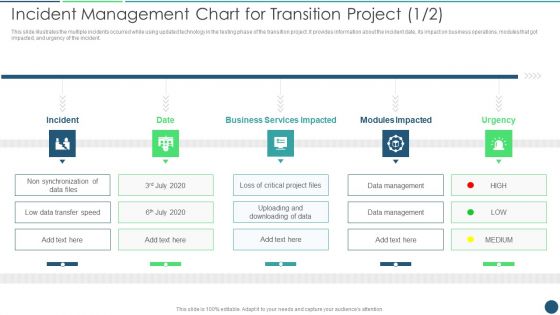
Transformation Plan Incident Management Chart For Transition Project Ppt PowerPoint Presentation Gallery Elements PDF
This slide illustrates the multiple incidents occurred while using updated technology in the testing phase of the transition project. It provides information about the incident date, its impact on business operations, modules that got impacted, and urgency of the incident. This is a Transformation Plan Incident Management Chart For Transition Project Ppt PowerPoint Presentation Gallery Elements PDF template with various stages. Focus and dispense information on five stages using this creative set, that comes with editable features. It contains large content boxes to add your information on topics like Business Services Impacted, Modules Impacted, Non synchronization. You can also showcase facts, figures, and other relevant content using this PPT layout. Grab it now.
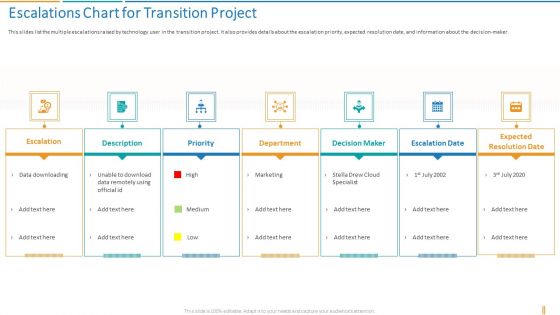
Transformation Plan Escalations Chart For Transition Project Ppt Gallery Tips PDF
This slides list the multiple escalations raised by technology user in the transition project. It also provides details about the escalation priority, expected resolution date, and information about the decision-maker. This is a transformation plan escalations chart for transition project ppt gallery tips pdf template with various stages. Focus and dispense information on seven stages using this creative set, that comes with editable features. It contains large content boxes to add your information on topics like escalation, description, priority, department, decision maker, escalation date, expected resolution date. You can also showcase facts, figures, and other relevant content using this PPT layout. Grab it now.
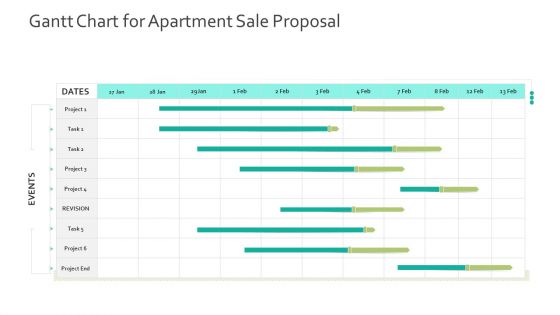
Gantt Chart For Apartment Sale Proposal Human Resource Information System For Organizational Effectiveness Sample PDF
We have summarized the situation in three section that defines the problem and solution for better HR System. This is a Gantt Chart For Apartment Sale Proposal Human Resource Information System For Organizational Effectiveness Sample Pdf template with various stages. Focus and dispense information on three stages using this creative set, that comes with editable features. It contains large content boxes to add your information on topics like process, system, resources, strategic. You can also showcase facts, figures, and other relevant content using this PPT layout. Grab it now.
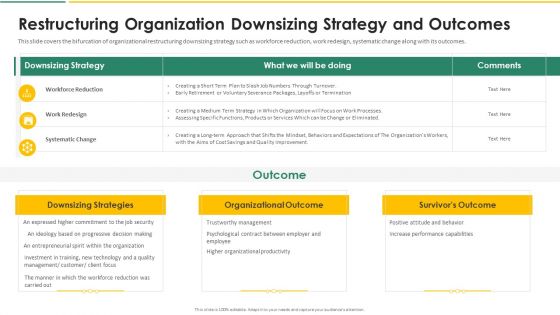
Organization Chart And Corporate Model Transformation Restructuring Organization Downsizing Guidelines PDF
This slide covers the bifurcation of organizational restructuring downsizing strategy such as workforce reduction, work redesign, systematic change along with its outcomes. This is a organization chart and corporate model transformation restructuring organization downsizing guidelines pdf template with various stages. Focus and dispense information on three stages using this creative set, that comes with editable features. It contains large content boxes to add your information on topics like downsizing strategies, organizational outcome, survivors outcome. You can also showcase facts, figures, and other relevant content using this PPT layout. Grab it now.
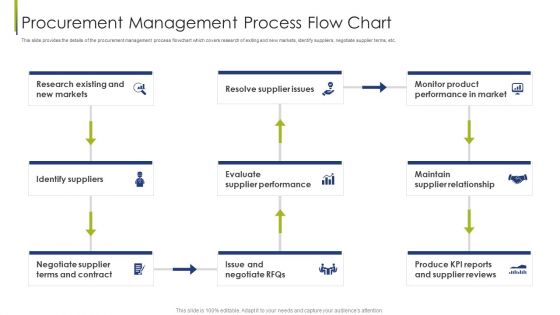
Procurement Management Process Flow Chart Procurement Vendor Ppt Show Graphics Template PDF
This slide provides the details of the procurement management process flowchart which covers research of exiting and new markets, identify suppliers, negotiate supplier terms, etc. This is a procurement management process flow chart procurement vendor ppt show graphics template pdf template with various stages. Focus and dispense information on nine stages using this creative set, that comes with editable features. It contains large content boxes to add your information on topics like resolve supplier issues, supplier performance, terms and contract, supplier reviews. You can also showcase facts, figures, and other relevant content using this PPT layout. Grab it now.
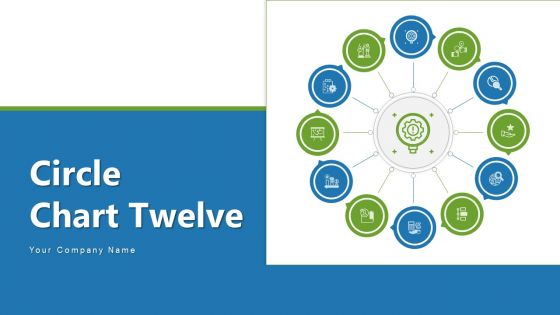
Circle Chart Twelve Budget Planning Ppt PowerPoint Presentation Complete Deck With Slides
Boost your confidence and team morale with this well-structured circle chart twelve budget planning ppt powerpoint presentation complete deck with slides. This prefabricated set gives a voice to your presentation because of its well-researched content and graphics. Our experts have added all the components very carefully, thus helping you deliver great presentations with a single click. Not only that, it contains a set of twelve slides that are designed using the right visuals, graphics, etc. Various topics can be discussed, and effective brainstorming sessions can be conducted using the wide variety of slides added in this complete deck. Apart from this, our PPT design contains clear instructions to help you restructure your presentations and create multiple variations. The color, format, design anything can be modified as deemed fit by the user. Not only this, it is available for immediate download. So, grab it now.
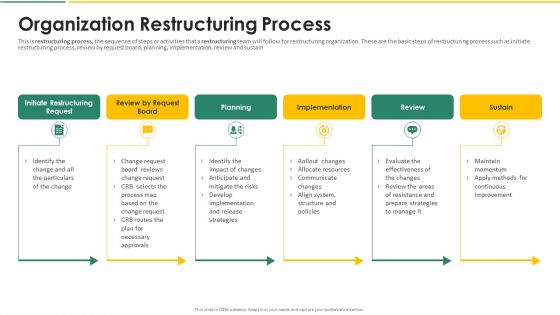
Organization Chart And Corporate Model Transformation Organization Restructuring Process Professional PDF
This is restructuring process, the sequence of steps or activities that a restructuring team will follow for restructuring organization. These are the basic steps of restructuring process such as initiate restructuring process, review by request board, planning, implementation, review and sustain. This is a organization chart and corporate model transformation organization restructuring process professional pdf template with various stages. Focus and dispense information on six stages using this creative set, that comes with editable features. It contains large content boxes to add your information on topics like initiate restructuring process, review by request board, planning, implementation, review. You can also showcase facts, figures, and other relevant content using this PPT layout. Grab it now.
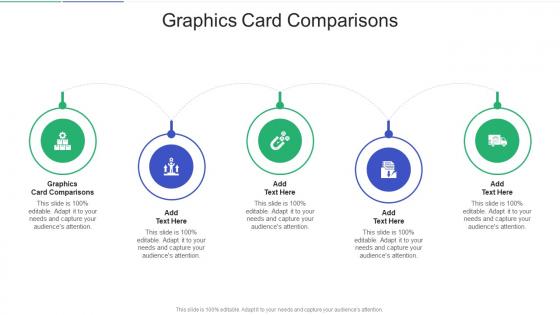
Graphics Card Comparisons In Powerpoint And Google Slides Cpb
Presenting our innovatively-designed set of slides titled Graphics Card Comparisons In Powerpoint And Google Slides Cpb. This completely editable PowerPoint graphic exhibits Graphics Card Comparisons that will help you convey the message impactfully. It can be accessed with Google Slides and is available in both standard screen and widescreen aspect ratios. Apart from this, you can download this well-structured PowerPoint template design in different formats like PDF, JPG, and PNG. So, click the download button now to gain full access to this PPT design.
Criminal Behind Jail Bars Vector Icon Ppt PowerPoint Presentation Gallery Design Inspiration PDF
Pitch your topic with ease and precision using this criminal behind jail bars vector icon ppt powerpoint presentation gallery design inspiration pdf. This layout presents information on criminal behind jail bars vector icon. It is also available for immediate download and adjustment. So, changes can be made in the color, design, graphics or any other component to create a unique layout.
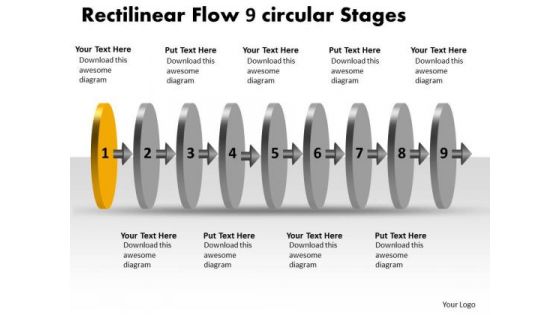
Rectilinear Flow 9 Circular Stages Free Charts PowerPoint Slides
We present our rectilinear flow 9 circular stages free charts PowerPoint Slides.Use our Circle Charts PowerPoint Templates because,The concept and strategy is your strength. Use our Arrows PowerPoint Templates because,You have the moves to sway the market. Use our Design PowerPoint Templates because,You are aware of some pitfalls ahead where you need to be cautious not to overrun and avoid a stall. Use our Shapes PowerPoint Templates because,They have fired the dreams of many fertile minds. Use our Process and Flows PowerPoint Templates because,Individual components well researched and understood in their place.Use these PowerPoint slides for presentations relating to abstract, arrow, blank, business, chart, circular, circulation, concept, conceptual, design, diagram, executive, flow, icon, idea, illustration, linear, management, model, numbers, organization, procedure, process, progression, resource, sequence, sequential, stages, steps, strategy. The prominent colors used in the PowerPoint template are Green, Gray, Black
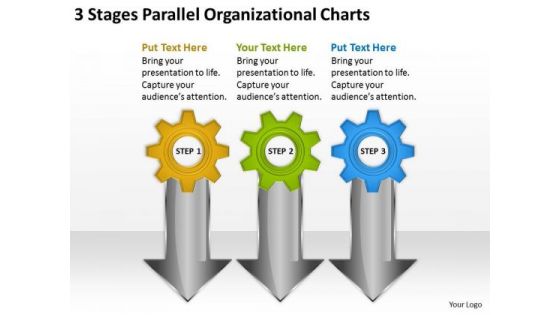
3 Stages Parallel Organizational Charts Business Plan Downloads PowerPoint Slides
We present our 3 stages parallel organizational charts business plan downloads PowerPoint Slides.Use our Arrows PowerPoint Templates because Our PowerPoint Templates and Slides will provide you a launch platform. Give a lift off to your ideas and send them into orbit. Download our Shapes PowerPoint Templates because Our PowerPoint Templates and Slides will Embellish your thoughts. They will help you illustrate the brilliance of your ideas. Download our Gear Wheels PowerPoint Templates because Our PowerPoint Templates and Slides will provide weight to your words. They will bring out the depth of your thought process. Present our Business PowerPoint Templates because you can Set pulses racing with our PowerPoint Templates and Slides. They will raise the expectations of your team. Download our Success PowerPoint Templates because They will Put the wind in your sails. Skim smoothly over the choppy waters of the market.Use these PowerPoint slides for presentations relating to accounting, arrow, ascending, background, bank, blue, business, charts, compare, comparison, computer, corporate, count, descending, fame, famous, finance, generated, gradient, grow, growth, illustration, income, international, linear, money, papers, parallel, percentage, point, record, scale, shares, signs, stock, success, symbols, tax, tip, vary, white, world. The prominent colors used in the PowerPoint template are Yellow, Blue, Green.

Ppt Linear Flow Process Charts 3 Stage PowerPoint Templates
PPT linear flow process charts 3 stage PowerPoint Templates-This PowerPoint diagram can be used in strategy, consulting and marketing presentations-PPT linear flow process charts 3 stage PowerPoint Templates-Advertise, Advertisement, Badge, Box, Business, Card, Collection, Column, Corporate, Costing, Counting, Design, Discount, Element, Featured, Finance, Grid, Hosting, Information, List, Message, Placard, Plan, Price, Pricing, Rectangle, Report, Round
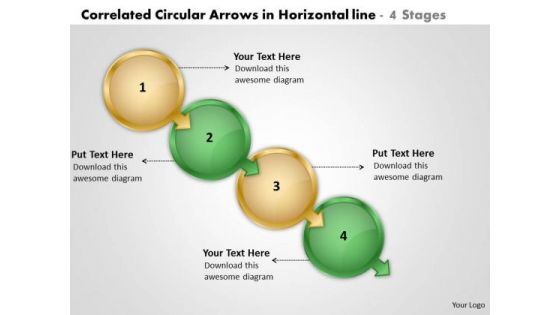
Correlated Circular Arrows In Horizontal Line 4 Stages Create Flow Charts PowerPoint Slides
We present our correlated circular arrows in horizontal line 4 stages create flow charts PowerPoint Slides.Use our Circle Charts PowerPoint Templates because,Motivating your team will cross all barriers. Use our Arrows PowerPoint Templates because,The foundation stones of many a life. Use our Leadership PowerPoint Templates because, You can Show them how to churn out fresh ideas. Use our Business PowerPoint Templates because, You have had your share of being a goldfish in a small bowl.You are ready to launch out and spread your wings Use our Process and Flows PowerPoint Templates because, It can illustrate your chain of ideas focusing on that aspect or resource in order to enhance the quality of your product.Use these PowerPoint slides for presentations relating to 3d, abstract, around, arrows, blue, border, business, center, circle, circular, concept, connections, copy, curve, cycle, directions, distribution, illustration, management, middle, objects, pieces, plan, pointing, process, recycle, rounded, shadows, space, system. The prominent colors used in the PowerPoint template are Yellow, Green, Black. People tell us our correlated circular arrows in horizontal line 4 stages create flow charts PowerPoint Slides will get their audience's attention. The feedback we get is that our circle PowerPoint templates and PPT Slides are Charming. People tell us our correlated circular arrows in horizontal line 4 stages create flow charts PowerPoint Slides are Graceful. Presenters tell us our circle PowerPoint templates and PPT Slides will make you look like a winner. The feedback we get is that our correlated circular arrows in horizontal line 4 stages create flow charts PowerPoint Slides are Romantic. Professionals tell us our around PowerPoint templates and PPT Slides are Adorable.
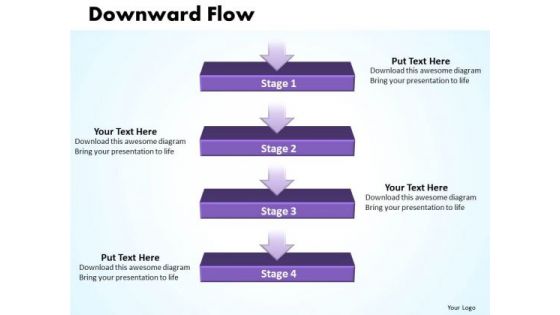
Ppt Linear Flow Process Charts 4 Power Point Stage PowerPoint Templates
PPT linear flow process charts 4 power point stage PowerPoint Templates-This Four State Diagram is a significant modeling technique for analyzing and constructing information processes.-PPT linear flow process charts 4 power point stage PowerPoint Templates-Advertise, Advertisement, Badge, Box, Business, Card, Collection, Column, Corporate, Costing, Counting, Design, Discount, Element, Featured, Finance, Grid, Hosting, Information, List, Message, Placard, Plan, Price, Pricing, Rectangle, Report, Round
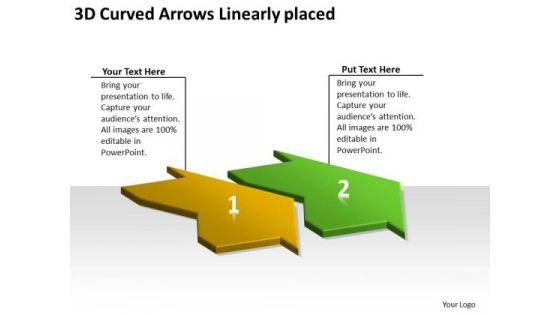
3d Curved Arrows Linearly Placed What Is Flow Charts PowerPoint Templates
We present our 3d curved arrows linearly placed what is flow charts PowerPoint templates.Use our Arrows PowerPoint Templates because, Profit is fairly earned in what you believe. Use our Shapes PowerPoint Templates because,There are a bunch of ideas brewing in your head which give you the heady taste of success. Use our Signs PowerPoint Templates because,With the help of our Slides you can Illustrate your plans on using the many social media modes available to inform soceity at large of the benefits of your product. Use our Business PowerPoint Templates because, You can Lead your flock steadily to greater heights. Look around at the vast potential of achievement around you Use our Process and Flows PowerPoint Templates because,Your listeners do not have to put on their thinking caps.Use these PowerPoint slides for presentations relating to arrow, automobile, city, curve, destination, direction, freeway, grunge, heading, highway, journey, land, landscape, line, linear, marks, motion, multiple, network, paint, path, perspective, pointing, road, sign, speed, street, strip, symbol, track, traffic, transport, transportation, travel, way. The prominent colors used in the PowerPoint template are Yellow, Green, White. People tell us our 3d curved arrows linearly placed what is flow charts PowerPoint templates are Gorgeous. The feedback we get is that our direction PowerPoint templates and PPT Slides are Great. People tell us our 3d curved arrows linearly placed what is flow charts PowerPoint templates are Radiant. Presenters tell us our freeway PowerPoint templates and PPT Slides are Pretty. The feedback we get is that our 3d curved arrows linearly placed what is flow charts PowerPoint templates will save the presenter time. Professionals tell us our city PowerPoint templates and PPT Slides are Great.

Metrics To Measure Results Of Performance Marketing Campaign Ppt PowerPoint Presentation Diagram Graph Charts PDF
This slide showcases metrics that can help organization to track the effectiveness of performance advertisement campaign. Its key components are cost per click, cost per sales, cost per impression and cost per lead Presenting this PowerPoint presentation, titled Metrics To Measure Results Of Performance Marketing Campaign Ppt PowerPoint Presentation Diagram Graph Charts PDF, with topics curated by our researchers after extensive research. This editable presentation is available for immediate download and provides attractive features when used. Download now and captivate your audience. Presenting this Metrics To Measure Results Of Performance Marketing Campaign Ppt PowerPoint Presentation Diagram Graph Charts PDF. Our researchers have carefully researched and created these slides with all aspects taken into consideration. This is a completely customizable Metrics To Measure Results Of Performance Marketing Campaign Ppt PowerPoint Presentation Diagram Graph Charts PDF that is available for immediate downloading. Download now and make an impact on your audience. Highlight the attractive features available with our PPTs.

Graphical Representation Of Research IT Google Charts Tool For Data Visualization Introduction PDF
This slide depicts google charts as the tool for data visualization, which can extract data from various sources, including SQL, databases, google sheets. This is a graphical representation of research it google charts tool for data visualization introduction pdf template with various stages. Focus and dispense information on five stages using this creative set, that comes with editable features. It contains large content boxes to add your information on topics like dynamic, databases, sources, technology. You can also showcase facts, figures, and other relevant content using this PPT layout. Grab it now.
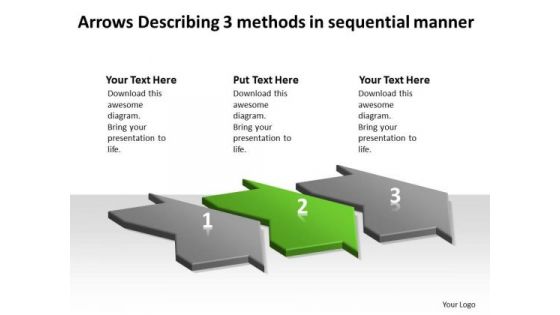
Arrows Describing 3 Methods Sequential Manner Flow Charts Vision PowerPoint Templates
We present our arrows describing 3 methods sequential manner flow charts vision PowerPoint templates.Present our Marketing PowerPoint Templates because they are Designed to attract the attention of your audience. Present our Business PowerPoint Templates because you have selected your team man for man. Download our Process and Flows PowerPoint Templates because you can Highlight the key components of your entire manufacturing/ business process. Use our Shapes PowerPoint Templates because clarity of thought has been the key to your growth. Download and present our Arrows PowerPoint Templates because you have an idea of which you are sure.Use these PowerPoint slides for presentations relating to 3d, Abstract, Around, Arrows, Blue, Border, Business, Center, Circle, Circular, Concept, Connections, Copy, Curve, Cycle, Directions, Distribution, Illustration, Management, Middle, Objects, Pieces, Plan, Pointing, Process, Recycle, Rounded, Shadows, Space, System. The prominent colors used in the PowerPoint template are Green, Gray, Black. People tell us our arrows describing 3 methods sequential manner flow charts vision PowerPoint templates are Wistful. PowerPoint presentation experts tell us our Center PowerPoint templates and PPT Slides are Beautiful. Presenters tell us our arrows describing 3 methods sequential manner flow charts vision PowerPoint templates are Vintage. The feedback we get is that our Arrows PowerPoint templates and PPT Slides are Ultra. You can be sure our arrows describing 3 methods sequential manner flow charts vision PowerPoint templates are One-of-a-kind. Professionals tell us our Circle PowerPoint templates and PPT Slides are Tasteful.
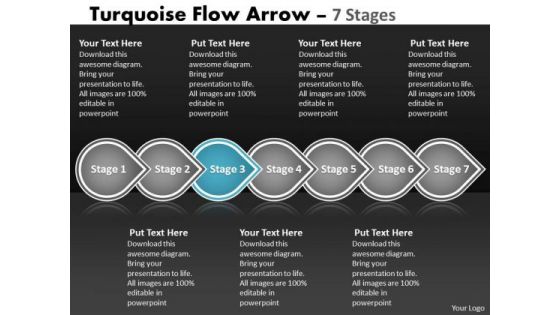
Ppt Theme Continual Seven Phase Diagram Linear Flow Method Charts 4 Design
We present our PPT Theme continual seven phase diagram linear Flow method charts 4 designs. Use our Advertising PowerPoint Templates because; emphasize the benefits of healthy food habits and lifestyles in respect of vital organs of the human anatomy. Use our Shapes PowerPoint Templates because, now fire the arrows to emblazon the desired path by which you will achieve anticipated results. Use our Signs PowerPoint Templates because, Build on your foundation or prepare for change ahead to enhance the future. Use our Marketing PowerPoint Templates because; Get your listeners to put on their thinking caps. Use our Business PowerPoint Templates because; Highlight these individual targets and the paths to their achievement. Use these PowerPoint slides for presentations relating to advertising, arrow, background, banner, bookmark, choice, concept, creative, design, direction, flow, label, layout, manual, marketing, modern, process, product, promotion, sequence, simple, special, step, symbol, tab, tag, turquoise, tutorial, two, vector, . The prominent colors used in the PowerPoint template are Blue, Gray, and White

Deployment Of Digital Twin In Retail Sector Ppt PowerPoint Presentation Diagram Graph Charts PDF
This slide describes the application of digital twin technology in the retail industry and how it can enhance the customer experience and efficient in store planning. This Deployment Of Digital Twin In Retail Sector Ppt PowerPoint Presentation Diagram Graph Charts PDF from Slidegeeks makes it easy to present information on your topic with precision. It provides customization options, so you can make changes to the colors, design, graphics, or any other component to create a unique layout. It is also available for immediate download, so you can begin using it right away. Slidegeeks has done good research to ensure that you have everything you need to make your presentation stand out. Make a name out there for a brilliant performance.

Business Diagrams PowerPoint Templates Business 3d Interconnected Jigsaw Puzzle Pieces Ppt Slides
Business Diagrams PowerPoint Templates Business 3d interconnected jigsaw puzzle pieces PPT Slides- Use this diagram to highlight the performance of your team and remind your team of these key aspects before moving on to the final phases of your strategy or plan.-Business Diagrams PowerPoint Templates Business 3d interconnected jigsaw puzzle pieces PPT Slides-This ppt can be used for concepts relating to-Arrow, Bars, Blue, Business, Chart, Colorful, Comparison, Construction, Development, Estate, Finance etc.
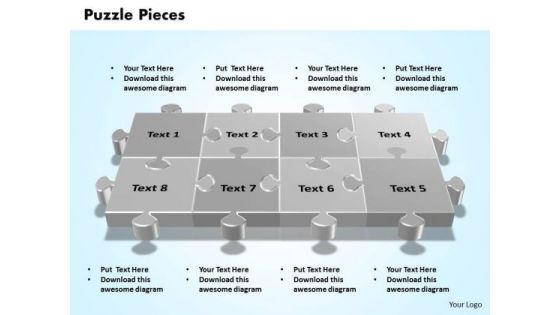
Business Editable PowerPoint Templates Business 3d Interconnected Jigsaw Puzzle Pieces Ppt Slides
Business Editable PowerPoint Templates Business 3d interconnected jigsaw puzzle pieces PPT Slides- Use this diagram to highlight the performance of your team and remind your team of these key aspects before moving on to the final phases of your strategy or plan.-Business Editable PowerPoint Templates Business 3d interconnected jigsaw puzzle pieces PPT Slides-This ppt can be used for concepts relating to-Arrow, Bars, Blue, Business, Chart, Colorful, Comparison, Construction, Development, Estate, Finance, Graff, Grey, Growth, High, Home, House, Illustration, Real, Red
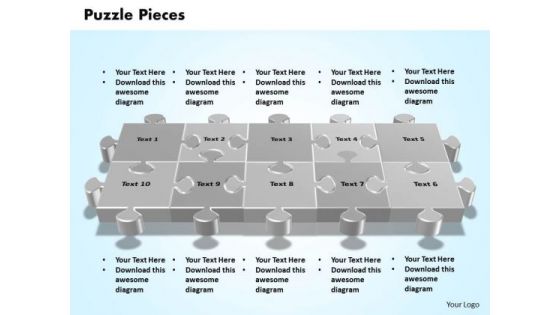
Business Leadership PowerPoint Templates Business 3d Interconnected Jigsaw Puzzle Pieces Ppt Slides
Business Leadership PowerPoint Templates Business 3d interconnected jigsaw puzzle pieces PPT Slides- Use this diagram to highlight the performance of your team and remind your team of these key aspects before moving on to the final phases of your strategy or plan.-Business Leadership PowerPoint Templates Business 3d interconnected jigsaw puzzle pieces PPT Slides-This ppt can be used for concepts relating to-Arrow, Bars, Blue, Business, Chart, Colorful, Comparison, Construction, Development, Estate, Finance Etc.

Business Marketing PowerPoint Templates Business 3d Interconnected Jigsaw Puzzle Pieces Ppt Slides
Business Marketing PowerPoint Templates Business 3d interconnected jigsaw puzzle pieces PPT Slides- Use this diagram to highlight the performance of your team and remind your team of these key aspects before moving on to the final phases of your strategy or plan.-Business Marketing PowerPoint Templates Business 3d interconnected jigsaw puzzle pieces PPT Slides-This ppt can be used for concepts relating to-Arrow, Bars, Blue, Business, Chart, Colorful, Comparison, Construction, Development, Estate, Finance, Etc.

Business Marketing PowerPoint Templates Business Interconnected Jigsaw Puzzle Pieces Ppt Slides
Business Marketing PowerPoint Templates Business interconnected jigsaw puzzle pieces PPT Slides-Use this diagram to highlight the performance of your team and remind your team of these key aspects before moving on to the final phases of your strategy or plan.-Business Marketing PowerPoint Templates Business interconnected jigsaw puzzle pieces PPT Slides-This ppt can be used for concepts relating to-Arrow, Bars, Blue, Business, Chart, Colorful, Comparison, Construction, Development, Estate, Finance, Etc.

Business Process PowerPoint Templates Business Interconnected Jigsaw Puzzle Pieces Ppt Slides
Business Process PowerPoint Templates Business interconnected jigsaw puzzle pieces PPT Slides-Use this diagram to highlight the performance of your team and remind your team of these key aspects before moving on to the final phases of your strategy or plan.-Business Process PowerPoint Templates Business interconnected jigsaw puzzle pieces PPT Slides-This ppt can be used for concepts relating to-Arrow, Bars, Blue, Business, Chart, Colorful, Comparison, Construction, Development, Estate, Finance, Etc.

Business Sales PowerPoint Templates Business Interconnected Jigsaw Puzzle Pieces Ppt Slides
Business Sales PowerPoint Templates Business interconnected jigsaw puzzle pieces PPT Slides-Use this diagram to highlight the performance of your team and remind your team of these key aspects before moving on to the final phases of your strategy or plan.-Business Sales PowerPoint Templates Business interconnected jigsaw puzzle pieces PPT Slides-This ppt can be used for concepts relating to-Arrow, Bars, Blue, Business, Chart, Colorful, Comparison, Construction, Development, Estate, Finance, Etc.

Business Strategy PowerPoint Templates Business Interconnected Jigsaw Puzzle Pieces Ppt Slides
Business Strategy PowerPoint Templates Business interconnected jigsaw puzzle pieces PPT Slides-Use this diagram to highlight the performance of your team and remind your team of these key aspects before moving on to the final phases of your strategy or plan.-Business Strategy PowerPoint Templates Business interconnected jigsaw puzzle pieces PPT Slides-This ppt can be used for concepts relating to-Arrow, Bars, Blue, Business, Chart, Colorful, Comparison, Construction, Development, Estate, Finance, Etc.

Business Success PowerPoint Templates Business 3d Interconnected Jigsaw Puzzle Pieces Ppt Slides
Business Success PowerPoint Templates Business 3d interconnected jigsaw puzzle pieces PPT Slides- Use this diagram to highlight the performance of your team and remind your team of these key aspects before moving on to the final phases of your strategy or plan.-Business Success PowerPoint Templates Business 3d interconnected jigsaw puzzle pieces PPT Slides-This ppt can be used for concepts relating to-Arrow, Bars, Blue, Business, Chart, Colorful, Comparison, Construction, Development Etc.

Business Teamwork PowerPoint Templates Business 3d Interconnected Jigsaw Puzzle Pieces Ppt Slides
Business Teamwork PowerPoint Templates Business 3d interconnected jigsaw puzzle pieces PPT Slides- Use this diagram to highlight the performance of your team and remind your team of these key aspects before moving on to the final phases of your strategy or plan.-Business Teamwork PowerPoint Templates Business 3d interconnected jigsaw puzzle pieces PPT Slides-This ppt can be used for concepts relating to-Arrow, Bars, Blue, Business, Chart, Colorful, Comparison, Construction, Development, Estate, Finance, Graff, Grey, Growth, High, Home, House, Illustration, Etc
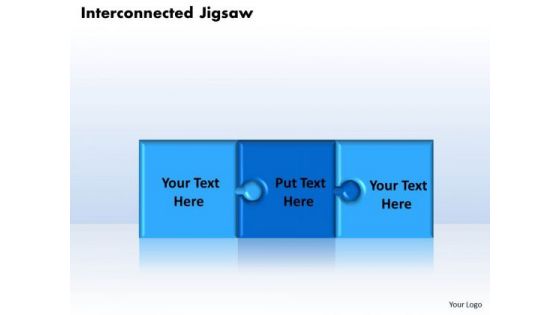
Business Teamwork PowerPoint Templates Business Interconnected Jigsaw Puzzle Pieces Ppt Slides
Business Teamwork PowerPoint Templates Business interconnected jigsaw puzzle pieces PPT Slides-Use this diagram to highlight the performance of your team and remind your team of these key aspects before moving on to the final phases of your strategy or plan.-Business Teamwork PowerPoint Templates Business 3d interconnected jigsaw puzzle pieces PPT Slides-This ppt can be used for concepts relating to-Arrow, Bars, Blue, Business, Chart, Colorful, Comparison, Construction, Development, Etc.
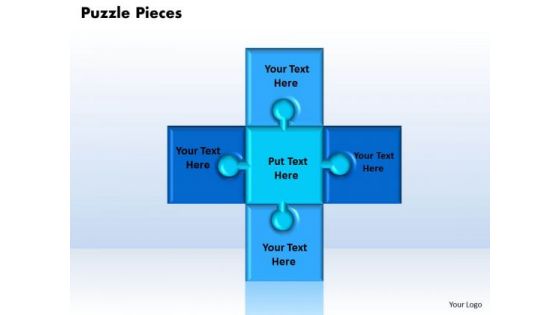
Business Leadership PowerPoint Templates Business Interconnected Jigsaw Puzzle Ppt Slides
Business Leadership PowerPoint Templates Business interconnected jigsaw puzzle PPT Slides-Use this diagram to highlight the performance of your team and remind your team of these key aspects before moving on to the final phases of your strategy or plan.-Business Leadership PowerPoint Templates Business 3d interconnected jigsaw puzzle pieces PPT Slides-This ppt can be used for concepts relating to-Arrow, Bars, Blue, Business, Chart, Colorful, Comparison, Construction, Development, Estate, Finance Etc.
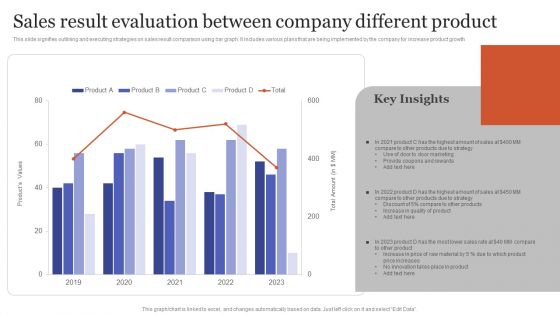
Sales Result Evaluation Between Company Different Product Microsoft PDF
This slide signifies outlining and executing strategies on sales result comparison using bar graph. It includes various plans that are being implemented by the company for increase product growth. Showcasing this set of slides titled Sales Result Evaluation Between Company Different Product Microsoft PDF. The topics addressed in these templates are Door Marketing, Provide Coupons Rewards, Increase Quality Product. All the content presented in this PPT design is completely editable. Download it and make adjustments in color, background, font etc. as per your unique business setting.

Market Share Statistics Of Different IT Cloud Services Providers Topics PDF
This slide represents the market comparison bar graph on market share of different cloud computing service providers. It includes competitive analysis between various companies and there implemented strategies for growth. Showcasing this set of slides titled market share statistics of different it cloud services providers topics pdf. The topics addressed in these templates are largest market share, cloud computing services. All the content presented in this PPT design is completely editable. Download it and make adjustments in color, background, font etc. as per your unique business setting.
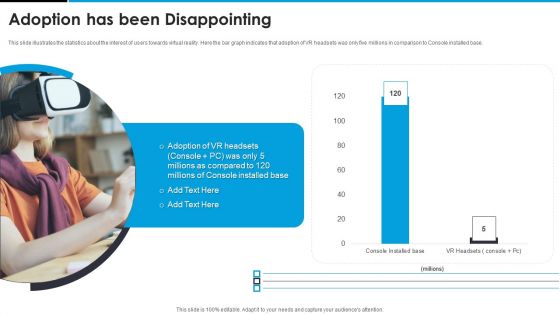
Sandbox VR Venture Capital Financing Pitch Deck Adoption Has Been Disappointing Information PDF
This slide illustrates the statistics about the interest of users towards virtual reality. Here the bar graph indicates that adoption of VR headsets was only five millions in comparison to Console installed base. Deliver an awe inspiring pitch with this creative sandbox vr venture capital financing pitch deck adoption has been disappointing information pdf bundle. Topics like adoption has been disappointing can be discussed with this completely editable template. It is available for immediate download depending on the needs and requirements of the user.
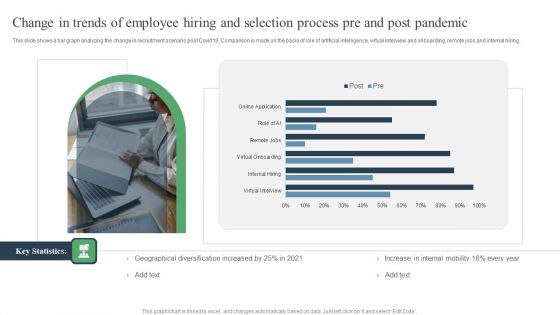
Change In Trends Of Employee Hiring And Selection Process Pre And Post Pandemic Ppt PowerPoint Presentation Images PDF
This slide shows a bar graph analyzing the change in recruitment scenario post Covid19. Comparison is made on the basis of role of artificial intelligence, virtual interview and onboarding, remote jobs and internal hiring. Showcasing this set of slides titled Change In Trends Of Employee Hiring And Selection Process Pre And Post Pandemic Ppt PowerPoint Presentation Images PDF. The topics addressed in these templates are Geographical Diversification, Internal Mobility, Virtual Onboarding. All the content presented in this PPT design is completely editable. Download it and make adjustments in color, background, font etc. as per your unique business setting.
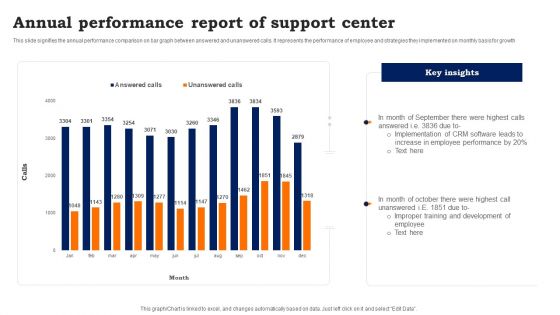
Annual Performance Report Of Support Center Inspiration PDF
This slide signifies the annual performance comparison on bar graph between answered and unanswered calls. It represents the performance of employee and strategies they implemented on monthly basis for growth. Showcasing this set of slides titled Annual Performance Report Of Support Center Inspiration PDF. The topics addressed in these templates are Annual Performance, Report Of Support Center. All the content presented in this PPT design is completely editable. Download it and make adjustments in color, background, font etc. as per your unique business setting.
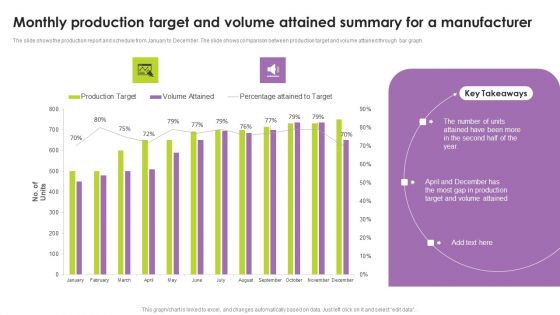
Monthly Production Target And Volume Attained Summary For A Manufacturer Portrait PDF
The slide shows the production report and schedule from January to December. The slide shows comparison between production target and volume attained through bar graph. Pitch your topic with ease and precision using this Monthly Production Target And Volume Attained Summary For A Manufacturer Portrait PDF. This layout presents information on Monthly Production Target, Volume Attained Summary, Manufacturer. It is also available for immediate download and adjustment. So, changes can be made in the color, design, graphics or any other component to create a unique layout.
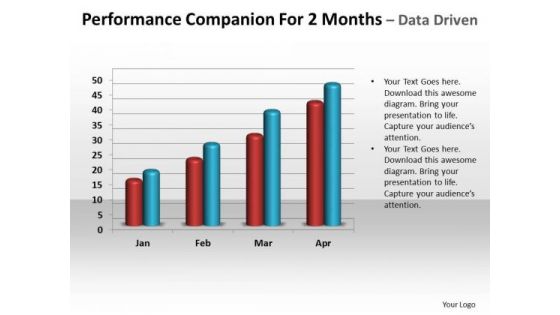
Buinsess Marketing PowerPoint Templates Business Performance Companion For 2 Month Ppt Slides
Business Marketing PowerPoint Template business performance companion for 2 months PPT slide-This PowerPoint Template shows bar chart analysing performance of 2 months of the company. Business Marketing PowerPoint Template business performance companion for 2 months PPT slide-This ppt can be used for concepts relating to-investment, finance, business, Comparison, performance etc.

Business Framework Building Blocks In A Pyramid PowerPoint Presentation
This power point diagram slide has been crafted with graphic of building blocks in a pyramid shape. This PPT slide displays the concept of comparison product launch. Use this image for production and business related presentations.
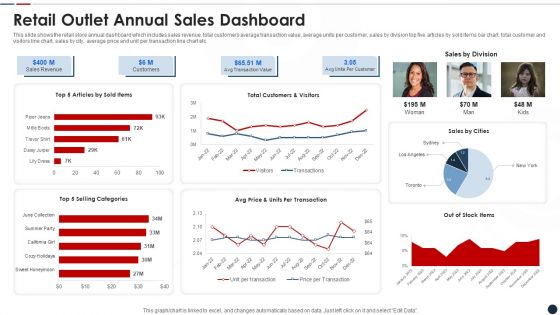
Retail Outlet Annual Sales Dashboard Elements PDF
This slide shows the retail store annual dashboard which includes sales revenue, total customers average transaction value, average units per customer, sales by division top five articles by sold items bar chart, total customer and visitors line chart, sales by city, average price and unit per transaction line chart etc.Pitch your topic with ease and precision using this retail outlet annual sales dashboard elements pdf This layout presents information on Retail outlet annual sales dashboard It is also available for immediate download and adjustment. So, changes can be made in the color, design, graphics or any other component to create a unique layout.
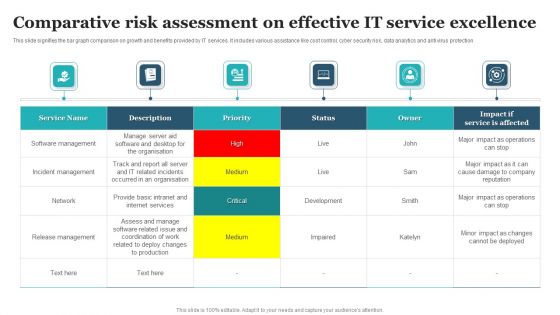
Comparative Risk Assessment On Effective IT Service Excellence Designs PDF
This slide signifies the bar graph comparison on growth and benefits provided by IT services. It includes various assistance like cost control, cyber security risk, data analytics and anti virus protection. Showcasing this set of slides titled Comparative Risk Assessment On Effective IT Service Excellence Designs PDF. The topics addressed in these templates are Software Management, Incident Management, Release Management. All the content presented in this PPT design is completely editable. Download it and make adjustments in color, background, font etc. as per your unique business setting.
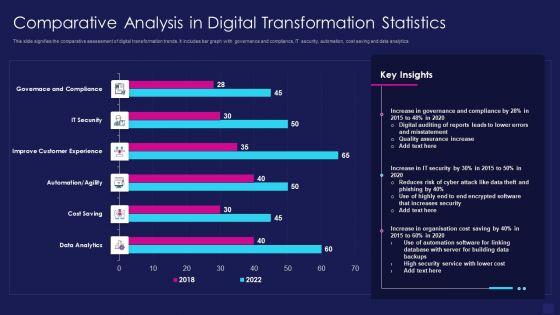
Comparative Analysis In Digital Transformation Statistics Graphics PDF
This slide signifies the comparative assessment of digital transformation trends. It includes bar graph with governance and compliance, IT security, automation, cost saving and data analytics. Showcasing this set of slides titled comparative analysis in digital transformation statistics graphics pdf. The topics addressed in these templates are data analytics, cost saving, improve customer experience. All the content presented in this PPT design is completely editable. Download it and make adjustments in color, background, font etc. as per your unique business setting.

Quality Improvement In Healthcare Institutions And Hospitals Ideas PDF
This slide shows a bar graph of quality improvement in healthcare institutions. Main components covered are patient satisfaction, reducing readmissions and cost savings.Showcasing this set of slides titled Quality Improvement In Healthcare Institutions And Hospitals Ideas PDF The topics addressed in these templates are Improvement Initiatives, Healthcare Institutes ,Focusing Improving All the content presented in this PPT design is completely editable. Download it and make adjustments in color, background, font etc. as per your unique business setting.
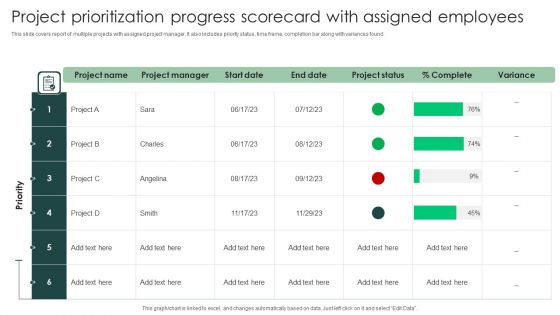
Project Prioritization Progress Scorecard With Assigned Employees Diagrams PDF
This slide covers report of multiple projects with assigned project manager. It also includes priority status, time frame, completion bar along with variances found. Pitch your topic with ease and precision using this Project Prioritization Progress Scorecard With Assigned Employees Diagrams PDF. This layout presents information on Project Prioritization, Progress Scorecard, Assigned Employees. It is also available for immediate download and adjustment. So, changes can be made in the color, design, graphics or any other component to create a unique layout.
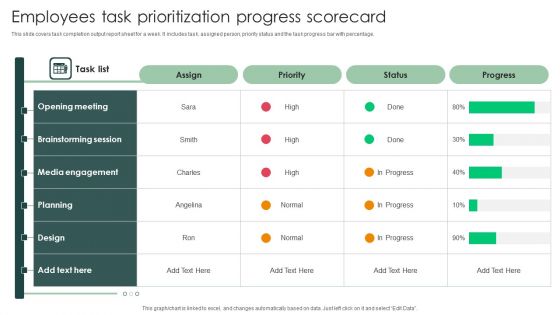
Employees Task Prioritization Progress Scorecard Download PDF
This slide covers task completion output report sheet for a week. It includes task, assigned person, priority status and the task progress bar with percentage.Pitch your topic with ease and precision using this Employees Task Prioritization Progress Scorecard Download PDF. This layout presents information on Communication Skills Development, Manager Training, Area Sales . It is also available for immediate download and adjustment. So, changes can be made in the color, design, graphics or any other component to create a unique layout.

Allocation Of Funds Writing Enhancement Software Pitch Deck PPT Template
This slide presents stacked bar chart highlights areas where raised funds will be allocated. It includes areas such as reach expansion, product feature enhancement, security and communication. The Allocation Of Funds Writing Enhancement Software Pitch Deck PPT Template is a compilation of the most recent design trends as a series of slides. It is suitable for any subject or industry presentation, containing attractive visuals and photo spots for businesses to clearly express their messages. This template contains a variety of slides for the user to input data, such as structures to contrast two elements, bullet points, and slides for written information. Slidegeeks is prepared to create an impression.
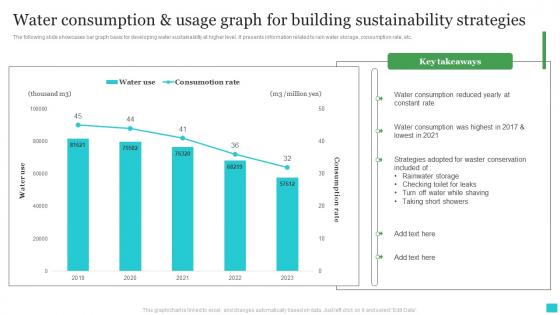
Water Consumption And Usage Graph For Building Sustainability Strategies Ideas Pdf
The following slide showcases bar graph basis for developing water sustainability at higher level. It presents information related to rain water storage, consumption rate, etc. Pitch your topic with ease and precision using this Water Consumption And Usage Graph For Building Sustainability Strategies Ideas Pdf. This layout presents information on Water Consumption, Constant Rate, Rainwater Storage. It is also available for immediate download and adjustment. So, changes can be made in the color, design, graphics or any other component to create a unique layout.

Project Metrics Dashboard With Monthly Sales Professional PDF
This slide focuses on project management dashboard which states the progress of the project, spending on designing, developing and testing of project, monthly sales graph using bar and line chart with number of sales and referrals in 12 months. Pitch your topic with ease and precision using this Project Metrics Dashboard With Monthly Sales Professional PDF. This layout presents information on Project Progress, Project Spend, Sales Graph. It is also available for immediate download and adjustment. So, changes can be made in the color, design, graphics or any other component to create a unique layout.
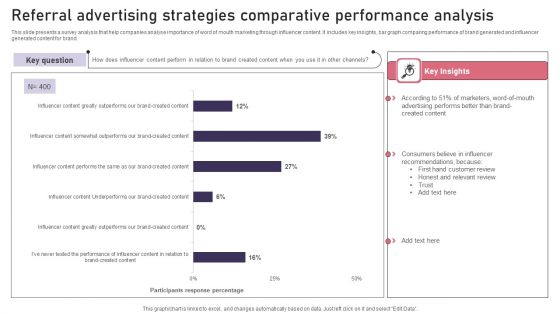
Referral Advertising Strategies Comparative Performance Analysis Diagrams PDF
This slide presents a survey analysis that help companies analyse importance of word of mouth marketing through influencer content. It includes key insights, bar graph comparing performance of brand generated and influencer generated content for brand. Showcasing this set of slides titled Referral Advertising Strategies Comparative Performance Analysis Diagrams PDF. The topics addressed in these templates are Referral Advertising, Strategies Comparative, Performance Analysis. All the content presented in this PPT design is completely editable. Download it and make adjustments in color, background, font etc. as per your unique business setting.

Monthly Cost Comparative Analysis Of Advertising Expenditure Introduction PDF
This slide represents the bar graph on marketing monthly cost comparative analysis for increasing organisation revenue. It includes methods like online, catalogues, conventions, trade shows, print, radio and magazines Pitch your topic with ease and precision using this Monthly Cost Comparative Analysis Of Advertising Expenditure Introduction PDF This layout presents information on Monthly Cost Comparative Analysis Of Advertising Expenditure It is also available for immediate download and adjustment. So, changes can be made in the color, design, graphics or any other component to create a unique layout.

Business Financial Highlights For Planning And Forecasting Background PDF
The slide shows bar graph showing actual and forecasted revenue, expenses and net profit of a company for various financial years. It is done to effectively conduct financial and investment planning for business growth and sustainability. Pitch your topic with ease and precision using this Business Financial Highlights For Planning And Forecasting Background PDF. This layout presents information on Revenue, Expenses And Costs, Net Profit. It is also available for immediate download and adjustment. So, changes can be made in the color, design, graphics or any other component to create a unique layout.
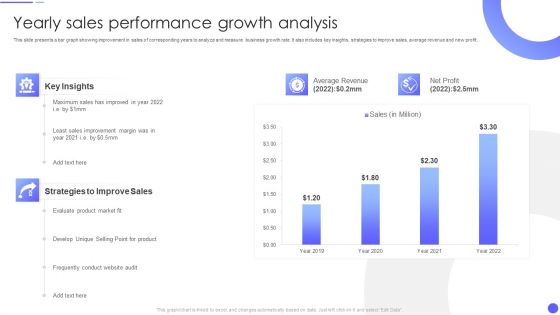
Yearly Sales Performance Growth Analysis Rules PDF
This slide presents a bar graph showing improvement in sales of corresponding years to analyze and measure business growth rate. It also includes key insights, strategies to improve sales, average revenue and new profit.Pitch your topic with ease and precision using this Yearly Sales Performance Growth Analysis Rules PDF This layout presents information on Average Revenue, Strategies To Improve, Sales Improvement It is also available for immediate download and adjustment. So, changes can be made in the color, design, graphics or any other component to create a unique layout.
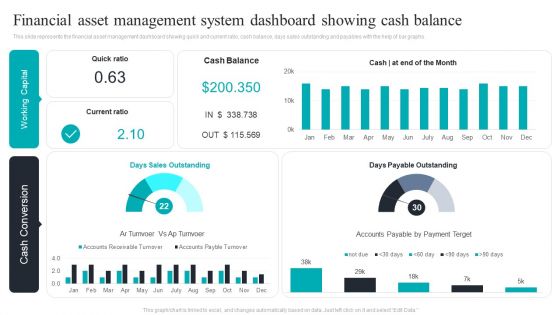
Financial Asset Management System Dashboard Showing Cash Balance Download PDF
This slide represents the financial asset management dashboard showing quick and current ratio, cash balance, days sales outstanding and payables with the help of bar graphs. Pitch your topic with ease and precision using this Financial Asset Management System Dashboard Showing Cash Balance Download PDF. This layout presents information on Financial Asset, Management System, Dashboard Showing, Cash Balance. It is also available for immediate download and adjustment. So, changes can be made in the color, design, graphics or any other component to create a unique layout.
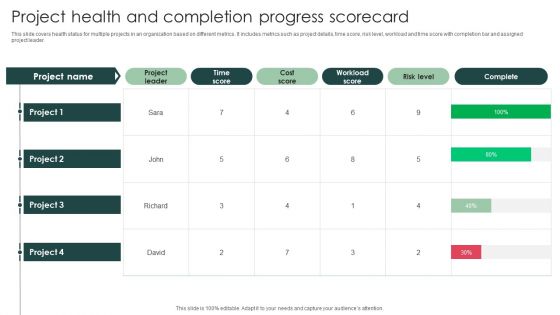
Project Health And Completion Progress Scorecard Designs PDF
This slide covers health status for multiple projects in an organization based on different metrics. It includes metrics such as project details, time score, risk level, workload and time score with completion bar and assigned project leader.Pitch your topic with ease and precision using this Project Health And Completion Progress Scorecard Designs PDF. This layout presents information on Project Leader, Workload Score, Cost Score. It is also available for immediate download and adjustment. So, changes can be made in the color, design, graphics or any other component to create a unique layout.
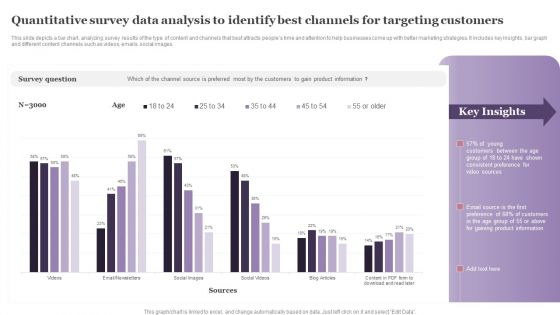
Quantitative Survey Data Analysis To Identify Best Channels For Targeting Customers Formats PDF
This slide depicts a bar chart, analyzing survey results of the type of content and channels that best attracts peoples time and attention to help businesses come up with better marketing strategies. It includes key insights, bar graph and different content channels such as videos, emails, social images. Pitch your topic with ease and precision using this Quantitative Survey Data Analysis To Identify Best Channels For Targeting Customers Formats PDF. This layout presents information on Survey Question, Young Customers, Consistent Preference. It is also available for immediate download and adjustment. So, changes can be made in the color, design, graphics or any other component to create a unique layout.

 Home
Home