Bar Chart Comparison

Comparison Of Present Vs Future Actions In Business Management Ppt PowerPoint Presentation Model Vector PDF
Persuade your audience using this comparison of present vs future actions in business management ppt powerpoint presentation model vector pdf. This PPT design covers six stages, thus making it a great tool to use. It also caters to a variety of topics including problem discovered, field investigates problem, plan, assign number and prepare modification file, define statement of work, project manger enters into project tracking system. Download this PPT design now to present a convincing pitch that not only emphasizes the topic but also showcases your presentation skills.

Retail Outlet Revenue Growth Chart Mockup PDF
This slide shows the revenue growth line chart of a retail store which includes passing footfall, customers per day, percentage of customer who purchased, revenue per day and revenue per year. Pitch your topic with ease and precision using this retail outlet revenue growth chart mockup pdf This layout presents information on Retail outlet revenue growth chart It is also available for immediate download and adjustment. So, changes can be made in the color, design, graphics or any other component to create a unique layout.
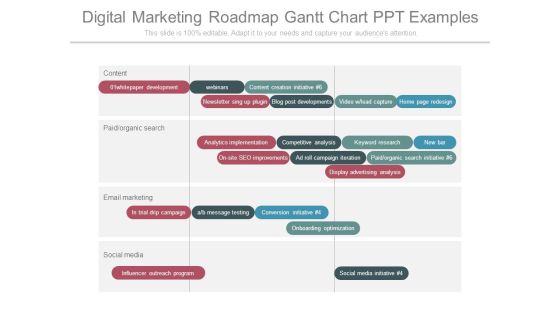
Digital Marketing Roadmap Gantt Chart Ppt Examples
This is a digital marketing roadmap gantt chart ppt examples. This is a two stage process. The stages in this process are content, whitepaper development, webinars, content creation initiative, newsletter sing up plugin, blog post developments, video lead capture, home page redesign, paid organic search, analytics implementation, competitive analysis, keyword research, new bar, on site seo improvements, ad roll campaign iteration, paid organic search initiative, display advertising analysis, email marketing, trial drip campaign, a b message testing, conversion initiative, onboarding optimization, social media, influencer outreach program, social media initiative.
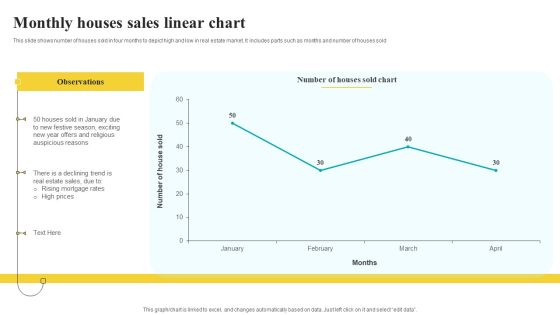
Monthly Houses Sales Linear Chart Pictures PDF
This slide shows number of houses sold in four months to depict high and low in real estate market. It includes parts such as months and number of houses sold Pitch your topic with ease and precision using this Monthly Houses Sales Linear Chart Pictures PDF. This layout presents information on Observations, Auspicious Reasons, Sales Linear Chart. It is also available for immediate download and adjustment. So, changes can be made in the color, design, graphics or any other component to create a unique layout.

Business Training Components Chart Sample Presentation Ppt
This is a business training components chart sample presentation ppt. This is a three stage process. The stages in this process are training, knowledge, skills, competencies.

Advisor Financial Marketing Plan Chart Presentation Ideas
This is a advisor financial marketing plan chart presentation ideas. This is a two stage process. The stages in this process are product service price, feature, benefit.

Vehicle Sales Plunge In An Automobile Firm Additional Unit Sold Comparison In Three Market Scenarios Introduction PDF
The slide shows the line graph comparison of additional vehicle sold in three different market scenarios Positive, Average and Negative. The value is provided for the next five years 2020 2024 Deliver an awe inspiring pitch with this creative vehicle sales plunge in an automobile firm additional unit sold comparison in three market scenarios introduction pdf bundle. Topics like additional unit sold comparison in three market scenarios can be discussed with this completely editable template. It is available for immediate download depending on the needs and requirements of the user.
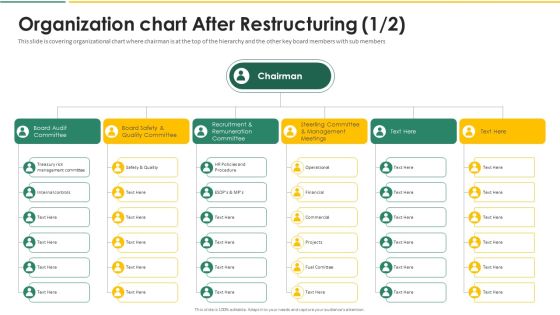
Organization Chart And Corporate Model Transformation Organization Chart After Microsoft PDF
This slide is covering organizational chart where chairman is at the top of the hierarchy and the other key board members with sub members. This is a organization chart and corporate model transformation organization chart after microsoft pdf template with various stages. Focus and dispense information on six stages using this creative set, that comes with editable features. It contains large content boxes to add your information on topics like board audit committee, board safety and quality committee, recruitment and remuneration committee, steerling committee and management meetings. You can also showcase facts, figures, and other relevant content using this PPT layout. Grab it now.

Investment Pitch To Generate Capital From Series B Venture Round Series A To Series B Funding Comparison Clipart PDF
The slide provides the comparison of funding between the series A Angel Investors and series B Private Equity Investors, Venture Capitalists funding with commitments. Presenting investment pitch to generate capital from series b venture round series a to series b funding comparison clipart pdf to provide visual cues and insights. Share and navigate important information on two stages that need your due attention. This template can be used to pitch topics like committed, angel investments, total number shares, private equity investors, venture capitalists. In addition, this PPT design contains high-resolution images, graphics, etc, that are easily editable and available for immediate download.

Daily Guests And Subscribers Linear Chart Clipart PDF
This slide illustrates comparison chart of subscribers and guests on daily basis to measure website success. It includes days and number of subscribers Pitch your topic with ease and precision using this Daily Guests And Subscribers Linear Chart Clipart PDF. This layout presents information on Key Insight, Website, Subscribers Chart. It is also available for immediate download and adjustment. So, changes can be made in the color, design, graphics or any other component to create a unique layout.

Comparative Medical Services Trend Linear Chart Mockup PDF
This slide depicts the comparison of medical services across the globe based on the revenue generated. It includes Asia, North America, South America, Europe and Middle east Showcasing this set of slides titled Comparative Medical Services Trend Linear Chart Mockup PDF. The topics addressed in these templates are Observations, Comparative Medical Services, Linear Chart. All the content presented in this PPT design is completely editable. Download it and make adjustments in color, background, font etc. as per your unique business setting.

Enterprise Quarterly Income And Expenditure Performance Chart Graphics PDF
This slide depicts total income and expenses incurred annually. It represents the value of the income to expenses for each pair of bars, by quarter and variance is the profit earned. Pitch your topic with ease and precision using this Enterprise Quarterly Income And Expenditure Performance Chart Graphics PDF. This layout presents information on Expenses Surpassed Income, Sales, Huge Profit. It is also available for immediate download and adjustment. So, changes can be made in the color, design, graphics or any other component to create a unique layout.
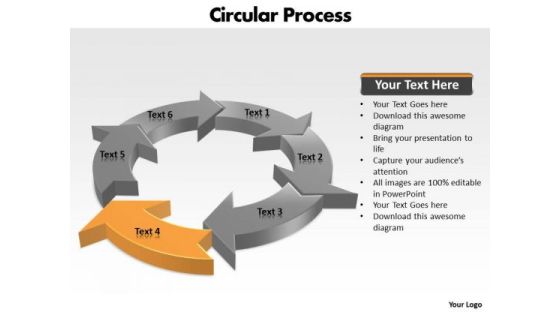
Ppt Components Of Circular PowerPoint Menu Template Process Chart Templates
PPT components of circular powerpoint menu template process chart Templates-This circular flow diagram can helps to illustrate the economic exchange that takes place in the building of wealth. Clarity of thought has been the key to your growth. Use our template to illustrate your ability.-PPT components of circular powerpoint menu template process chart Templates-Arrow, Chart, Circular, Color, Colorful, Connect, Connection, Design, Diagram, Finance, Graphic, Group, Growth, Icon, Illustration, Marketing, Pieces, Process, Recycle, Recycling, Round, Set, Strategy, Symbol, Wheel

Agile Project Incremental Life Cycles Plan Gantt Chart Guidelines PDF
This slide covers gantt chart of agile project iteration tasks. It includes tasks such as sprint planning, set up staging environment, configure multilingual features, create base theme, etc. Along with assigned persons and task progress bars. Showcasing this set of slides titled Agile Project Incremental Life Cycles Plan Gantt Chart Guidelines PDF. The topics addressed in these templates are Agile Project Plan, Sprint Planning, Assemble Template. All the content presented in this PPT design is completely editable. Download it and make adjustments in color, background, font etc. as per your unique business setting.

Digital Marketing Approach For Brand Awareness Line Chart Themes PDF
This Digital Marketing Approach For Brand Awareness Line Chart Themes PDF is perfect for any presentation, be it in front of clients or colleagues. It is a versatile and stylish solution for organizing your meetings. The Digital Marketing Approach For Brand Awareness Line Chart Themes PDF features a modern design for your presentation meetings. The adjustable and customizable slides provide unlimited possibilities for acing up your presentation. Slidegeeks has done all the homework before launching the product for you. So, dont wait, grab the presentation templates today
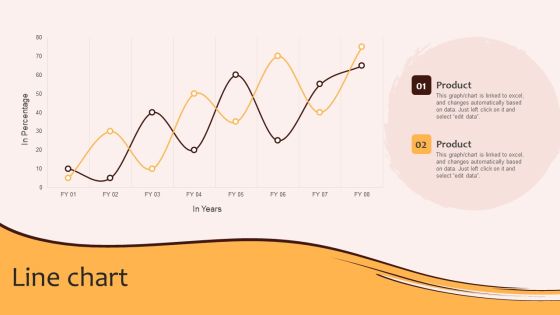
Line Chart Digital Marketing Plan For Restaurant Business Template PDF
Are you searching for a Line Chart Digital Marketing Plan For Restaurant Business Template PDF that is uncluttered, straightforward, and original Its easy to edit, and you can change the colors to suit your personal or business branding. For a presentation that expresses how much effort you have put in, this template is ideal With all of its features, including tables, diagrams, statistics, and lists, its perfect for a business plan presentation. Make your ideas more appealing with these professional slides. Download Line Chart Digital Marketing Plan For Restaurant Business Template PDF from Slidegeeks today.
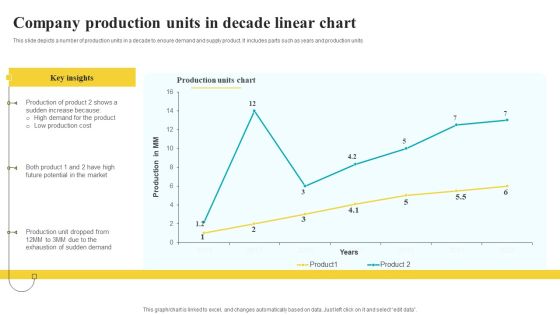
Company Production Units In Decade Linear Chart Designs PDF
This slide depicts a number of production units in a decade to ensure demand and supply product. It includes parts such as years and production units Pitch your topic with ease and precision using this Company Production Units In Decade Linear Chart Designs PDF. This layout presents information on Key Insights, Production Units Chart, Linear Chart. It is also available for immediate download and adjustment. So, changes can be made in the color, design, graphics or any other component to create a unique layout.

Digital Marketing Roadmap Gantt Chart Powerpoint Slides Design
This is a digital marketing roadmap gantt chart powerpoint slides design. This is a four stage process. The stages in this process are content, whitepaper development, webinars, content creation initiative, newsletter sing up plugin, blog post developments, video lead capture, home page redesign, paid organic search, analytics implementation, competitive analysis, keyword research, new bar, on site seo improvements, ad roll campaign iteration, display advertising analysis, paid organic search initiative, email marketing, trial drip campaign, a b message testing, conversion initiative, onboarding optimization, social media, influencer outreach program , social media initiative.
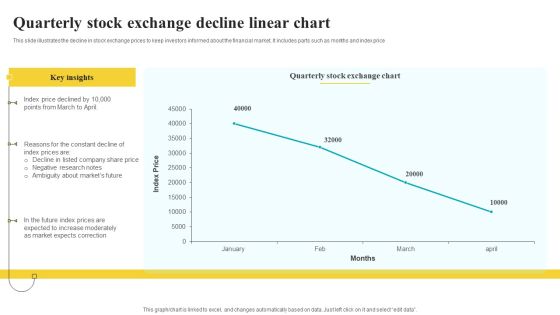
Quarterly Stock Exchange Decline Linear Chart Inspiration PDF
This slide illustrates the decline in stock exchange prices to keep investors informed about the financial market. It includes parts such as months and index price Pitch your topic with ease and precision using this Quarterly Stock Exchange Decline Linear Chart Inspiration PDF. This layout presents information on Key Insights, Exchange Chart, Correction. It is also available for immediate download and adjustment. So, changes can be made in the color, design, graphics or any other component to create a unique layout.
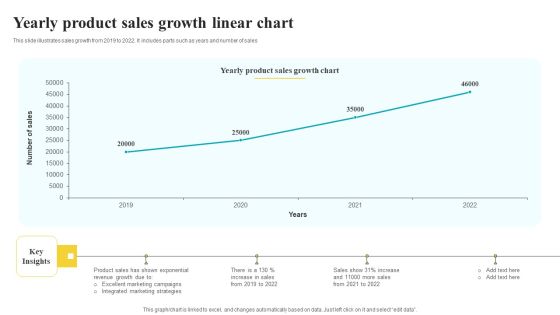
Yearly Product Sales Growth Linear Chart Pictures PDF
This slide illustrates sales growth from 2019 to 2022. It includes parts such as years and number of sales Pitch your topic with ease and precision using this Yearly Product Sales Growth Linear Chart Pictures PDF. This layout presents information on Sales Growth Chart, Key Insights, Strategies. It is also available for immediate download and adjustment. So, changes can be made in the color, design, graphics or any other component to create a unique layout.

Correlated Arrows 2 Steps Technical Flow Chart PowerPoint Templates
We present our correlated arrows 2 steps technical flow chart PowerPoint templates.Use our Business PowerPoint Templates because, Infrastructure growth is an obvious requirement of today.Inform your group on how exactly this potential is tailor made for you Use our Arrows PowerPoint Templates because,This PPT slide helps you to measure key aspects of the current process and collect relevant data Use our Shapes PowerPoint Templates because,You have the ideas, you have got a brainwave. Use our Design PowerPoint Templates because,firing the arrows to emblazon the desired path will let you achieve anticipated results. Use our Abstract PowerPoint Templates because,Leading from the front is your preferred style. Use these PowerPoint slides for presentations relating to abstract, arrow, arrows, business, chart, design, development, diagram, direction, element, flow, flowchart, graph, linear, management, model, motion, organization, plan, process, program, section, segment, set, sign, solution, strategy, symbol, technology. The prominent colors used in the PowerPoint template are Blue, Blue navy, White. People tell us our correlated arrows 2 steps technical flow chart PowerPoint templates are Fantastic. The feedback we get is that our business PowerPoint templates and PPT Slides are Fabulous. People tell us our correlated arrows 2 steps technical flow chart PowerPoint templates are Playful. Presenters tell us our arrows PowerPoint templates and PPT Slides are Pretty. The feedback we get is that our correlated arrows 2 steps technical flow chart PowerPoint templates are Fashionable. Professionals tell us our chart PowerPoint templates and PPT Slides are aesthetically designed to attract attention. We guarantee that they will grab all the eyeballs you need.

Line Chart Representing Outcomes Summary Of Product Sales Mockup PDF
This slide shows the graphical representation of sales volume of company products which includes product A , B and C which helps company to analyze the acceptability of products by potential customers.Pitch your topic with ease and precision using this Line Chart Representing Outcomes Summary Of Product Sales Mockup PDF This layout presents information on Company Generated, Maximum Revenues, Increasing For Product It is also available for immediate download and adjustment. So, changes can be made in the color, design, graphics or any other component to create a unique layout.

Strategic Brand Refreshing Actions Line Chart Information PDF
This Strategic Brand Refreshing Actions Line Chart Information PDF from Slidegeeks makes it easy to present information on your topic with precision. It provides customization options, so you can make changes to the colors, design, graphics, or any other component to create a unique layout. It is also available for immediate download, so you can begin using it right away. Slidegeeks has done good research to ensure that you have everything you need to make your presentation stand out. Make a name out there for a brilliant performance.
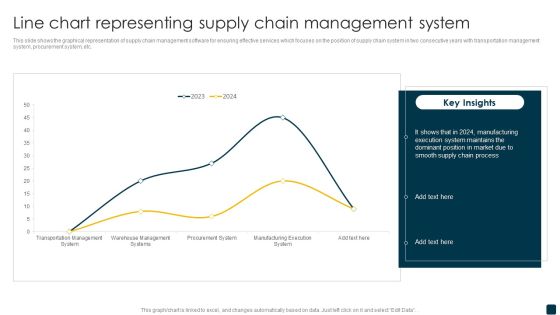
Line Chart Representing Supply Chain Management System Rules PDF
This slide shows the graphical representation of supply chain management software for ensuring effective services which focuses on the position of supply chain system in two consecutive years with transportation management system, procurement system, etc. Pitch your topic with ease and precision using this Line Chart Representing Supply Chain Management System Rules PDF. This layout presents information on Supply Chain Process, Manufacturing, Execution System. It is also available for immediate download and adjustment. So, changes can be made in the color, design, graphics or any other component to create a unique layout.

Business Growth Strategy Circular Resource Allocation Chart Consultant
We present our business growth strategy circular resource allocation chart consultant.Download our Advertising PowerPoint Templates because Watching this your Audience will Grab their eyeballs, they wont even blink. Download and present our Process and Flows PowerPoint Templates because It will Strengthen your hand with your thoughts. They have all the aces you need to win the day. Present our Circle Charts PowerPoint Templates because Your audience will believe you are the cats whiskers. Download and present our Business PowerPoint Templates because Our PowerPoint Templates and Slides will provide you the cutting edge. Slice through the doubts in the minds of your listeners. Download and present our Metaphors-Visual Concepts PowerPoint Templates because Our PowerPoint Templates and Slides will effectively help you save your valuable time. They are readymade to fit into any presentation structure. Use these PowerPoint slides for presentations relating to Arrow, chart, circle, circular, circulation, concept, connection, continuity, correlate, course, cycle, cyclic, diagram, direction, duplicate, flow, iterate, jigsaw, link, manage, method, order, phase, presentation, procedure, process, react, recycle, refresh, relate, repeat, repetition, report, review, ring, rotation, round, section, segment, sequence, simple, stage, step, strategy, success, system, work flow. The prominent colors used in the PowerPoint template are Green, Black, Gray.

5 Reinforcing Components Arrow Diagram Chart Business Prototyping PowerPoint Slides
We present our 5 reinforcing components arrow diagram chart business prototyping PowerPoint Slides.Use our Arrows PowerPoint Templates because it shows the pyramid which is a symbol of the desire to reach the top in a steady manner. Present our Business PowerPoint Templates because watch the excitement levels rise as they realise their worth. Download and present our Competition PowerPoint Templates because you know your business and have a vision for it. Use our Design PowerPoint Templates because your business and plans for its growth consist of processes that are highly co-related. Download and present our Shapes PowerPoint Templates because the atmosphere in the worplace is electric.Use these PowerPoint slides for presentations relating to arrow, arrows, block, business, chart, design, development, diagram, direction, element, flow, flowchart, graph, linear, management, organization, process, program, section, sign, solution, symbol. The prominent colors used in the PowerPoint template are Blue, Gray, Black. Professionals tell us our 5 reinforcing components arrow diagram chart business prototyping PowerPoint Slides are Efficacious. The feedback we get is that our block PowerPoint templates and PPT Slides are Appealing. We assure you our 5 reinforcing components arrow diagram chart business prototyping PowerPoint Slides are designed by professionals Customers tell us our chart PowerPoint templates and PPT Slides are Fantastic. Presenters tell us our 5 reinforcing components arrow diagram chart business prototyping PowerPoint Slides are Fun. People tell us our block PowerPoint templates and PPT Slides are Nice.

5 Reinforcing Components Arrow Diagram Typical Flow Chart PowerPoint Templates
We present our 5 reinforcing components arrow diagram typical flow chart PowerPoint templates.Download our Arrows PowerPoint Templates because they highlight the depth of your thought process. Download our Business PowerPoint Templates because you have had your share of being a goldfish in a small bowl.you are ready to launch out and spread your wings. Use our Competition PowerPoint Templates because this is an appropriate layout to convince your team that they have the ability to score a tEN every time. Download and present our Design PowerPoint Templates because it is all there in bits and pieces. Download our Shapes PowerPoint Templates because it Shines the light on your thoughts and motivates your team to improve the quality of celebration for all around you.Use these PowerPoint slides for presentations relating to arrow, arrows, block, business, chart, design, development, diagram, direction, element, flow, flowchart, graph, linear, management, organization, process, program, section, sign, solution, symbol. The prominent colors used in the PowerPoint template are Green, Gray, Black. Professionals tell us our 5 reinforcing components arrow diagram typical flow chart PowerPoint templates are Bright. The feedback we get is that our direction PowerPoint templates and PPT Slides are the best it can get when it comes to presenting. We assure you our 5 reinforcing components arrow diagram typical flow chart PowerPoint templates are Spectacular. Customers tell us our business PowerPoint templates and PPT Slides are Glamorous. Presenters tell us our 5 reinforcing components arrow diagram typical flow chart PowerPoint templates are Nostalgic. People tell us our block PowerPoint templates and PPT Slides are Second to none.

PowerPoint Theme Chart 8x8 Rectangular Jigsaw Puzzle Matrix Ppt Design
PowerPoint Theme Chart 8x8 Rectangular Jigsaw Puzzle Matrix PPT Design-It is all there in bits and pieces. Individual components well researched and understood in their place. Now you need to get it all together to form the complete picture and reach the goal. You have the ideas and plans on how to go about it. Use this template to illustrate your method, piece by piece, and interlock the whole process in the minds of your audience. It is a 15x15 225 pieces 3D Rectangular Jigsaw Puzzle Matrix.-PowerPoint Theme Chart 8x8 Rectangular Jigsaw Puzzle Matrix PPT Design

PowerPoint Backgrounds Chart 4x3 Rectangular Jigsaw Puzzle Matrix Ppt Design
PowerPoint Backgrounds Chart 4x3 Rectangular Jigsaw Puzzle Matrix PPT Design-It is all there in bits and pieces. Individual components well researched and understood in their place. Now you need to get it all together to form the complete picture and reach the goal. You have the ideas and plans on how to go about it. Use this template to illustrate your method, piece by piece, and interlock the whole process in the minds of your audience. It is a 4x3 12 pieces Rectangular Jigsaw Puzzle Matrix.-PowerPoint Backgrounds Chart 4x3 Rectangular Jigsaw Puzzle Matrix PPT Design

Construction Labour Safety Training Chart To Optimize Output Themes PDF
The following slide depicts a chart to organise and implement safety training at construction workplace. It includes elements such as assess training requirements, plan and launch training program and monitor capability. Persuade your audience using this Construction Labour Safety Training Chart To Optimize Output Themes PDF. This PPT design covers four stages, thus making it a great tool to use. It also caters to a variety of topics including Manufacturing Productivity, Construction Output, Comparative Analysis. Download this PPT design now to present a convincing pitch that not only emphasizes the topic but also showcases your presentation skills.

PowerPoint Design Slides Chart Rectangular Jigsaw Puzzle Ppt Designs
PowerPoint Design Slides Chart Rectangular Jigsaw Puzzle PPT Designs- It is all there in bits and pieces. Individual components well researched and understood in their place. Now you need to get it all together to form the complete picture and reach the goal. You have the ideas and plans on how to go about it. Use this template to illustrate your method, piece by piece, and interlock the whole process in the minds of your audience.-PowerPoint Design Slides Chart Rectangular Jigsaw Puzzle PPT Designs

PowerPoint Slide Layout Chart Rectangular Jigsaw Puzzle Ppt Template
PowerPoint Slide layout Chart Rectangular Jigsaw Puzzle PPT Template- It is all there in bits and pieces. Individual components well researched and understood in their place. Now you need to get it all together to form the complete picture and reach the goal. You have the ideas and plans on how to go about it. Use this template to illustrate your method, piece by piece, and interlock the whole process in the minds of your audience.-PowerPoint Slide layout Chart Rectangular Jigsaw Puzzle PPT Template

Packaged Food Firm Description Organization Chart Topics PDF
The slide highlights the organizational hierarchy chart for company. It depicts board of directors, chairman, chief executing officer, president, chief operating officer, chief of research and development,, chief of operations, chief of finance, chief of corporate compliance and chief of human resource.This is a Packaged Food Firm Description Organization Chart Topics PDF template with various stages. Focus and dispense information on six stages using this creative set, that comes with editable features. It contains large content boxes to add your information on topics like Asia Accounts, Average Rating, Key Insights. You can also showcase facts, figures, and other relevant content using this PPT layout. Grab it now.
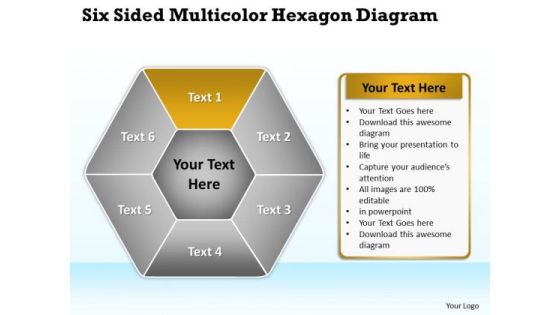
Business Diagram Chart Hexagon PowerPoint Templates Backgrounds For Slides
We present our business diagram chart hexagon PowerPoint templates backgrounds for slides.Use our Hexagon PowerPoint Templates because Our Template designs are State of the Art. Download our Business PowerPoint Templates because you have secured a name for yourself in the domestic market. Now the time is right to spread your reach to other countries. Present our Marketing PowerPoint Templates because The marketplace is the merger of your dreams and your ability. Download our Process and Flows PowerPoint Templates because it shows the pyramid which is a symbol of the desire to reach the top in a steady manner. Use our Shapes PowerPoint Templates because you have good reasons to back up the strength of your belief.Use these PowerPoint slides for presentations relating to Attached, Backgrounds, Blue, Cell, Color, Component, Connect, Connection, Diagram, Elements, Geometric, Graphic, Group, Hexagon, Honeycomb, Icon, Illustration, Intricacy, Lines, Link, Map, Mesh, Model, Network, Science, Shape, Shiny, Strategy, Structure, Symbol, Teamwork, Technology. The prominent colors used in the PowerPoint template are Yellow, White, Gray. PowerPoint presentation experts tell us our business diagram chart hexagon PowerPoint templates backgrounds for slides are Elegant. Professionals tell us our Cell PowerPoint templates and PPT Slides are effectively colour coded to prioritise your plans They automatically highlight the sequence of events you desire. People tell us our business diagram chart hexagon PowerPoint templates backgrounds for slides have awesome images to get your point across. We assure you our Blue PowerPoint templates and PPT Slides are Fancy. PowerPoint presentation experts tell us our business diagram chart hexagon PowerPoint templates backgrounds for slides are Endearing. Professionals tell us our Blue PowerPoint templates and PPT Slides are Liberated.

Line Chart Ppt PowerPoint Presentation Complete Deck With Slides
This Line Chart Ppt PowerPoint Presentation Complete Deck With Slides acts as backup support for your ideas, vision, thoughts, etc. Use it to present a thorough understanding of the topic. This PPT slideshow can be utilized for both in-house and outside presentations depending upon your needs and business demands. Entailing twelve slides with a consistent design and theme, this template will make a solid use case. As it is intuitively designed, it suits every business vertical and industry. All you have to do is make a few tweaks in the content or any other component to design unique presentations. The biggest advantage of this complete deck is that it can be personalized multiple times once downloaded. The color, design, shapes, and other elements are free to modify to add personal touches. You can also insert your logo design in this PPT layout. Therefore a well-thought and crafted presentation can be delivered with ease and precision by downloading this Line Chart Ppt PowerPoint Presentation Complete Deck With Slides PPT slideshow.

Headline Footer Section Chart Table Ppt PowerPoint Presentation Complete Deck
Boost your confidence and team morale with this well-structured headline footer section chart table ppt powerpoint presentation complete deck. This prefabricated set gives a voice to your presentation because of its well-researched content and graphics. Our experts have added all the components very carefully, thus helping you deliver great presentations with a single click. Not only that, it contains a set of eleven slides that are designed using the right visuals, graphics, etc. Various topics can be discussed, and effective brainstorming sessions can be conducted using the wide variety of slides added in this complete deck. Apart from this, our PPT design contains clear instructions to help you restructure your presentations and create multiple variations. The color, format, design anything can be modified as deemed fit by the user. Not only this, it is available for immediate download. So, grab it now.
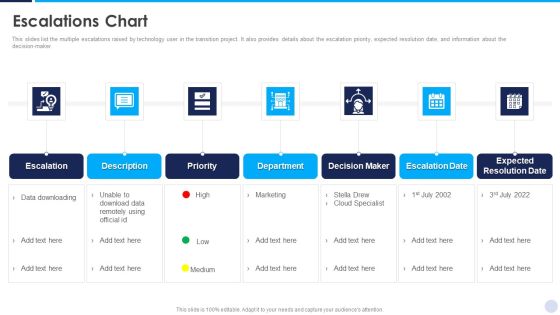
Implementation Strategy For Project Solution Escalations Chart Clipart PDF
This slides list the multiple escalations raised by technology user in the transition project. It also provides details about the escalation priority, expected resolution date, and information about the decision-maker. This is a Implementation Strategy For Project Solution Escalations Chart Clipart PDF template with various stages. Focus and dispense information on seven stages using this creative set, that comes with editable features. It contains large content boxes to add your information on topics like Decision Maker, Escalation Date, Expected Resolution. You can also showcase facts, figures, and other relevant content using this PPT layout. Grab it now.
Organization Chart And Corporate Model Transformation Organization Restructuring Icons PDF
This is restructuring process, the sequence of steps or activities that a restructuring team will follow for restructuring organization. These are the basic steps of restructuring process such as initiate restructuring process, review by request board, planning, implementation, review and sustain. This is a organization chart and corporate model transformation organization restructuring icons pdf template with various stages. Focus and dispense information on six stages using this creative set, that comes with editable features. It contains large content boxes to add your information on topics like initiate restructuring process, review by request board, planning, implementation, review. You can also showcase facts, figures, and other relevant content using this PPT layout. Grab it now.
Linear Chart Ppt PowerPoint Presentation Complete Deck With Slides
Boost your confidence and team morale with this well-structured Linear Chart Ppt PowerPoint Presentation Complete Deck With Slides. This prefabricated set gives a voice to your presentation because of its well-researched content and graphics. Our experts have added all the components very carefully, thus helping you deliver great presentations with a single click. Not only that, it contains a set of forteen slides that are designed using the right visuals, graphics, etc. Various topics can be discussed, and effective brainstorming sessions can be conducted using the wide variety of slides added in this complete deck. Apart from this, our PPT design contains clear instructions to help you restructure your presentations and create multiple variations. The color, format, design anything can be modified as deemed fit by the user. Not only this, it is available for immediate download. So, grab it now.

Ppt Team Work Person Presentation Standing Orange Piece Of Chart PowerPoint Templates
PPT team work person presentation standing orange piece of chart PowerPoint Templates-Use this graphical approach to represent global business issues such as financial data, stock market Exchange, increase in sales, corporate presentations and more. Create captivating presentations to deliver comparative and weighted arguments.-PPT team work person presentation standing orange piece of chart PowerPoint Templates-arrow, bar, business, businessman, candidate, cartoon, character, chart, circle, circular, client, communication, company, concept, diagram, finance, financial, flow, growth, human, illustration, increase, information, iteration, man, market, marketing, process, processing, profit, sales, statistics, stats, success, target

Flow Chart 4 Stages World Business PowerPoint Templates Radial Diagram Slides
We present our flow chart 4 stages world business powerpoint templates Radial Diagram Slides.Present our Arrows PowerPoint Templates because they are Designed to attract the attention of your audience. Use our Business PowerPoint Templates because it helps you to project your enthusiasm and single mindedness to your colleagues. Download and present our Flow Charts PowerPoint Templates because this is an excellent slide to detail and highlight your thought process, your views and your positive expectations.. Download our Shapes PowerPoint Templates because it helps to churn the mixture to the right degree and pound home your views and expectations in a spectacularly grand and virtuoso fluid performance. Download and present our Signs PowerPoint Templates because this diagram helps you to develop your marketing strategy and communicate your enthusiasm and motivation to raise the bar.Use these PowerPoint slides for presentations relating to Analysis, Analyze, Background, Blank, Business, Businessman, Center, Central, Chart, Component, Concept, Connect, Core, Decentralize, Deploy, Diagram, Disperse, Disseminate, Distribute, Diverge, Diverse, Diversify, Divide, Education, Element, Empty, Expand, Extend, Flow, Gist, Group, Industry, Link, Man, Management, Manager, Part, People, Person, Plan, Process, Scatter, Separate, Spread, Strategy, Support, Surround, Teacher, Template, Transfer. The prominent colors used in the PowerPoint template are Black, Green, Gray. We assure you our flow chart 4 stages world business powerpoint templates Radial Diagram Slides are Stunning. We assure you our Blank PowerPoint templates and PPT Slides are Versatile. Customers tell us our flow chart 4 stages world business powerpoint templates Radial Diagram Slides are Tasteful. Presenters tell us our Businessman PowerPoint templates and PPT Slides are Romantic. You can be sure our flow chart 4 stages world business powerpoint templates Radial Diagram Slides are aesthetically designed to attract attention. We guarantee that they will grab all the eyeballs you need. The feedback we get is that our Center PowerPoint templates and PPT Slides help you meet deadlines which are an element of today's workplace. Just browse and pick the slides that appeal to your intuitive senses.
Line Chart Showing Four Products Performance Ppt PowerPoint Presentation Icon Slideshow PDF
Pitch your topic with ease and precision using this line chart showing four products performance ppt powerpoint presentation icon slideshow pdf. This layout presents information on line chart showing four products performance. It is also available for immediate download and adjustment. So, changes can be made in the color, design, graphics or any other component to create a unique layout.
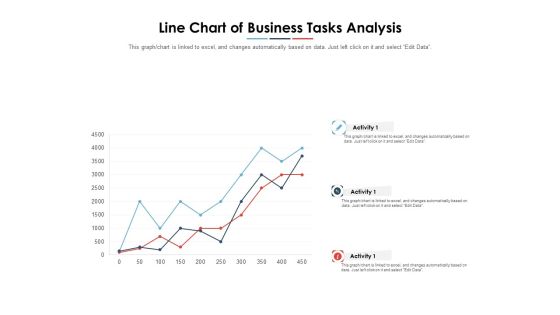
Line Chart Of Business Tasks Analysis Ppt PowerPoint Presentation Layouts Skills PDF
Pitch your topic with ease and precision using this line chart of business tasks analysis ppt powerpoint presentation layouts skills pdf. This layout presents information on line chart of business tasks analysis. It is also available for immediate download and adjustment. So, changes can be made in the color, design, graphics or any other component to create a unique layout.
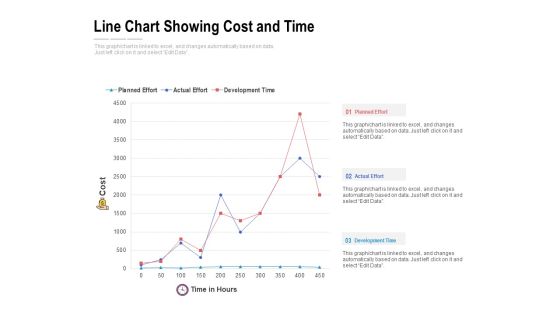
Line Chart Showing Cost And Time Ppt PowerPoint Presentation File Example Topics PDF
Pitch your topic with ease and precision using this line chart showing cost and time ppt powerpoint presentation file example topics pdf. This layout presents information on line chart showing cost and time. It is also available for immediate download and adjustment. So, changes can be made in the color, design, graphics or any other component to create a unique layout.
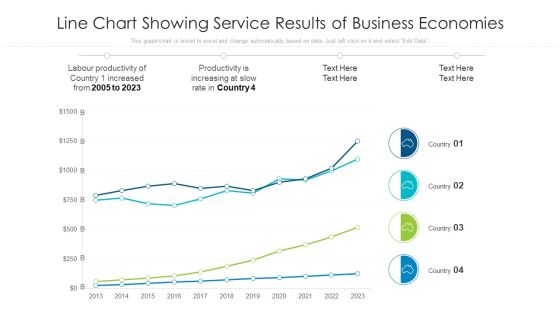
Line Chart Showing Service Results Of Business Economies Ppt PowerPoint Presentation Model Tips PDF
Pitch your topic with ease and precision using this line chart showing service results of business economies ppt powerpoint presentation model tips pdf. This layout presents information on line chart showing service results of business economies. It is also available for immediate download and adjustment. So, changes can be made in the color, design, graphics or any other component to create a unique layout.
Ppt Cyan Circular Arrow Business PowerPoint Slide Text Download Process Chart Templates
PPT cyan circular arrow business powerpoint slide text download process chart Templates-This mechanical and industrial Diagram for PowerPoint features a 3D representation of interconnected Curved Arrows. Includes several predesigned layouts. Use this successive PowerPoint diagram to represent a series of interconnected ideas.-PPT cyan circular arrow business powerpoint slide text download process chart Templates-abstract, algorithm, arrow, arrow chart, block, block diagram, business, chart, connection, design, development, diagram, direction, element, flow, flowchart, graph, linear, management, organization, plan, process, program, section, segment, set, sign, solution, strategy, symbol, vector
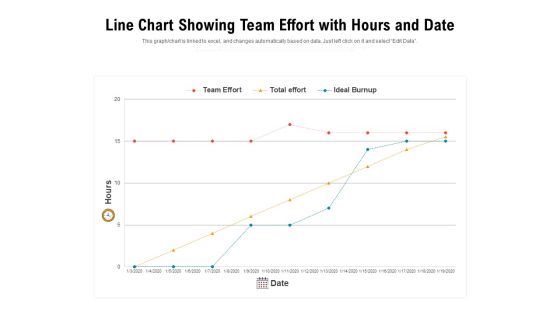
Line Chart Showing Team Effort With Hours And Date Ppt PowerPoint Presentation File Graphic Tips PDF
Pitch your topic with ease and precision using this line chart showing team effort with hours and date ppt powerpoint presentation file graphic tips pdf. This layout presents information on line chart showing team effort with hours and date. It is also available for immediate download and adjustment. So, changes can be made in the color, design, graphics or any other component to create a unique layout.

Ppt Purple Piece Live Connections In Linear Process Work Flow Chart PowerPoint Templates
PPT purple piece live connections in linear process work flow chart powerpoint Templates-Use this PowerPoint Diagram to illustrate how Linear Flow process and its components work. This Purple part which is being highlighted out of all combined Puzzles will let you explain the Beginning component of process and will help you to understand the whole mechanism of the procedure.-Can be used for presentations on abstract, algorithm, arrow, arrow, chart, block, block, diagram, business, chart, color, connection, design, development, diagram, direction, element, flow, flow, Chart, flow,diagram\n,flowchart\n,graph\n,kind,of,diagram\n,linear\n,linear,diagram\n,management\n,model\n,module\n,motion\n,organization\n,plan\n,process\n,process,arrows\n,process,chart\n,process,diagram\n,process,flow\n,program\n,section,segment,set,sign,solution,strategy,symbol-PPT purple piece live connections in linear process work flow chart powerpoint Templates

Organizational Building Blocks Organization Chart Ppt PowerPoint Presentation Portfolio Background Designs PDF
this is a organizational building blocks organization chart ppt powerpoint presentation portfolio background designs pdf template with various stages. focus and dispense information on ten stages using this creative set, that comes with editable features. it contains large content boxes to add your information on topics like organization chart. you can also showcase facts, figures, and other relevant content using this ppt layout. grab it now.
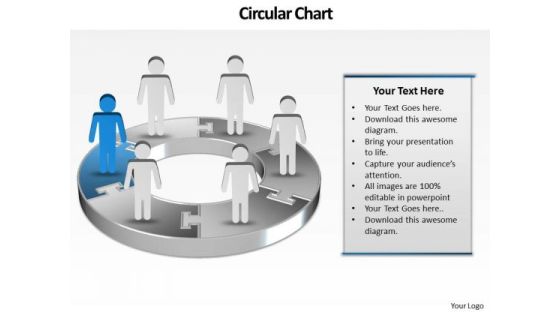
Ppt Display Of 3d Pie Org Chart PowerPoint 2010 With Standing Busines Men Templates
PPT display of 3d pie org chart powerpoint 2010 with standing busines men Templates-This is a professional-look process steps diagram. This Process steps diagram is widely used to show sequence of actions. Use this linear process diagram to emphasize direction of movement and interconnections of stages in a flow. It is useful to explain components involved as well as the factors included in Process. -PPT display of 3d pie org chart powerpoint 2010 with standing busines men Templates-Adult, Art, Background, Business, Career, Chart, Communication, Concept, Conference, Corporate, Creative, Design, Economy, Executive, Finance, Group, Growth, Idea, Illustration, Leadership, Meeting, New, Occupation, Office, People, Person, Progress, Silhouette, Space, Speaking, Standing, Success

8 Colorful Diverging Sections Forming A Circle Circular Flow Process Chart PowerPoint Slides
We present our 8 colorful diverging sections forming a circle Circular Flow Process Chart PowerPoint Slides.Download and present our Leadership PowerPoint Templates because you should Demonstrate how you think out of the box. Download and present our Arrows PowerPoint Templates because you watch them slowly start to savour the flavour you have served them. Download our Process and Flows PowerPoint Templates because you are aware of some pitfalls ahead where you need to be cautious not to overrun and avoid a stall. Present our Business PowerPoint Templates because you have had a great year or so business wise. It is time to celebrate the efforts of your team. Download our Circle Charts PowerPoint Templates because you can Highlight the key components of your entire manufacturing/ business process.Use these PowerPoint slides for presentations relating to Agreeable, Agreeableness, Art, Blue, Business, Chart, Circle, Clip, Clipart, Conscientiousness, Diagram, Extraversion, Factor, Five, Flow, Graph, Graphic, Green, Illustration, Model, Neuroticism, Openness, Personality, Pointed, Process, Psychological, Psychology, Red, Segment, Segmented, Shape. The prominent colors used in the PowerPoint template are Blue, Gray, Black. PowerPoint presentation experts tell us our 8 colorful diverging sections forming a circle Circular Flow Process Chart PowerPoint Slides are Clever. People tell us our Business PowerPoint templates and PPT Slides are Luxurious. People tell us our 8 colorful diverging sections forming a circle Circular Flow Process Chart PowerPoint Slides are Striking. Presenters tell us our Clipart PowerPoint templates and PPT Slides are Great. Customers tell us our 8 colorful diverging sections forming a circle Circular Flow Process Chart PowerPoint Slides are Detailed. The feedback we get is that our Circle PowerPoint templates and PPT Slides are One-of-a-kind.

Nine Stages Diverging Factors Flow Chart Cycle Circular Spoke PowerPoint Templates
We present our nine stages diverging factors flow chart cycle Circular Spoke PowerPoint templates.Download our Arrows PowerPoint Templates because you understand the ailment and how to fight it. Present our Signs PowerPoint Templates because your business and plans for its growth consist of processes that are highly co-related. Download our Process and Flows PowerPoint Templates because you have the ideas to develop the teams vision of where they need to be in the future. Download our Business PowerPoint Templates because this layout helps you to bring some important aspects of your business process to the notice of all concerned. Streamline the flow of information across the board. Use our Flow charts PowerPoint Templates because with the help of our Slides you can Illustrate your plans on using the many social media modes available to inform soceity at large of the benefits of your product.Use these PowerPoint slides for presentations relating to Arrow, background, board, business,chart, circle, circular, circulation, color,colorful, concept, curving, cycle,description, design, diagram, diagram,chart, diagramcircle, diagramelements,diagramvector, direction, element, flow,flowchart, fresh, graphic, illustration,loop, message, motion, phase, present,presentation, process, process,flow,ring, rotation, round, rounddiagram,section, segment, set, shape, sign, step,success, symbol. The prominent colors used in the PowerPoint template are Green, Black, Black. People tell us our nine stages diverging factors flow chart cycle Circular Spoke PowerPoint templates are Exuberant. Customers tell us our circle PowerPoint templates and PPT Slides are Spectacular. Professionals tell us our nine stages diverging factors flow chart cycle Circular Spoke PowerPoint templates are Tranquil. Presenters tell us our business PowerPoint templates and PPT Slides will generate and maintain the level of interest you desire. They will create the impression you want to imprint on your audience. Use our nine stages diverging factors flow chart cycle Circular Spoke PowerPoint templates are Whimsical. Presenters tell us our circulation PowerPoint templates and PPT Slides provide you with a vast range of viable options. Select the appropriate ones and just fill in your text.
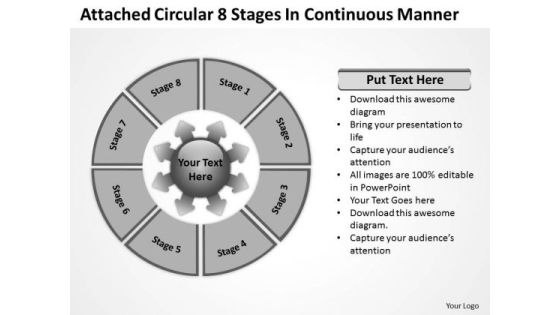
Circular 8 Stages In Continuous Manner Relative Cycle Arrow Chart PowerPoint Templates
We present our circular 8 stages in continuous manner Relative Cycle Arrow Chart PowerPoint templates.Download and present our Process and flows PowerPoint Templates because it helps to anticipate the doubts and questions in the minds of your colleagues and enlighten them with your inspired strategy to garner desired success. Download and present our Business PowerPoint Templates because the fruits of your labour are beginning to show.Enlighten them on the great plans you have for their enjoyment. Download and present our Marketing PowerPoint Templates because you can Highlight the key components of your entire manufacturing/ business process. Download our Flow charts PowerPoint Templates because they are Gauranteed to focus the minds of your team. Use our Arrows PowerPoint Templates because you understand the ailment and how to fight it.Use these PowerPoint slides for presentations relating to Circle, circular, circulation, clipart, colorful, connection, continuity, cut, cycle, cyclic, diagram, direction, empty, flow, graph, green, icon, illustration, isolated, loop, motion, pink, presentation, process, progress, reason, recycle, recycling, repetition, report, result, ring, rotation, round, scheme, section, step, sticker, symbol, arrows , flow charts. The prominent colors used in the PowerPoint template are Yellow, Black, White. People tell us our circular 8 stages in continuous manner Relative Cycle Arrow Chart PowerPoint templates are Spectacular. We assure you our continuity PowerPoint templates and PPT Slides are Tasteful. PowerPoint presentation experts tell us our circular 8 stages in continuous manner Relative Cycle Arrow Chart PowerPoint templates are Vintage. You can be sure our continuity PowerPoint templates and PPT Slides are aesthetically designed to attract attention. We guarantee that they will grab all the eyeballs you need. Professionals tell us our circular 8 stages in continuous manner Relative Cycle Arrow Chart PowerPoint templates are second to none. Use our cut PowerPoint templates and PPT Slides are Awesome.

3d Graphical Navigation Arrows 5 Stages Flow Chart Project PowerPoint Templates
We present our 3d graphical navigation arrows 5 stages flow chart project PowerPoint templates. Use our Business PowerPoint Templates because, Now you have to coordinate and motivate your team. Use our Design PowerPoint Templates because, are the Tools of the Trade. Use our Shapes PowerPoint Templates because; illustrate your plans on using the many social media modes available to inform society at large of the benefits of your product. Use our Metaphor PowerPoint Templates because, you are the star of your enlightened team. Use our Process and Flows PowerPoint Templates because, Sales Template: - Generation of sales is the core of any business. Use these PowerPoint slides for presentations relating to arrows, badge, balloon, bar, blank, blue, bright, bubbles, buttons, circle, color, cross, design, designs, drop, elements, glossy, glowing, graphic, hexagon, icon, illustration, navigation, round, seals, set, shadow, shapes, shiny, sign, speech, squares, stars, stickers, symbol. The prominent colors used in the PowerPoint template are Blue, Gray, and Black

Trend Of Quarterly Funding For Start Up Project Performance Chart Graphics PDF
This slide depicts investment made in different start up projects for 2 years. It also includes the investment amount, funding quarters in graphical form with a trend line and insights. Pitch your topic with ease and precision using this Trend Of Quarterly Funding For Start Up Project Performance Chart Graphics PDF. This layout presents information on Good Management, Efficient Team, Investment Decreased. It is also available for immediate download and adjustment. So, changes can be made in the color, design, graphics or any other component to create a unique layout.
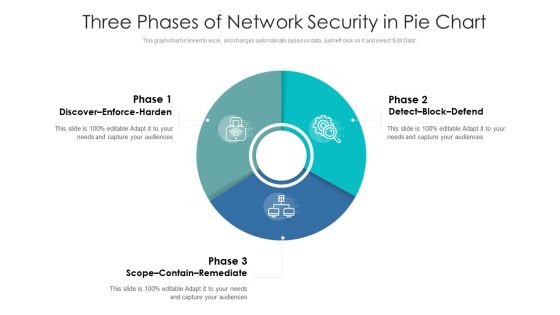
Three Phases Of Network Security In Pie Chart Ppt PowerPoint Presentation Gallery Graphics Download PDF
Pitch your topic with ease and precision using this three phases of network security in pie chart ppt powerpoint presentation gallery graphics download pdf. This layout presents information on discover enforce harden, detect block defend, scope contain remediate. It is also available for immediate download and adjustment. So, changes can be made in the color, design, graphics or any other component to create a unique layout.

3d Puzzle Linear Flow Process 2 Stages Ppt Chart PowerPoint Templates
We present our 3d puzzle linear flow process 2 stages ppt chart PowerPoint templates. Use our Business PowerPoint Templates because; Highlight the key components of your entire manufacturing/ business process. Use our Puzzles or Jigsaws PowerPoint Templates because, you have it all down to a nicety, slice by slice, layer by layer. Use our Shapes PowerPoint Templates because, and watch them strengthen your companys sinews. Use our Abstract PowerPoint Templates because, Help your viewers automatically empathized with your thoughts. Use our Process and Flows PowerPoint Templates because, Puzzles or Jigsaw Template:- It is all there in bits and pieces. Use these PowerPoint slides for presentations relating to abstract, action, attach, box, business, center, chain, chart, color, communication, concept, connection, cube, cycle, data, diagram, flow, globe, horizontal, idea, illustration, information, interaction, jigsaw, join, link, pieces, process, puzzle, relation, relationship, shape, success. The prominent colors used in the PowerPoint template are Blue, Gray, and Black

Round Implementation Of 5 Steps Involved Process Flow Chart Business Plan PowerPoint Slides
We present our round implementation of 5 steps involved process flow chart business plan PowerPoint Slides.Use our Circle Charts PowerPoint Templates because,With the help of our Slides you can Illustrate your plans on using the many social media modes available to inform soceity at large of the benefits of your product. Use our Arrows PowerPoint Templates because, You understand the ailment and how to fight it. Use our Design PowerPoint Templates because,You will be able to Highlight your ideas broad-based on strong fundamentals and illustrate how they step by step acheive the set growth factor. Use our Shapes PowerPoint Templates because,The Venn graphic comprising interlinking circles geometrically demonstate how various functions operating independantly, to a large extent, are essentially interdependant. Use our Process and Flows PowerPoint Templates because, You have a great training programme in mind to upgrade the skills of your staff.Use these PowerPoint slides for presentations relating to 3d, abstract, around, arrows, blue, border, business, center, circle, circular, concept, connections, copy, curve, cycle, directions, distribution, illustration, management, middle, objects, pieces, plan, pointing, process, recycle, rounded, shadows, space, system. The prominent colors used in the PowerPoint template are Yellow, Gray, Black
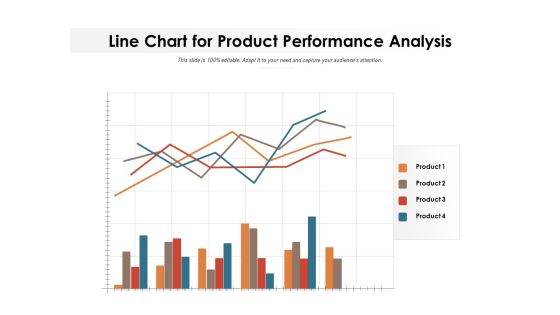
Line Chart For Product Performance Analysis Ppt PowerPoint Presentation Portfolio Portrait PDF
Pitch your topic with ease and precision using this line chart for product performance analysis ppt powerpoint presentation portfolio portrait pdf. This layout presents information on line chart for product performance analysis. It is also available for immediate download and adjustment. So, changes can be made in the color, design, graphics or any other component to create a unique layout.

XY Axis Parabolic Line On Chart Ppt PowerPoint Presentation Model Background Image PDF
Pitch your topic with ease and precision using this xy axis parabolic line on chart ppt powerpoint presentation model background image pdf. This layout presents information on xy axis parabolic line on chart. It is also available for immediate download and adjustment. So, changes can be made in the color, design, graphics or any other component to create a unique layout.

 Home
Home