Banks Comparison
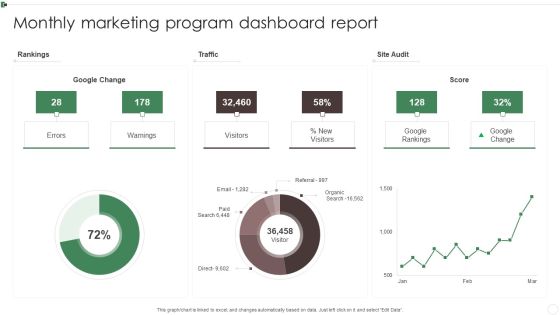
Monthly Marketing Program Dashboard Report Ppt Inspiration Information PDF
This graph or chart is linked to excel, and changes automatically based on data. Just left click on it and select Edit Data. Pitch your topic with ease and precision using this Monthly Marketing Program Dashboard Report Ppt Inspiration Information PDF. This layout presents information on Rankings, Traffic, Site Audit, Warnings. It is also available for immediate download and adjustment. So, changes can be made in the color, design, graphics or any other component to create a unique layout.
Stock Requirement Plan Dashboard With Inventory Management Icons PDF
The following slide highlights the material requirement planning dashboard with inventory management, It illustrates business overview, inventory management, product sale by region, debtor summary and transaction. Pitch your topic with ease and precision using this Stock Requirement Plan Dashboard With Inventory Management Icons PDF. This layout presents information on Transaction, Debtor Summary, Business Overview. It is also available for immediate download and adjustment. So, changes can be made in the color, design, graphics or any other component to create a unique layout.

Impact Of Personnel Workplace Conflict Stats Rules PDF
This slide illustrates the outcome of conflict among employees at workplace. It includes personal insults, absence, departmental arguments, bullying, resignations, terminations, project failure and change in departments.Pitch your topic with ease and precision using this Impact Of Personnel Workplace Conflict Stats Rules PDF. This layout presents information on Personal Attacks, Training Is Advantageous, Conflict Resolution. It is also available for immediate download and adjustment. So, changes can be made in the color, design, graphics or any other component to create a unique layout.

Parameters Of Personnel Turnover Rate In Company Stats Template PDF
This slide depicts key reasons for employee turnover rate. It includes career development, work-life balance, management behaviour, compensation, wellbeing, job characteristics, work environment, relocation and retirement.Pitch your topic with ease and precision using this Parameters Of Personnel Turnover Rate In Company Stats Template PDF. This layout presents information on Career Development, Management Behavior, Compensation. It is also available for immediate download and adjustment. So, changes can be made in the color, design, graphics or any other component to create a unique layout.
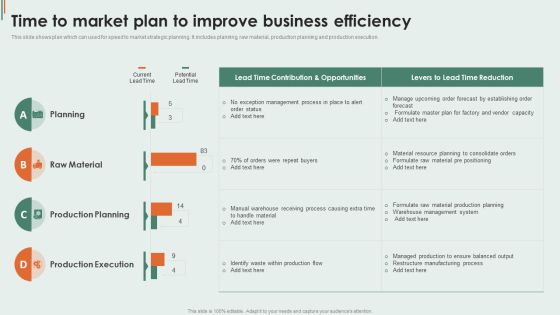
Time To Market Plan To Improve Business Efficiency Clipart PDF
This slide shows plan which can used for speed to market strategic planning. It includes planning, raw material, production planning and production execution. Pitch your topic with ease and precision using this Time To Market Plan To Improve Business Efficiency Clipart PDF. This layout presents information on Contribution Opportunities, Production Execution, Production Planning . It is also available for immediate download and adjustment. So, changes can be made in the color, design, graphics or any other component to create a unique layout.

Packaging And Delivering Dashboard With Monthly Key Performance Metrics Microsoft PDF
The following slide showcases dashboard of supply chain with order status key metrics. Main KPIs covered are volume today, global financial performance and inventory. Pitch your topic with ease and precision using this Packaging And Delivering Dashboard With Monthly Key Performance Metrics Microsoft PDF. This layout presents information on Customer, Global Financial Performance, Inventory Distribution. It is also available for immediate download and adjustment. So, changes can be made in the color, design, graphics or any other component to create a unique layout.
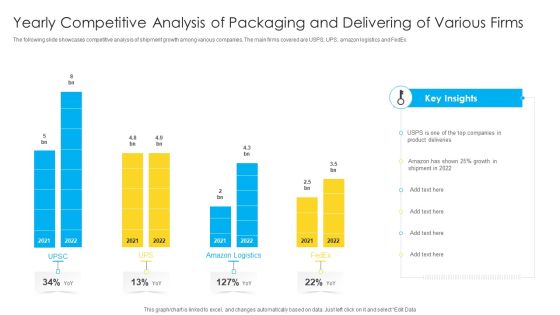
Yearly Competitive Analysis Of Packaging And Delivering Of Various Firms Professional PDF
The following slide showcases competitive analysis of shipment growth among various companies. The main firms covered are USPS, UPS, amazon logistics and FedEx. Pitch your topic with ease and precision using this Yearly Competitive Analysis Of Packaging And Delivering Of Various Firms Professional PDF. This layout presents information on Product Deliveries, Growth. It is also available for immediate download and adjustment. So, changes can be made in the color, design, graphics or any other component to create a unique layout.
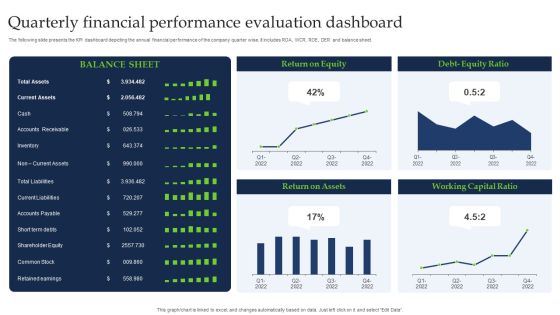
Quarterly Financial Performance Evaluation Dashboard Guidelines PDF
The following slide presents the KPI dashboard depicting the annual financial performance of the company quarter wise. It includes ROA, WCR, ROE, DER and balance sheet. Pitch your topic with ease and precision using this Quarterly Financial Performance Evaluation Dashboard Guidelines PDF. This layout presents information on Current Assets, Shareholder Equity, Common Stock. It is also available for immediate download and adjustment. So, changes can be made in the color, design, graphics or any other component to create a unique layout.
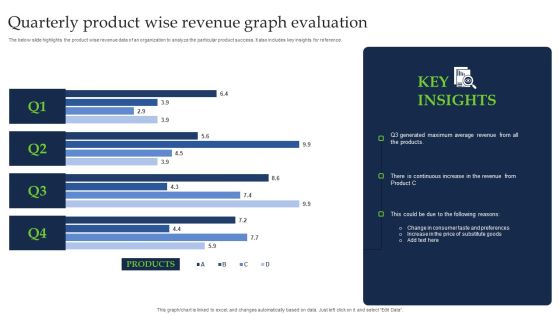
Quarterly Product Wise Revenue Graph Evaluation Brochure PDF
The below slide highlights the product wise revenue data of an organization to analyze the particular product success. It also includes key insights for reference. Pitch your topic with ease and precision using this Quarterly Product Wise Revenue Graph Evaluation Brochure PDF. This layout presents information on Products, Average Revenue. It is also available for immediate download and adjustment. So, changes can be made in the color, design, graphics or any other component to create a unique layout.

SHRM Dashboard Of Employee Satisfaction Ppt PowerPoint Presentation Styles Example File PDF
This slide showcases the advanced statistics of employees satisfaction. It offers information about employee turnover, project employment, and working format that makes management convenient.Pitch your topic with ease and precision using this SHRM Dashboard Of Employee Satisfaction Ppt PowerPoint Presentation Styles Example File PDF. This layout presents information on Total Employees, Happiness Rate, Project Employment. It is also available for immediate download and adjustment. So, changes can be made in the color, design, graphics or any other component to create a unique layout.
Food Segments Contribution Towards Total Production And Global Export Icons PDF
This slide graphically provides information regarding the contribution of multiple food components such as meats, diary, grains and oil seeds, fruits and vegetables etc. towards total food production and global export. Deliver an awe inspiring pitch with this creative Food Segments Contribution Towards Total Production And Global Export Icons PDF bundle. Topics like Global Export, Total Production can be discussed with this completely editable template. It is available for immediate download depending on the needs and requirements of the user.

Commercial Marketing KPI With Average Transaction Value Formats PDF
This slide template covers about key performing indicators like sales revenue, average customer value, average unit per customer with top five articles sold. Pitch your topic with ease and precision using this Commercial Marketing KPI With Average Transaction Value Formats PDF. This layout presents information on Total Customer, Per Transaction, Transaction Value. It is also available for immediate download and adjustment. So, changes can be made in the color, design, graphics or any other component to create a unique layout.

Commercial Marketing KPI With Segment Wise Sales Inspiration PDF
This slide template covers about business trade marketing with segment wise profit generation on monthly basis through advertising campaigns.Pitch your topic with ease and precision using this Commercial Marketing KPI With Segment Wise Sales Inspiration PDF. This layout presents information on Manufacturing Price, Campaign, Discounts Discount. It is also available for immediate download and adjustment. So, changes can be made in the color, design, graphics or any other component to create a unique layout.

Enterprise Marketing Activities KPI Dashboard To Track Performance Across Various Platforms Ideas PDF
This slide covers enterprise marketing dashboard to track performance across various platforms. It involves total insights connected, engagement from Facebook, twitter and Instagram.Pitch your topic with ease and precision using this Enterprise Marketing Activities KPI Dashboard To Track Performance Across Various Platforms Ideas PDF. This layout presents information on Instagram Engagement, Comments, Returning. It is also available for immediate download and adjustment. So, changes can be made in the color, design, graphics or any other component to create a unique layout.
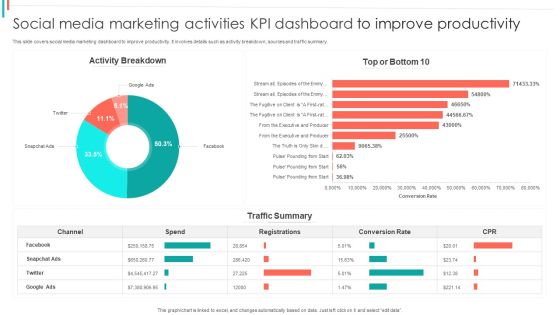
Social Media Marketing Activities KPI Dashboard To Improve Productivity Summary PDF
This slide covers social media marketing dashboard to improve productivity. It involves details such as activity breakdown, sources and traffic summary.Pitch your topic with ease and precision using this Social Media Marketing Activities KPI Dashboard To Improve Productivity Summary PDF. This layout presents information on Activity Breakdown, Conversion Rate, Traffic Summary. It is also available for immediate download and adjustment. So, changes can be made in the color, design, graphics or any other component to create a unique layout.

Technology Sales Enablement Survey Results Pictures PDF
The following slide showcase survey results conducted to find out the usage of sales enablement technology in organizations. The responses covered are maximum benefit to teams and improved efficiency.Pitch your topic with ease and precision using this Technology Sales Enablement Survey Results Pictures PDF. This layout presents information on Teams Benefited, Sales Marketing, Percent Respondents. It is also available for immediate download and adjustment. So, changes can be made in the color, design, graphics or any other component to create a unique layout.

Personal Job Assignment And Productivity Assessment Dashboard Sample PDF
The following slide highlights the employee workload and productivity assessment dashboard illustrating key headings which include employee work, productivity, workload by employee, assessment and summary. Pitch your topic with ease and precision using this Personal Job Assignment And Productivity Assessment Dashboard Sample PDF. This layout presents information on Employee Work, Assessment, Productivity. It is also available for immediate download and adjustment. So, changes can be made in the color, design, graphics or any other component to create a unique layout.

Departmental Goals And Progress Status Dashboard Ppt Portfolio Samples PDF
This slide illustrates statistics and graphical representation of team progress. It includes testing team, sales team, development team, members and progress status graphs etc. Pitch your topic with ease and precision using this Departmental Goals And Progress Status Dashboard Ppt Portfolio Samples PDF. This layout presents information on Testing Team, Sales Team, Development Team. It is also available for immediate download and adjustment. So, changes can be made in the color, design, graphics or any other component to create a unique layout.

Sales Departmental Goals Achievement Graph Ppt Inspiration Slide Download PDF
This slide illustrates graphical representation of achievement percentage of each team member. It includes achievement percent, name, due date and target of respective member. Pitch your topic with ease and precision using this Sales Departmental Goals Achievement Graph Ppt Inspiration Slide Download PDF. This layout presents information on Sales Departmental, Goals, Achievement Graph. It is also available for immediate download and adjustment. So, changes can be made in the color, design, graphics or any other component to create a unique layout.
Education Dashboard For Tracking Gender Based Retention Metrics Template PDF
This slide illustrates student retention analysis dashboard. It include metrics based on gender, campus, ethnicity, and age group. Pitch your topic with ease and precision using this Education Dashboard For Tracking Gender Based Retention Metrics Template PDF. This layout presents information on Gender Based, Retention Rates, Age Group, Campus Wise. It is also available for immediate download and adjustment. So, changes can be made in the color, design, graphics or any other component to create a unique layout.

Education Dashboard With Absenteeism And Grade Details Metrics Diagrams PDF
This slide covers dashboard for tracking causes and rates of student absenteeism. It also include metrics such as average grades by subject and department. Pitch your topic with ease and precision using this Education Dashboard With Absenteeism And Grade Details Metrics Diagrams PDF. This layout presents information on Grade Department, English Proficiency, Medical Abs. It is also available for immediate download and adjustment. So, changes can be made in the color, design, graphics or any other component to create a unique layout.
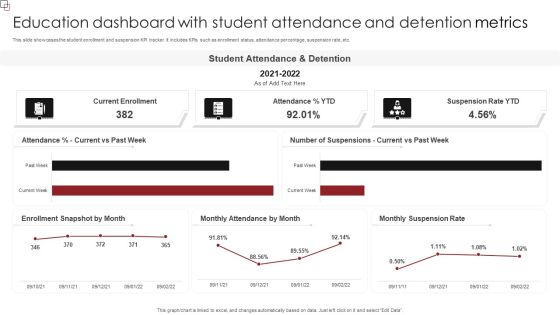
Education Dashboard With Student Attendance And Detention Metrics Inspiration PDF
This slide showcases the student enrollment and suspension KPI tracker. It includes KPIs such as enrollment status, attendance percentage, suspension rate, etc. Pitch your topic with ease and precision using this Education Dashboard With Student Attendance And Detention Metrics Inspiration PDF. This layout presents information on Student Attendance, Suspension Rate YTD, Current Enrollment. It is also available for immediate download and adjustment. So, changes can be made in the color, design, graphics or any other component to create a unique layout.
Training And Education Metrics Tracking Dashboard Guidelines PDF
This slide showcases dashboard for tracking training programs details. It include metrics such as training to invited percentage, unique trained, training man-days, total program names, etc. Pitch your topic with ease and precision using this Training And Education Metrics Tracking Dashboard Guidelines PDF. This layout presents information on Location Wise Training, Training Concerning Vertical, Tennessee. It is also available for immediate download and adjustment. So, changes can be made in the color, design, graphics or any other component to create a unique layout.
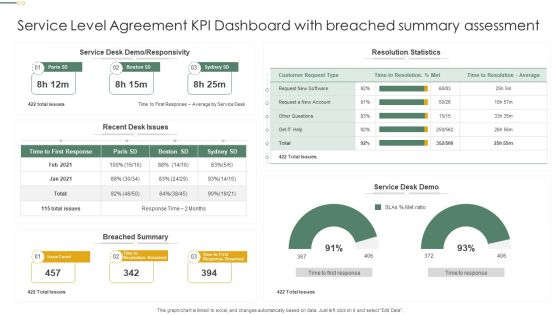
Service Level Agreement KPI Dashboard With Breached Summary Assessment Professional PDF
This graph or chart is linked to excel, and changes automatically based on data. Just left click on it and select Edit Data. Pitch your topic with ease and precision using this Service Level Agreement KPI Dashboard With Breached Summary Assessment Professional PDF. This layout presents information on Resolution Statistics, Service Desk Demo, Breached Summary. It is also available for immediate download and adjustment. So, changes can be made in the color, design, graphics or any other component to create a unique layout.
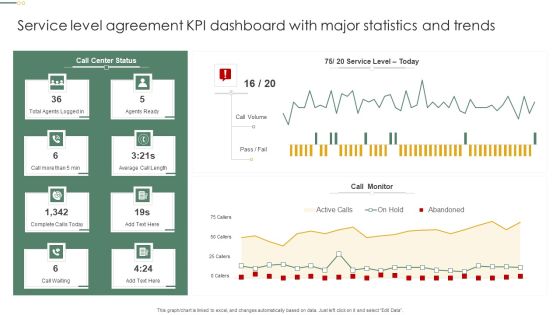
Service Level Agreement KPI Dashboard With Major Statistics And Trends Pictures PDF
This graph or chart is linked to excel, and changes automatically based on data. Just left click on it and select Edit Data. Pitch your topic with ease and precision using this Service Level Agreement KPI Dashboard With Major Statistics And Trends Pictures PDF. This layout presents information on Call Monitor, Call Volume, Agents Ready. It is also available for immediate download and adjustment. So, changes can be made in the color, design, graphics or any other component to create a unique layout.
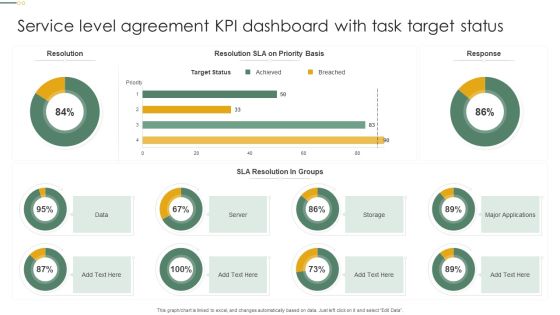
Service Level Agreement KPI Dashboard With Task Target Status Microsoft PDF
This graph or chart is linked to excel, and changes automatically based on data. Just left click on it and select Edit Data. Pitch your topic with ease and precision using this Service Level Agreement KPI Dashboard With Task Target Status Microsoft PDF. This layout presents information on Target Status, Sla Resolution, Groups, Server. It is also available for immediate download and adjustment. So, changes can be made in the color, design, graphics or any other component to create a unique layout.
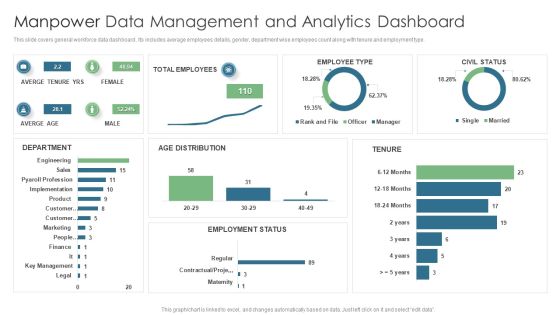
Manpower Data Management And Analytics Dashboard Topics PDF
This slide covers general workforce data dashboard . Its includes average employees details, gender, department wise employees count along with tenure and employment type. Pitch your topic with ease and precision using this Manpower Data Management And Analytics Dashboard Topics PDF. This layout presents information on Total Employees, Averge Tenure Yrs, Employee Type. It is also available for immediate download and adjustment. So, changes can be made in the color, design, graphics or any other component to create a unique layout.
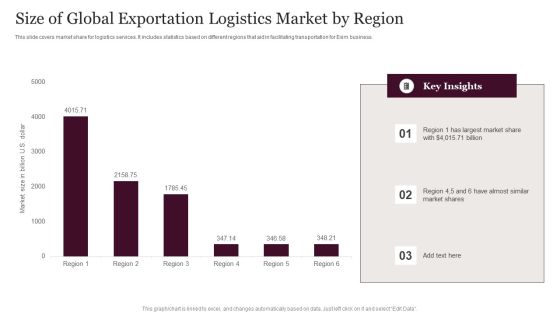
Size Of Global Exportation Logistics Market By Region Information PDF
This slide covers market share for logistics services. It includes statistics based on different regions that aid in facilitating transportation for Exim business. Pitch your topic with ease and precision using this Size Of Global Exportation Logistics Market By Region Information PDF. This layout presents information on Global Exportation Logistics, Market By Region. It is also available for immediate download and adjustment. So, changes can be made in the color, design, graphics or any other component to create a unique layout.

Open Organizational Management Transformation Kpi Dashboard Information PDF
This slide covers the KPI tracking dashboard for optimizing open changes. It includes metrics such as open changes by risk, status, due date, waiting for approval, etc. Pitch your topic with ease and precision using this Open Organizational Management Transformation Kpi Dashboard Information PDF. This layout presents information on Open Organizational Management, Transformation Kpi Dashboard. It is also available for immediate download and adjustment. So, changes can be made in the color, design, graphics or any other component to create a unique layout.
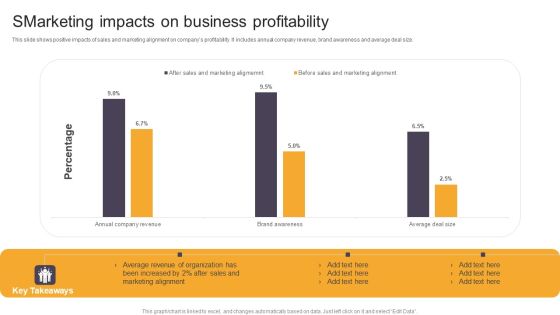
Smarketing Impacts On Business Profitability Ppt Outline Graphics Template PDF
This slide shows positive impacts of sales and marketing alignment on companys profitability. It includes annual company revenue, brand awareness and average deal size. Pitch your topic with ease and precision using this Smarketing Impacts On Business Profitability Ppt Outline Graphics Template PDF. This layout presents information on Sales And Marketing, Average Revenue, Organization. It is also available for immediate download and adjustment. So, changes can be made in the color, design, graphics or any other component to create a unique layout.
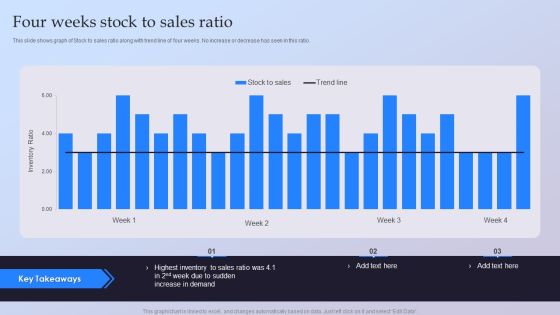
Four Weeks Stock To Sales Ratio Ppt Ideas Guide PDF
This slide shows graph of Stock to sales ratio along with trend line of four weeks. No increase or decrease has seen in this ratio. Pitch your topic with ease and precision using this Four Weeks Stock To Sales Ratio Ppt Ideas Guide PDF. This layout presents information on Highest Inventory, Sales Ratio, Increase Demand. It is also available for immediate download and adjustment. So, changes can be made in the color, design, graphics or any other component to create a unique layout.
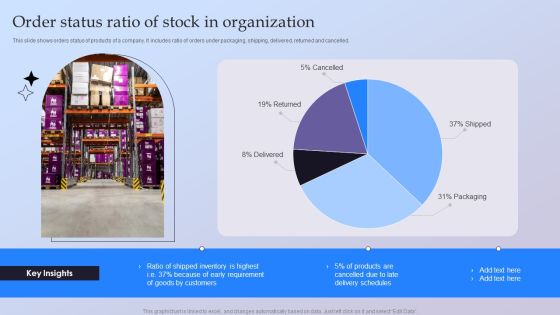
Order Status Ratio Of Stock In Organization Ppt Portfolio Examples PDF
This slide shows orders status of products of a company. It includes ratio of orders under packaging, shipping, delivered, returned and cancelled. Pitch your topic with ease and precision using this Order Status Ratio Of Stock In Organization Ppt Portfolio Examples PDF. This layout presents information on Shipped, Packaging, Delivered, Returned. It is also available for immediate download and adjustment. So, changes can be made in the color, design, graphics or any other component to create a unique layout.

Customer Acquisition Method In Brand Campaign Advertisement Themes PDF
This slide showcase the methods used by companies for product promotion in campaign. It includes influencer marketing, organic search and paid search. Pitch your topic with ease and precision using this Customer Acquisition Method In Brand Campaign Advertisement Themes PDF. This layout presents information on Product Promotion, Marketing, Organic Research. It is also available for immediate download and adjustment. So, changes can be made in the color, design, graphics or any other component to create a unique layout.
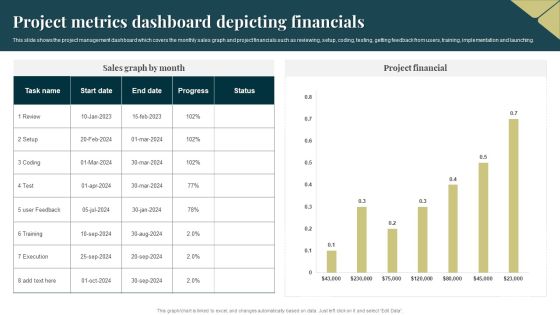
Project Metrics Dashboard Depicting Financials Pictures PDF
This slide shows the project management dashboard which covers the monthly sales graph and project financials such as reviewing, setup, coding, testing, getting feedback from users, training, implementation and launching. Pitch your topic with ease and precision using this Project Metrics Dashboard Depicting Financials Pictures PDF. This layout presents information on Execution, Project Financial. It is also available for immediate download and adjustment. So, changes can be made in the color, design, graphics or any other component to create a unique layout.
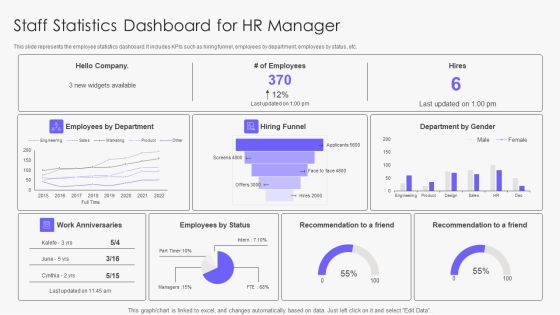
Staff Statistics Dashboard For Hr Manager Rules PDF
This slide represents the employee statistics dashboard. It includes KPIs such as hiring funnel, employees by department, employees by status, etc. Pitch your topic with ease and precision using this Staff Statistics Dashboard For Hr Manager Rules PDF. This layout presents information on Hiring Funnel, Employees By Status, Employees By Department. It is also available for immediate download and adjustment. So, changes can be made in the color, design, graphics or any other component to create a unique layout.

Yearly Staff Engagement Trend Statistics Demonstration PDF
This slide represents the line graph for analyzing employee engagement trend . It includes the statistics such as percentage of engaged and actively disengaged employees. Pitch your topic with ease and precision using this Yearly Staff Engagement Trend Statistics Demonstration PDF. This layout presents information on Team, Employees, Average. It is also available for immediate download and adjustment. So, changes can be made in the color, design, graphics or any other component to create a unique layout.

Team Distrust Barrier To Business Effective Communication Infographics PDF
The following slide showcases team distrust that affect workforce communication. Main problems faced by employee are that they dont receive clear instructions, inability to collaborate etc. Pitch your topic with ease and precision using this Team Distrust Barrier To Business Effective Communication Infographics PDF. This layout presents information on Team Distrust Barrier, Business Effective Communication. It is also available for immediate download and adjustment. So, changes can be made in the color, design, graphics or any other component to create a unique layout.

Campaign Metrics With Traffic Report Information PDF
This template covers about traffic generated with daily number of sessions by user. This further includes behavioral response through analyzing page views. Pitch your topic with ease and precision using this Campaign Metrics With Traffic Report Information PDF. This layout presents information on Origins, Behaviour, Bounce Rate. It is also available for immediate download and adjustment. So, changes can be made in the color, design, graphics or any other component to create a unique layout.

Increment In Social Media Engagement Through Campaign Metrics Professional PDF
This slide covers increment in social media engagement through campaign KPI which include lead break breakdown, online analytics of web traffic and key conversion metrics. Pitch your topic with ease and precision using this Increment In Social Media Engagement Through Campaign Metrics Professional PDF. This layout presents information on Quality, Key Conversion Metrics, Social Media. It is also available for immediate download and adjustment. So, changes can be made in the color, design, graphics or any other component to create a unique layout.
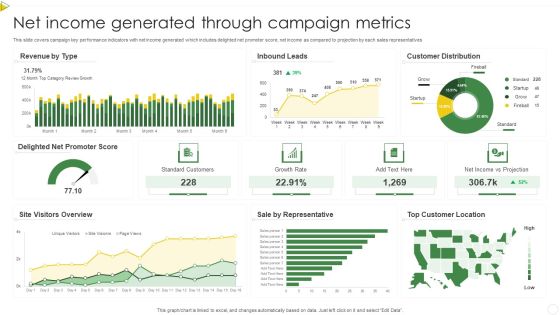
Net Income Generated Through Campaign Metrics Summary PDF
This slide covers campaign key performance indicators with net income generated which includes delighted net promoter score, net income as compared to projection by each sales representatives. Pitch your topic with ease and precision using this Net Income Generated Through Campaign Metrics Summary PDF. This layout presents information on Standard Customers, Growth Rate, Net Income. It is also available for immediate download and adjustment. So, changes can be made in the color, design, graphics or any other component to create a unique layout.

Web Monthly Usage Analysis Summary Dashboard Clipart PDF
This slide depicts website usage analytics report for tracking performance. It involves number of users, sessions, bounce rate and average session duration. Pitch your topic with ease and precision using this Web Monthly Usage Analysis Summary Dashboard Clipart PDF. This layout presents information on Agency Metrics, Source Rate, Goal. It is also available for immediate download and adjustment. So, changes can be made in the color, design, graphics or any other component to create a unique layout.

Consulting Project Status Report With Priority Rules PDF
This slide showcases project status to keep a track of tasks, monitor and mitigate any risk that arises. The following table covers task list, assign, priority, and progress. Pitch your topic with ease and precision using this Consulting Project Status Report With Priority Rules PDF. This layout presents information on Development, Design, Planning. It is also available for immediate download and adjustment. So, changes can be made in the color, design, graphics or any other component to create a unique layout.
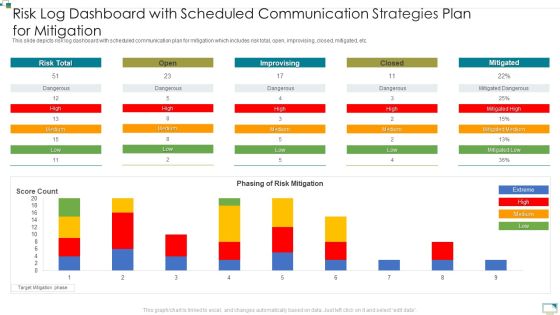
Risk Log Dashboard With Scheduled Communication Strategies Plan For Mitigation Brochure PDF
This slide depicts risk log dashboard with scheduled communication plan for mitigation which includes risk total, open, improvising, closed, mitigated, etc. Pitch your topic with ease and precision using this Risk Log Dashboard With Scheduled Communication Strategies Plan For Mitigation Brochure PDF. This layout presents information on Risk Total, Phasing, Risk Mitigation. It is also available for immediate download and adjustment. So, changes can be made in the color, design, graphics or any other component to create a unique layout.

Dashboard For Tracking Leadership Training And Development Program Progress Topics PDF
This slide illustrates dashboard for tracking leadership development program progress. It also contains information about performing leaders, competency heatmap, executive training, etc. Pitch your topic with ease and precision using this Dashboard For Tracking Leadership Training And Development Program Progress Topics PDF. This layout presents information on People Completed, Number Trainees, Leadership Training. It is also available for immediate download and adjustment. So, changes can be made in the color, design, graphics or any other component to create a unique layout.

Customer Relationship Management Lifecycle Analytics Dashboard With Sales Record Brochure PDF
This slide signifies the customer relationship management analytics dashboard. It covers information about sales record by different representative, total products sold, sales by different month, etc.Pitch your topic with ease and precision using this Customer Relationship Management Lifecycle Analytics Dashboard With Sales Record Brochure PDF. This layout presents information on Sales Record, Representative, Total Items. It is also available for immediate download and adjustment. So, changes can be made in the color, design, graphics or any other component to create a unique layout.
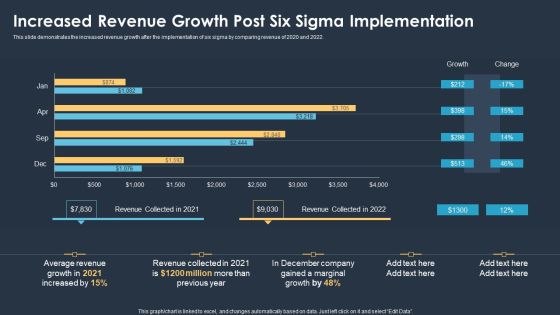
Six Sigma Methodologies For Process Optimization Increased Revenue Growth Post Six Sigma Implementation Template PDF
This slide demonstrates the increased revenue growth after the implementation of six sigma by comparing revenue of 2020 and 2022. Pitch your topic with ease and precision using this Six Sigma Methodologies For Process Optimization Increased Revenue Growth Post Six Sigma Implementation Template PDF. This layout presents information on Average Revenue Growth, Marginal Growth. It is also available for immediate download and adjustment. So, changes can be made in the color, design, graphics or any other component to create a unique layout.

Opportunity Analysis Dashboard Indicating Business Performance Information Rules PDF
This slide shows opportunity analysis dashboard indicating market performance which contains opportunity count by size, sales stage, region, revenue and average revenue. Pitch your topic with ease and precision using this Opportunity Analysis Dashboard Indicating Business Performance Information Rules PDF. This layout presents information on Opportunity Count, Revenue, Sales. It is also available for immediate download and adjustment. So, changes can be made in the color, design, graphics or any other component to create a unique layout.

Electronics Production Annual Market Growth Graphics PDF
This slide contains the information related to the growth of electronic devices manufacturing in the market. Pitch your topic with ease and precision using this Electronics Production Annual Market Growth Graphics PDF. This layout presents information on hnology Advancements, Electronics Market, Demand. It is also available for immediate download and adjustment. So, changes can be made in the color, design, graphics or any other component to create a unique layout.
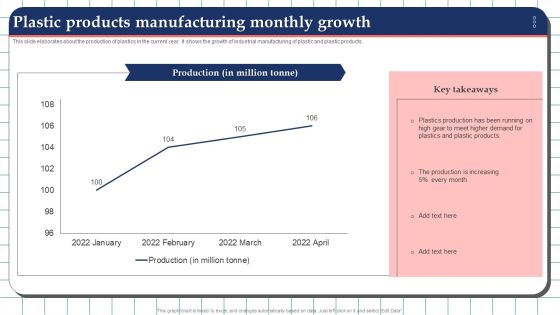
Plastic Products Manufacturing Monthly Growth Guidelines PDF
This slide elaborates about the production of plastics in the current year. It shows the growth of industrial manufacturing of plastic and plastic products. Pitch your topic with ease and precision using this Plastic Products Manufacturing Monthly Growth Guidelines PDF. This layout presents information on Production, Demand, Manufacturing Monthly Growth. It is also available for immediate download and adjustment. So, changes can be made in the color, design, graphics or any other component to create a unique layout.

Production Growth Of Green Building Materials By Product Formats PDF
This slide elaborates the manufacturing growth of green building materials over the last years with the product wise divisions. The product divisions include structural, interior, exterior, etc. Pitch your topic with ease and precision using this Production Growth Of Green Building Materials By Product Formats PDF. This layout presents information on Manufacturing, Materials, Global Crisis. It is also available for immediate download and adjustment. So, changes can be made in the color, design, graphics or any other component to create a unique layout.

Quarterly Beverages Industry Production Growth By Region Designs PDF
This slide contains the information regarding the quarterly manufacturing growth of beverages in the market. Pitch your topic with ease and precision using this Quarterly Beverages Industry Production Growth By Region Designs PDF. This layout presents information on Beverages Manufacturing, Quarterly Beverages Industry, Production Growth. It is also available for immediate download and adjustment. So, changes can be made in the color, design, graphics or any other component to create a unique layout.
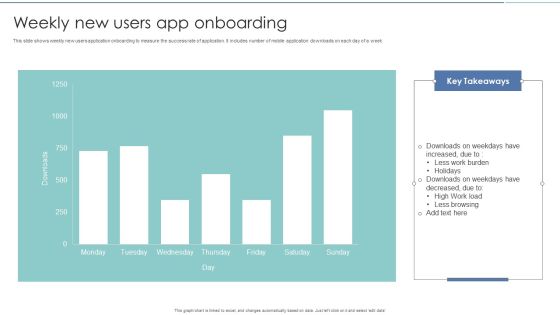
Weekly New Users App Onboarding Diagrams PDF
This slide shows weekly new users application onboarding to measure the success rate of application. It includes number of mobile application downloads on each day of a week. Pitch your topic with ease and precision using this Weekly New Users App Onboarding Diagrams PDF. This layout presents information on Weekly New Users, App Onboarding. It is also available for immediate download and adjustment. So, changes can be made in the color, design, graphics or any other component to create a unique layout.

Market Insights Of Data Center Architecture Management Elements PDF
This slide covers statistical information of data center infrastructure solutions market. It involves details such as CAGR growth, growth rate year over year and growth generated by APAC. Pitch your topic with ease and precision using this Market Insights Of Data Center Architecture Management Elements PDF. This layout presents information on Growth Rate, Market, Investors. It is also available for immediate download and adjustment. So, changes can be made in the color, design, graphics or any other component to create a unique layout.

Chart Illustrating Manufacturing Plant Energy Consumption Statistics Slides PDF
This graph or chart is linked to excel, and changes automatically based on data. Just left click on it and select edit data. Pitch your topic with ease and precision using this Chart Illustrating Manufacturing Plant Energy Consumption Statistics Slides PDF. This layout presents information on Equipment Inefficiency, Process Heating, Energy Export. It is also available for immediate download and adjustment. So, changes can be made in the color, design, graphics or any other component to create a unique layout.
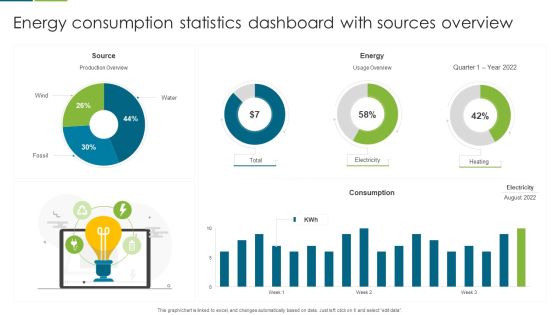
Energy Consumption Statistics Dashboard With Sources Overview Template PDF
This graph or chart is linked to excel, and changes automatically based on data. Just left click on it and select edit data. Pitch your topic with ease and precision using this Energy Consumption Statistics Dashboard With Sources Overview Template PDF. This layout presents information on Source, Energy, Consumption. It is also available for immediate download and adjustment. So, changes can be made in the color, design, graphics or any other component to create a unique layout.

Company Group Members Demographics Dashboard Overview Clipart PDF
This graph or chart is linked to excel, and changes automatically based on data. Just left click on it and select Edit Data. Pitch your topic with ease and precision using this Company Group Members Demographics Dashboard Overview Clipart PDF. This layout presents information on Headcount Office, Headcount Tenure Range, Headcount Age Range. It is also available for immediate download and adjustment. So, changes can be made in the color, design, graphics or any other component to create a unique layout.
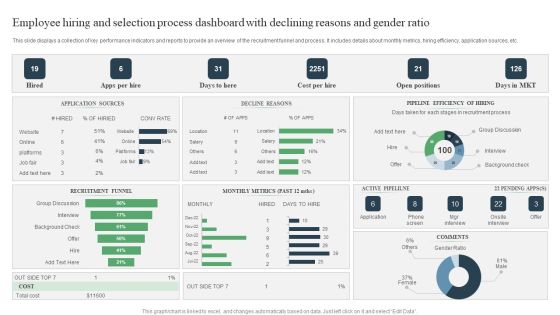
Employee Hiring And Selection Process Dashboard With Declining Reasons And Gender Ratio Ppt PowerPoint Presentation Infographic Template Rules PDF
Pitch your topic with ease and precision using this Employee Hiring And Selection Process Dashboard With Declining Reasons And Gender Ratio Ppt PowerPoint Presentation Infographic Template Rules PDF. This layout presents information on Group Discussion, Active Pipelilne, Onsite Interview. It is also available for immediate download and adjustment. So, changes can be made in the color, design, graphics or any other component to create a unique layout.

Human Turnover Assessment Of Various Departments Ppt PowerPoint Presentation File Layouts PDF
This slide shows the workforce turnover rate in various departments of organization. HR department has seen the lowest employee turnover rate due to.Pitch your topic with ease and precision using this Human Turnover Assessment Of Various Departments Ppt PowerPoint Presentation File Layouts PDF. This layout presents information on Employee Turnover, Department Been, Poor Compensation. It is also available for immediate download and adjustment. So, changes can be made in the color, design, graphics or any other component to create a unique layout.

Service SLA KPL Changes And Incidents Dashboard Ppt Inspiration Infographics PDF
This graph or chart is linked to excel, and changes automatically based on data. Just left click on it and select Edit Data. Pitch your topic with ease and precision using this Service SLA KPL Changes And Incidents Dashboard Ppt Inspiration Infographics PDF. This layout presents information on Time Spent Department, Incidents Closed, Operator Group. It is also available for immediate download and adjustment. So, changes can be made in the color, design, graphics or any other component to create a unique layout.
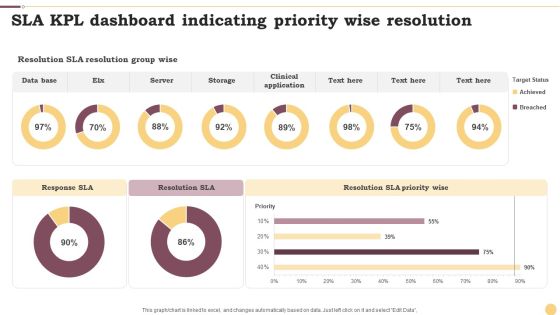
SLA KPL Dashboard Indicating Priority Wise Resolution Ppt Infographics Example File PDF
This graph or chart is linked to excel, and changes automatically based on data. Just left click on it and select Edit Data. Pitch your topic with ease and precision using this SLA KPL Dashboard Indicating Priority Wise Resolution Ppt Infographics Example File PDF. This layout presents information on Data Base, Server, Storage. It is also available for immediate download and adjustment. So, changes can be made in the color, design, graphics or any other component to create a unique layout.
 Home
Home