AI PPT Maker
Templates
PPT Bundles
Design Services
Business PPTs
Business Plan
Management
Strategy
Introduction PPT
Roadmap
Self Introduction
Timelines
Process
Marketing
Agenda
Technology
Medical
Startup Business Plan
Cyber Security
Dashboards
SWOT
Proposals
Education
Pitch Deck
Digital Marketing
KPIs
Project Management
Product Management
Artificial Intelligence
Target Market
Communication
Supply Chain
Google Slides
Research Services
 One Pagers
All Categories
-
Home
- Customer Favorites
- Banking Products
Banking Products

Bar Graph Ppt PowerPoint Presentation Gallery Skills
This is a bar graph ppt powerpoint presentation gallery skills. This is a four stage process. The stages in this process are in percentage, bar graph, business, marketing, product.

Combo Chart Ppt PowerPoint Presentation Gallery Sample
This is a combo chart ppt powerpoint presentation gallery sample. This is a three stage process. The stages in this process are market size, product, growth rate, bar, graph.

Clustered Column Ppt PowerPoint Presentation Icon Design Inspiration
This is a clustered column ppt powerpoint presentation icon design inspiration. This is a two stage process. The stages in this process are product, financial year, sales in percentage, clustered column.
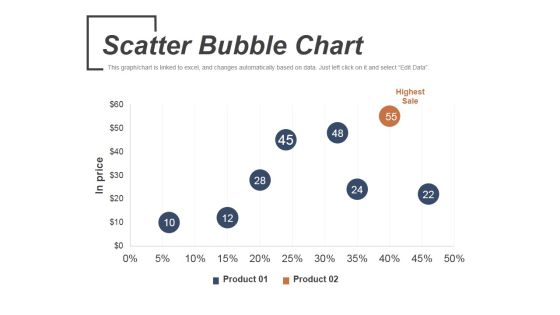
Scatter Bubble Chart Ppt PowerPoint Presentation Infographic Template Graphics
This is a scatter bubble chart ppt powerpoint presentation infographic template graphics. This is a two stage process. The stages in this process are highest sale, product, in price.

Stacked Bar Template 1 Ppt PowerPoint Presentation Infographic Template Format
This is a stacked bar template 1 ppt powerpoint presentation infographic template format. This is a four stage process. The stages in this process are product, stacked bar, business, marketing, bar graph.
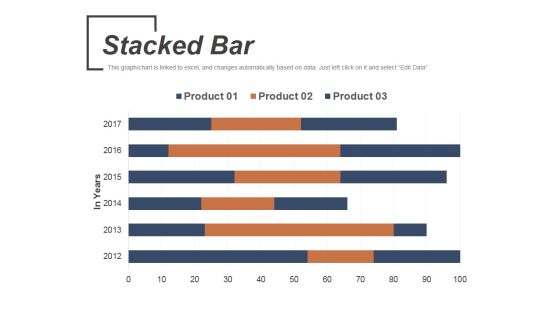
Stacked Bar Template 2 Ppt PowerPoint Presentation Slides Introduction
This is a stacked bar template 2 ppt powerpoint presentation slides introduction. This is a six stage process. The stages in this process are product, stacked bar, business, marketing, in years.

Area Chart Ppt PowerPoint Presentation Infographics Graphics Tutorials
This is a area chart ppt powerpoint presentation infographics graphics tutorials. This is a two stage process. The stages in this process are product, area chart, sales in percentage.

Bar Chart Ppt PowerPoint Presentation Slides Design Ideas
This is a bar chart ppt powerpoint presentation slides design ideas. This is a six stage process. The stages in this process are product, bar chart, sales in percentage.

Clustered Column Line Ppt PowerPoint Presentation File Examples
This is a clustered column line ppt powerpoint presentation file examples. This is a three stage process. The stages in this process are sales in percentage, product, business, marketing, success.

Clustered Bar Ppt PowerPoint Presentation Summary Design Inspiration
This is a clustered bar ppt powerpoint presentation summary design inspiration. This is a two stage process. The stages in this process are product, clustered bar, profit, business, marketing.
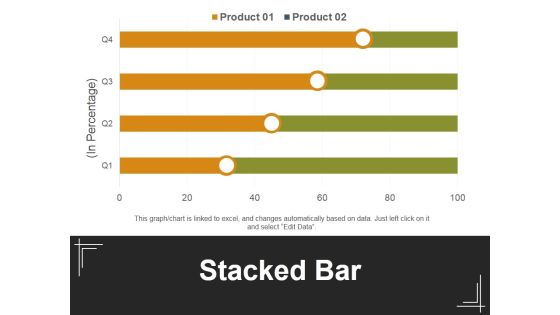
Stacked Bar Template 1 Ppt PowerPoint Presentation Inspiration Background Designs
This is a stacked bar template 1 ppt powerpoint presentation inspiration background designs. This is a four stage process. The stages in this process are in percentage, stacked bar, product, business, marketing.
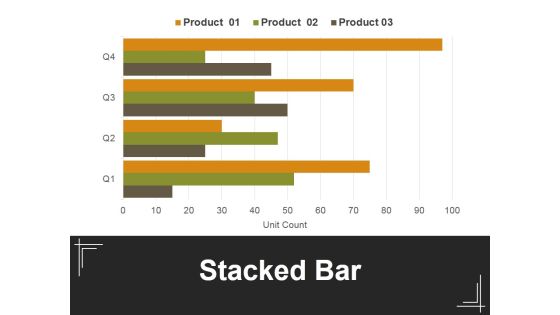
Stacked Bar Template 2 Ppt PowerPoint Presentation Professional Example
This is a stacked bar template 2 ppt powerpoint presentation professional example. This is a four stage process. The stages in this process are in percentage, stacked bar, product, business, marketing.

Stacked Line With Marker Ppt PowerPoint Presentation Ideas Themes
This is a stacked line with marker ppt powerpoint presentation ideas themes. This is a two stage process. The stages in this process are profit, stacked bar, product, business, marketing.

Bar Graph Ppt PowerPoint Presentation Infographic Template Template
This is a bar graph ppt powerpoint presentation infographic template template. This is a three stage process. The stages in this process are bar graph, sales in percentage, product, planning, business.

Clustered Column Line Chart Ppt PowerPoint Presentation File Pictures
This is a clustered column line chart ppt powerpoint presentation file pictures. This is a four stage process. The stages in this process are clustered bar, product, planning, business, sales in percentage.

Bar Chart Ppt PowerPoint Presentation Professional Files
This is a bar chart ppt powerpoint presentation professional files. This is a seven stage process. The stages in this process are bar chart, product, sales in percentage, financial years.
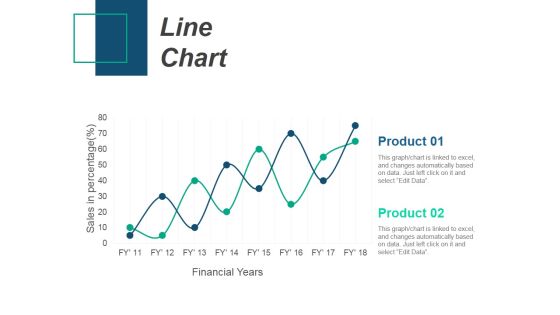
Line Chart Ppt PowerPoint Presentation Infographic Template Introduction
This is a line chart ppt powerpoint presentation infographic template introduction. This is a two stage process. The stages in this process are product, sales in percentage, financial years, line chart.

Clustered Column Line Ppt PowerPoint Presentation Model Images
This is a clustered column line ppt powerpoint presentation model images. This is a four stage process. The stages in this process are sales in percentage, product, business, marketing, bar graph.
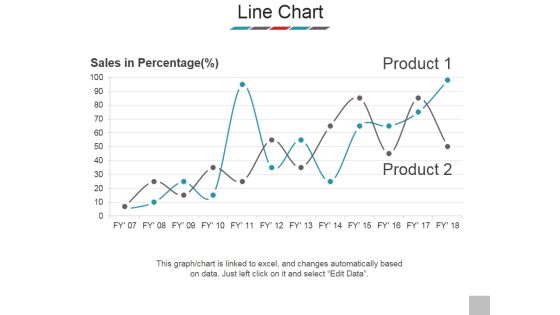
Line Chart Ppt PowerPoint Presentation Outline Samples
This is a line chart ppt powerpoint presentation outline samples. This is a two stage process. The stages in this process are sales in percentage, product, business, marketing, success.

Bar Graph Ppt PowerPoint Presentation Model Clipart
This is a bar graph ppt powerpoint presentation model clipart. This is a six stage process. The stages in this process are sales in percentage, product, bar graph, business, marketing.

Area Chart Ppt PowerPoint Presentation Inspiration Rules
This is a area chart ppt powerpoint presentation inspiration rules. This is a two stage process. The stages in this process are area chart, business, marketing, sales in percentage, product.
Line Chart Ppt PowerPoint Presentation Infographic Template Icons
This is a line chart ppt powerpoint presentation infographic template icons. This is a two stage process. The stages in this process are sales in percentage, financial years, product, line chart.
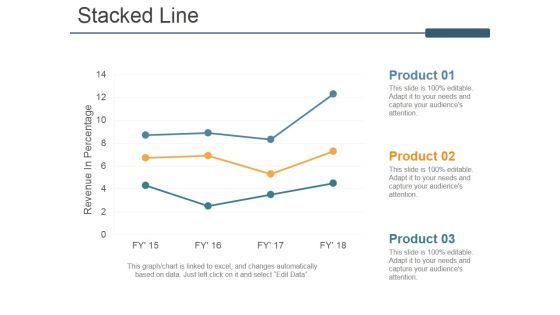
Stacked Line Ppt PowerPoint Presentation Ideas Model
This is a stacked line ppt powerpoint presentation ideas model. This is a three stage process. The stages in this process are revenue in percentage, stacked line, product, business, marketing.
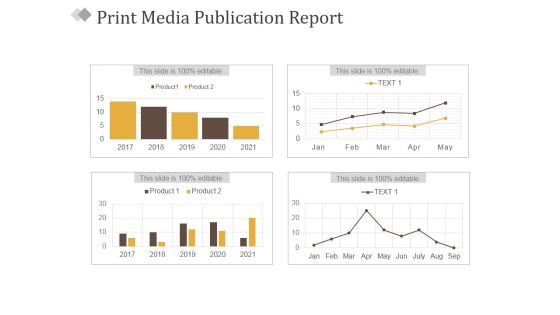
Print Media Publication Report Ppt PowerPoint Presentation Summary Information
This is a print media publication report ppt powerpoint presentation summary information. This is a four stage process. The stages in this process are business, product, marketing, management, success.

Bar Graph Ppt PowerPoint Presentation Outline Layout
This is a bar graph ppt powerpoint presentation outline layout. This is a four stage process. The stages in this process are sales in percentage, product, bar graph, business, marketing.

Clustered Column Line Ppt PowerPoint Presentation Outline Infographic Template
This is a clustered column line ppt powerpoint presentation outline infographic template. This is a three stage process. The stages in this process are product, sales in percentage, business, marketing, success.
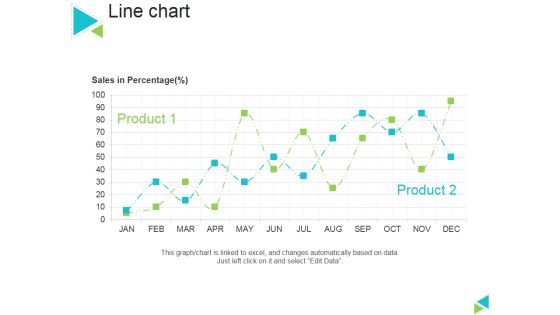
Line Chart Ppt PowerPoint Presentation Gallery Master Slide
This is a line chart ppt powerpoint presentation gallery master slide. This is a two stage process. The stages in this process are sales in percentage, product, line chart.
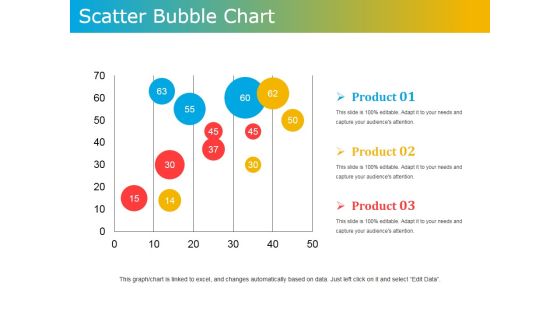
Scatter Bubble Chart Ppt PowerPoint Presentation Ideas Design Templates
This is a scatter bubble chart ppt powerpoint presentation ideas design templates. This is a three stage process. The stages in this process are product, scatter, bubble chart, business, marketing.

Line Chart Ppt PowerPoint Presentation Summary Graphic Tips
This is a line chart ppt powerpoint presentation summary graphic tips. This is a two stage process. The stages in this process are line chart, product, in percentage, analysis, business.
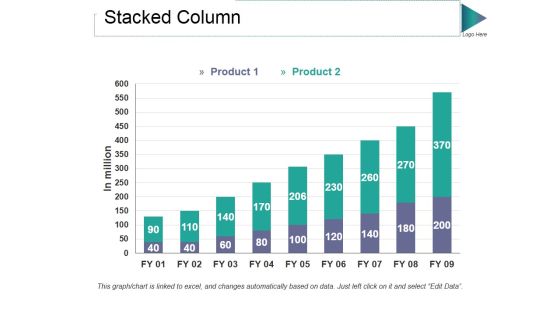
Stacked Column Ppt PowerPoint Presentation Styles Graphic Tips
This is a stacked column ppt powerpoint presentation styles graphic tips. This is a two stage process. The stages in this process are product, in million, bar graph, growth, success.

Clustered Bar Ppt PowerPoint Presentation Gallery Inspiration
This is a clustered bar ppt powerpoint presentation gallery inspiration. This is a four stage process. The stages in this process are clustered bar, product, profit, business, bar graph.

Stacked Line Chart Ppt PowerPoint Presentation Model Show
This is a stacked line chart ppt powerpoint presentation model show. This is a two stage process. The stages in this process are stacked line chart, product, profit, percentage, growth.

Cost Advantage Template 1 Ppt PowerPoint Presentation Model Outfit
This is a cost advantage template 1 ppt powerpoint presentation model outfit. This is a two stage process. The stages in this process are identify the firm s primary and support activities, establish the relative importance of each activity in the total cost of the product, business, marketing, finance.

Investment Pitch To Generate Capital From Series B Venture Round Competitors Analysis Framework Company Specific And Target Customers Summary PDF
The slide provides the competitors analysis related to company specific Founded, Funding, Investors details etc. and target customers Product, Primary Buyers, Customer Service etc. Deliver and pitch your topic in the best possible manner with this investment pitch to generate capital from series b venture round competitors analysis framework company specific and target customers summary pdf. Use them to share invaluable insights on company specific, target customer, competitor and impress your audience. This template can be altered and modified as per your expectations. So, grab it now.

Type Of Purchase Decision Presentation Design
This is a type of purchase decision presentation design. This is a four stage process. The stages in this process are budget available, type of product, target market characteristics, type of purchase decision.

Business Consulting Strategy Diagram Powerpoint Slides Design
This is a business consulting strategy diagram powerpoint slides design. This is a eight stage process. The stages in this process are business, customer, product, teamwork, promotion, develop, budget, analysis.
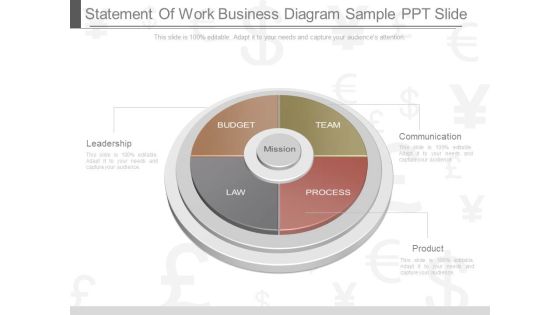
Statement Of Work Business Diagram Sample Ppt Slide
This is a statement of work business diagram sample ppt slide. This is a four stage process. The stages in this process are leadership, communication, product, budget, team, law, process, mission.\n\n\n\n\n\n

Management Departments Statistics Diagram Powerpoint Guide
This is a management departments statistics diagram powerpoint guide. This is a six stage process. The stages in this process are budgeting , production, sales , assets, project management, payroll.
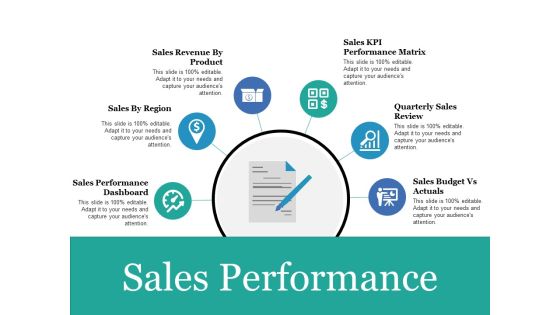
Sales Performance Ppt PowerPoint Presentation Portfolio Show
This is a sales performance ppt powerpoint presentation portfolio show. This is a six stage process. The stages in this process are sales performance dashboard, sales by region, sales revenue by product, quarterly sales review, sales budget vs actuals.
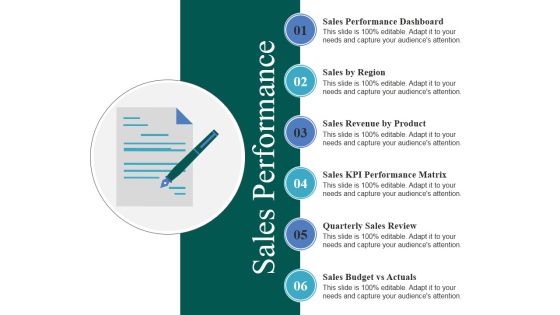
Sales Performance Ppt PowerPoint Presentation Infographics Visuals
This is a sales performance ppt powerpoint presentation infographics visuals. This is a six stage process. The stages in this process are sales by region, sales revenue by product, sales kpi performance matrix, quarterly sales review, sales budget vs actuals.
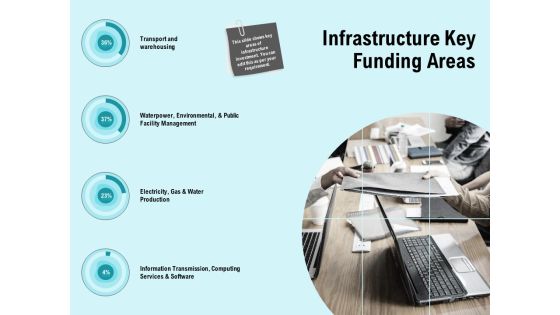
facility operations contol infrastructure key funding areas ppt infographics background designs pdf
Presenting this set of slides with name facility operations contol infrastructure key funding areas ppt infographics background designs pdf. This is a four stage process. The stages in this process are transport and warehousing, waterpower, environmental, public facility management, electricity, gas and water production. This is a completely editable PowerPoint presentation and is available for immediate download. Download now and impress your audience.

Social Enterprise Funding Elevator Pitch Vision Ppt PowerPoint Presentation Infographics Good PDF
Presenting this set of slides with name social enterprise funding elevator pitch vision ppt powerpoint presentation infographics good pdf. This is a three stage process. The stages in this process are service product, core problem, solving, big vision. This is a completely editable PowerPoint presentation and is available for immediate download. Download now and impress your audience.
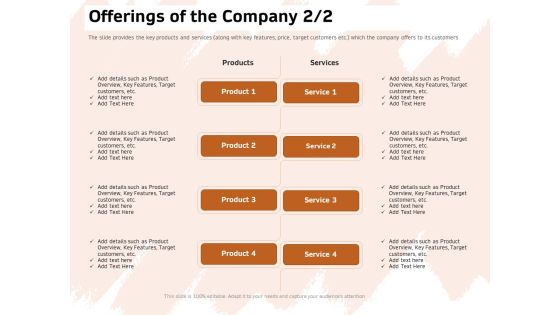
Investor Deck For Capital Generation From Substitute Funding Options Offerings Of The Company Customers Inspiration PDF
Presenting this set of slides with name investor deck for capital generation from substitute funding options offerings of the company customers inspiration pdf. The topics discussed in these slide is product, service. This is a completely editable PowerPoint presentation and is available for immediate download. Download now and impress your audience.

Hedge Funds Trading And Investing Strategies Company Investment Preference Over Time Introduction PDF
This slide highlights the company investment preference which includes the investment distribution on stocks market, mutual funds, venture capital, real estate, bonds, fixed deposits and forex. Deliver and pitch your topic in the best possible manner with this Hedge Funds Trading And Investing Strategies Company Investment Preference Over Time Introduction PDF. Use them to share invaluable insights on Investment, Market, Mutual Funds and impress your audience. This template can be altered and modified as per your expectations. So, grab it now.
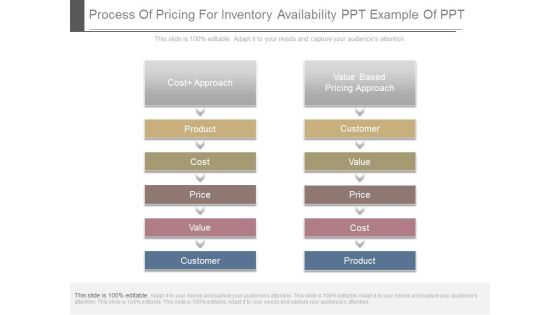
Process Of Pricing For Inventory Availability Ppt Example Of Ppt
This is a process of pricing for inventory availability ppt example of ppt. This is a twelve stage process. The stages in this process are cost approach, product, cost, price, value, customer, value based pricing approach.

Potential Price And Profit Margins Ppt PowerPoint Presentation Design Templates
This is a potential price and profit margins ppt powerpoint presentation design templates. This is a three stage process. The stages in this process are cost item, beginning, revenue, cost of production, gross profit, gross profit margin, other income, wages.
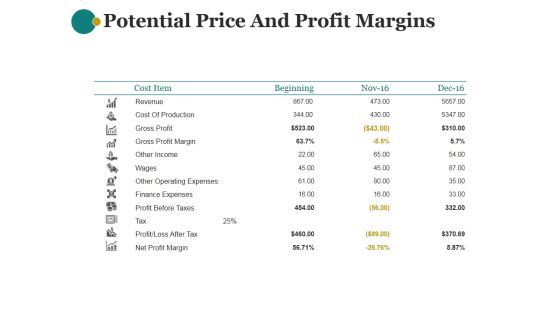
Potential Price And Profit Margins Ppt PowerPoint Presentation Background Images
This is a potential price and profit margins ppt powerpoint presentation background images. This is a three stage process. The stages in this process are cost item, beginning, revenue, cost of production, gross profit, gross profit margin, other income.
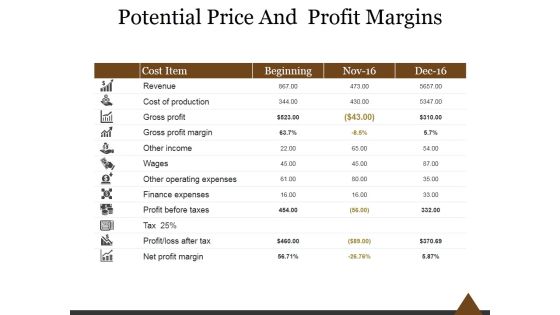
Potential Price And Profit Margins Ppt PowerPoint Presentation Infographics
This is a potential price and profit margins ppt powerpoint presentation infographics. This is a four stage process. The stages in this process are cost item, revenue, cost of production, gross profit, gross profit margin.
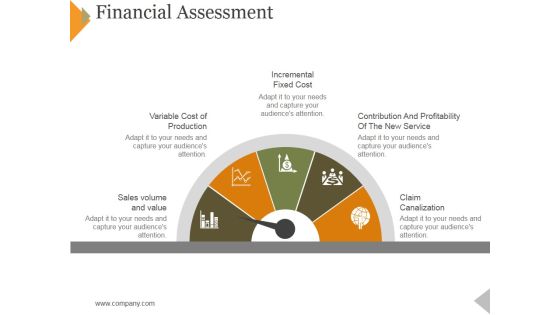
Financial Assessment Ppt PowerPoint Presentation Infographic Template Graphics Pictures
This is a financial assessment ppt powerpoint presentation infographic template graphics pictures. This is a five stage process. The stages in this process are incremental fixed cost, variable cost of production, volume and value, claim canalization.
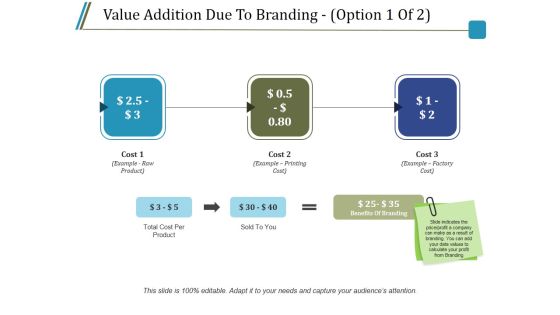
Value Addition Due To Branding Template 1 Ppt PowerPoint Presentation Gallery Gridlines
This is a value addition due to branding template 1 ppt powerpoint presentation gallery gridlines. This is a three stage process. The stages in this process are total cost per product, sold to you, benefits of branding, cost.

Value Addition Due To Branding Template 2 Ppt PowerPoint Presentation Infographics Background Images
This is a value addition due to branding template 2 ppt powerpoint presentation infographics background images. This is a three stage process. The stages in this process are total cost per product, sold to you, benefits of branding, cost.
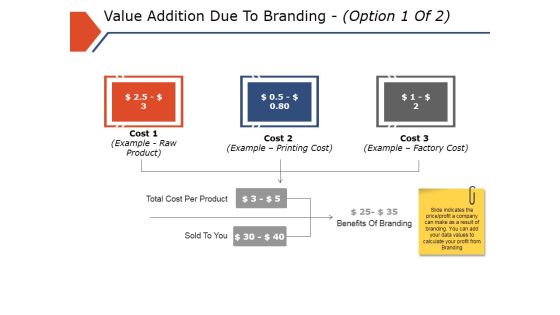
Value Addition Due To Branding Template 1 Ppt PowerPoint Presentation Inspiration Gridlines
This is a value addition due to branding template 1 ppt powerpoint presentation inspiration gridlines. This is a three stage process. The stages in this process are total cost per product, sold to you, benefits of branding, cost.
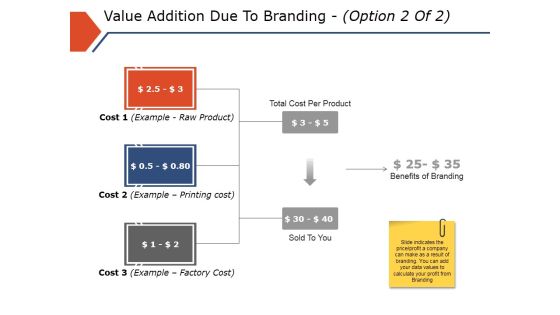
Value Addition Due To Branding Template 2 Ppt PowerPoint Presentation Infographics Model
This is a value addition due to branding template 2 ppt powerpoint presentation infographics model. This is a three stage process. The stages in this process are total cost per product, sold to you, benefits of branding, cost.
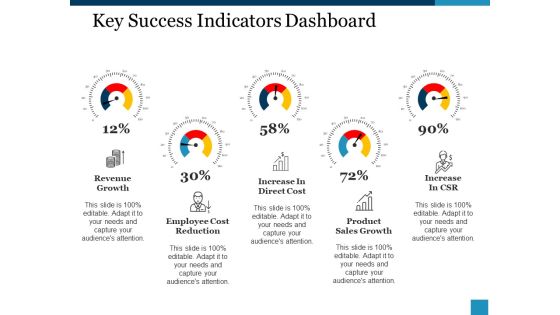
Key Success Indicators Dashboard Ppt PowerPoint Presentation Inspiration Guide
This is a key success indicators dashboard ppt powerpoint presentation inspiration guide. This is a five stage process. The stages in this process are revenue growth, increase in direct cost, increase in csr, employee cost reduction, product, sales growth.

Purpose Of Decentralized Fund Decentralized Fund Investment Playbook Sample PDF
Whether you have daily or monthly meetings, a brilliant presentation is necessary. Purpose Of Decentralized Fund Decentralized Fund Investment Playbook Sample PDF can be your best option for delivering a presentation. Represent everything in detail using Purpose Of Decentralized Fund Decentralized Fund Investment Playbook Sample PDF and make yourself stand out in meetings. The template is versatile and follows a structure that will cater to your requirements. All the templates prepared by Slidegeeks are easy to download and edit. Our research experts have taken care of the corporate themes as well. So, give it a try and see the results.

Ppt 3d Horizontal Illustration To Cut Off Business Losses Eight Steps PowerPoint Templates
PPT 3d horizontal illustration to cut off business losses eight steps PowerPoint Templates-The theme of this PowerPoint template is linear arrows. Use them to illustrate a stepwise process or a phase structure.-PPT 3d horizontal illustration to cut off business losses eight steps PowerPoint Templates-3d, Illustration, arrows, business, declining, dim, drop, finances, graphic, image, loss, production, shedding, statistics, agreement, business, cheap, company, earth, exchange, financial, green, holiday, loss, made, nationality, ocean, outsource, production, quality, stand, stock

Quarterly Business Roadmap Matrix With Key Tasks Introduction PDF
The following slide showcases various activities performed in different department of an organization. The departments included are operations, product, sales, marketing and finance. Pitch your topic with ease and precision using this Quarterly Business Roadmap Matrix With Key Tasks Introduction PDF. This layout presents information on Sale, Product, Marketing. It is also available for immediate download and adjustment. So, changes can be made in the color, design, graphics or any other component to create a unique layout.

Strategic Brand Management Developing Strong Brand Equity For Business Growth Demonstration PDF
This slide provides information regarding building effective brand equity in order to grow business across main and new markets. The purpose is to leverage relationships among perceived benefits and costs that customers relate to that product. Presenting Strategic Brand Management Developing Strong Brand Equity For Business Growth Demonstration PDF to provide visual cues and insights. Share and navigate important information on three stages that need your due attention. This template can be used to pitch topics like Brand Equity, Brand Value, Regular Product, Luxury Product. In addtion, this PPT design contains high resolution images, graphics, etc, that are easily editable and available for immediate download.

Asset Management Planned Maintenance Optimization Objectives Pictures PDF
This slide shows asset management maintenance objectives for avoiding breakdowns. It include objectives such as controlling cost per production, maintaining quality of product, reducing downtime etc.Persuade your audience using this Asset Management Planned Maintenance Optimization Objectives Pictures PDF. This PPT design covers four stages, thus making it a great tool to use. It also caters to a variety of topics including Per Production, Reduce Downtime, Effective Supervision. Download this PPT design now to present a convincing pitch that not only emphasizes the topic but also showcases your presentation skills.
Impact Of Robotic Process Automation Implementation On Business Processes Diagrams PDF
This slide includes the RPA implementation impact that helps organizations achieve higher quality, increase productivity, and accelerate time to market. It includes achieve higher quality, increase productivity, accelerate speed, and save costs. Showcasing this set of slides titled Impact Of Robotic Process Automation Implementation On Business Processes Diagrams PDF. The topics addressed in these templates are Achieve Higher Quality, Increase Productivity, Accelerate Speed. All the content presented in this PPT design is completely editable. Download it and make adjustments in color, background, font etc. as per your unique business setting.
