Banking Operations
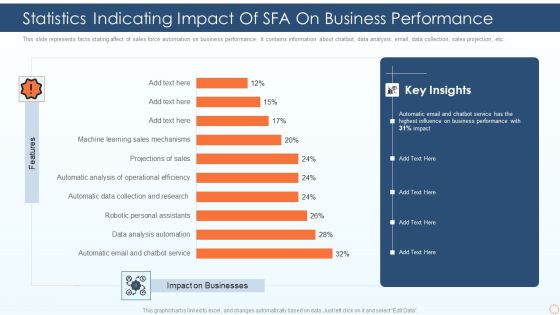
Statistics Indicating Impact Of SFA On Business Performance Ppt PowerPoint Presentation Gallery Outfit PDF
This slide represents facts stating affect of sales force automation on business performance. It contains information about chatbot, data analysis, email, data collection, sales projection, etc. Pitch your topic with ease and precision using this statistics indicating impact of sfa on business performance ppt powerpoint presentation gallery outfit pdf. This layout presents information on automatic email and chatbot service, data analysis automation, robotic personal assistants. It is also available for immediate download and adjustment. So, changes can be made in the color, design, graphics or any other component to create a unique layout.

Russia Ukraine War Influence On International Supply Chain Impact On Supply Chains Of Mineral Microsoft PDF
This slide represents impact of supply chain of mineral due to Russia and Ukraine war. It showcases impact on steel production, coal export etc. Deliver and pitch your topic in the best possible manner with this russia ukraine war influence on international supply chain impact on supply chains of mineral microsoft pdf Use them to share invaluable insights on impact on supply chains of mineral commodities due to russia and ukraine conflict and impress your audience. This template can be altered and modified as per your expectations. So, grab it now.

Russia Ukraine War Influence On International Supply Chain Rise In Prices Due To Escalating Crisis Formats PDF
This slide represents price rise due to Ukraine crisis. It includes increase in commodity, Brent oil and European gas prices disrupting import and export.Deliver an awe inspiring pitch with this creative russia ukraine war influence on international supply chain rise in prices due to escalating crisis formats pdf bundle. Topics like rise in prices due to escalating crisis in ukraine russia can be discussed with this completely editable template. It is available for immediate download depending on the needs and requirements of the user.
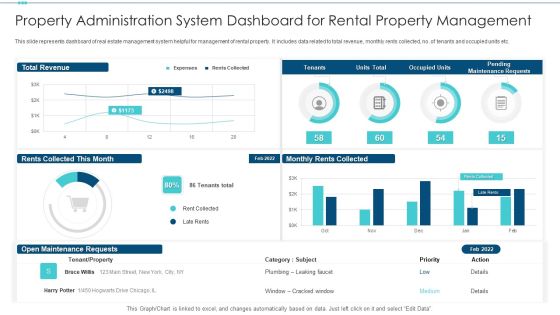
Property Administration System Dashboard For Rental Property Management Inspiration PDF
This slide represents dashboard of real estate management system helpful for management of rental property. It includes data related to total revenue, monthly rents collected, no .of tenants and occupied units etc. Showcasing this set of slides titled property administration system dashboard for rental property management inspiration pdf. The topics addressed in these templates are property administration system dashboard for rental property management. All the content presented in this PPT design is completely editable. Download it and make adjustments in color, background, font etc. as per your unique business setting.

Dashboard Showcasing Financial Metrics To Coffee Shop Business Plan Background PDF
This slide represents financial dashboard to develop coffee business plan. It covers revenue breakdown, revenue, cash flow, and cumulative cash flow for five years. Showcasing this set of slides titled dashboard showcasing financial metrics to coffee shop business plan background pdf. The topics addressed in these templates are dashboard showcasing financial metrics to coffee shop business plan. All the content presented in this PPT design is completely editable. Download it and make adjustments in color, background, font etc. as per your unique business setting.
Salesman Principles Playbook Sales Management Activities Tracking Dashboard Ideas PDF
This slide provides information regarding various metrics catered to track sales team performance in terms of average revenue per account, win rate, NPS, along with sales representative performance tracking through number of opportunities created, lead response time, etc. Deliver and pitch your topic in the best possible manner with this salesman principles playbook sales management activities tracking dashboard ideas pdf Use them to share invaluable insights on sales management activities tracking dashboard and impress your audience. This template can be altered and modified as per your expectations. So, grab it now.
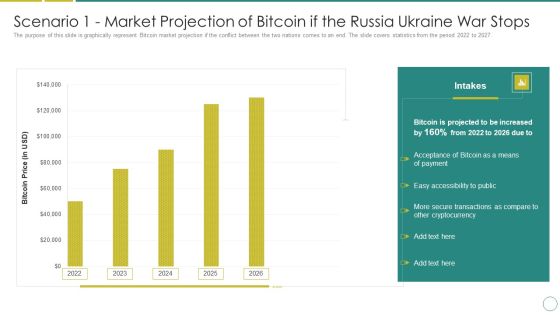
Russia Ukraine Scenario 1 Market Projection Of Bitcoin If The Russia Ukraine War Stops Infographics PDF
The purpose of this slide is graphically represent Bitcoin market projection if the conflict between the two nations comes to an end. The slide covers statistics from the period 2022 to 2027. Deliver and pitch your topic in the best possible manner with this russia ukraine scenario 1 market projection of bitcoin if the russia ukraine war stops infographics pdf. Use them to share invaluable insights on bitcoin price, 2022 to 2024 and impress your audience. This template can be altered and modified as per your expectations. So, grab it now.

30 60 90 Days Plan Of Implementing ERP System Summary PDF
This slide represents the 30 60 90 days plan of implementing an ERP system in the business, and in the first 30 days, team building will be done, and analyzing will be done to understand where ERP could be applied. Deliver an awe inspiring pitch with this creative 30 60 90 days plan of implementing erp system summary pdf bundle. Topics like 30 60 90 days plan of implementing erp system can be discussed with this completely editable template. It is available for immediate download depending on the needs and requirements of the user.
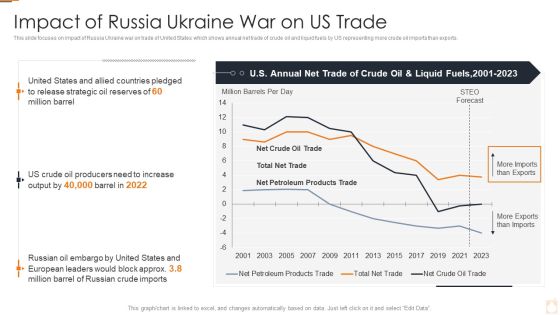
Ukraine Russia Conflict Effect On Petroleum Industry Impact Of Russia Ukraine War On Us Trade Elements PDF
This slide focuses on impact of Russia Ukraine war on trade of United States which shows annual net trade of crude oil and liquid fuels by US representing more crude oil imports than exports.Deliver and pitch your topic in the best possible manner with this Ukraine Russia Conflict Effect On Petroleum Industry Impact Of Russia Ukraine War On Us Trade Elements PDF Use them to share invaluable insights on Impact Of Russia Ukraine War On US Trade and impress your audience. This template can be altered and modified as per your expectations. So, grab it now.

Ukraine Russia Conflict Effect On Petroleum Industry Impact On Oil Prices Of Russia Invading Ukraine Elements PDF
This slide represents the impact on oil prices after Russia invasion of Ukraine which shows rise in oil prices and its impact on countries that are solely dependent on imports from Russia.Deliver and pitch your topic in the best possible manner with this Ukraine Russia Conflict Effect On Petroleum Industry Impact On Oil Prices Of Russia Invading Ukraine Elements PDF Use them to share invaluable insights on Administration Imposed, Domestic Oil Manufacturing, Countries Solely and impress your audience. This template can be altered and modified as per your expectations. So, grab it now.
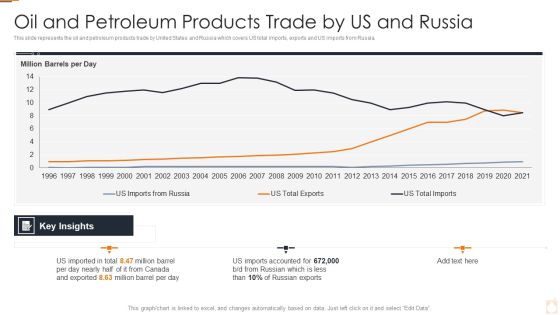
Ukraine Russia Conflict Effect On Petroleum Industry Oil And Petroleum Products Trade Formats PDF
This slide represents the oil and petroleum products trade by United States and Russia which covers US total imports, exports and US imports from Russia.Deliver and pitch your topic in the best possible manner with this Ukraine Russia Conflict Effect On Petroleum Industry Oil And Petroleum Products Trade Formats PDF Use them to share invaluable insights on Oil And Petroleum Products Trade By US And Russia and impress your audience. This template can be altered and modified as per your expectations. So, grab it now.
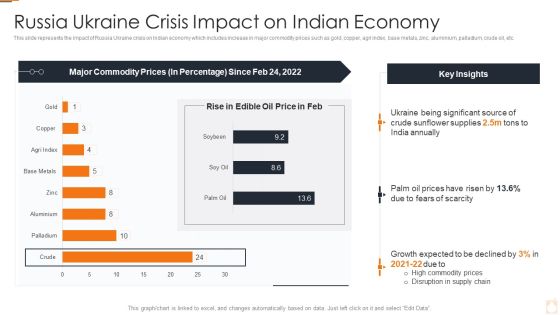
Ukraine Russia Conflict Effect On Petroleum Industry Russia Ukraine Crisis Impact On Indian Summary PDF
This slide represents the impact of Russia Ukraine crisis on Indian economy which includes increase in major commodity prices such as gold, copper, agri index, base metals, zinc, aluminium, palladium, crude oil, etc.Deliver and pitch your topic in the best possible manner with this Ukraine Russia Conflict Effect On Petroleum Industry Russia Ukraine Crisis Impact On Indian Summary PDF Use them to share invaluable insights on Russia Ukraine Crisis Impact On Indian Economy and impress your audience. This template can be altered and modified as per your expectations. So, grab it now.
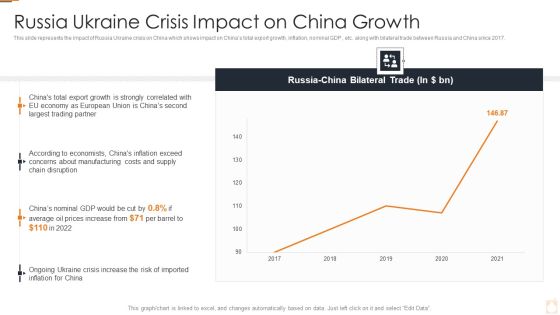
Ukraine Russia Conflict Effect On Petroleum Industry Russia Ukraine Crisis Impact Background PDF
This slide represents the impact of Russia Ukraine crisis on China which shows impact on Chinas total export growth, inflation, nominal GDP , etc. along with bilateral trade between Russia and China since 2017.Deliver an awe inspiring pitch with this creative Ukraine Russia Conflict Effect On Petroleum Industry Russia Ukraine Crisis Impact Background PDF bundle. Topics like Russia Ukraine Crisis Impact On China Growth can be discussed with this completely editable template. It is available for immediate download depending on the needs and requirements of the user.
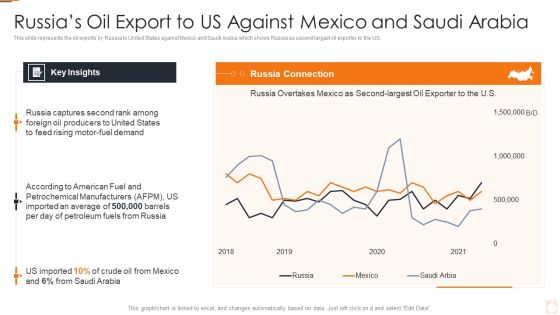
Ukraine Russia Conflict Effect On Petroleum Industry Russias Oil Export Brochure PDF
This slide represents the oil exports by Russia to United States against Mexico and Saudi Arabia which shows Russia as second largest oil exporter to the US.Deliver and pitch your topic in the best possible manner with this Ukraine Russia Conflict Effect On Petroleum Industry Russias Oil Export Brochure PDF Use them to share invaluable insights on Russia Captures, Producers To United, According To American and impress your audience. This template can be altered and modified as per your expectations. So, grab it now.
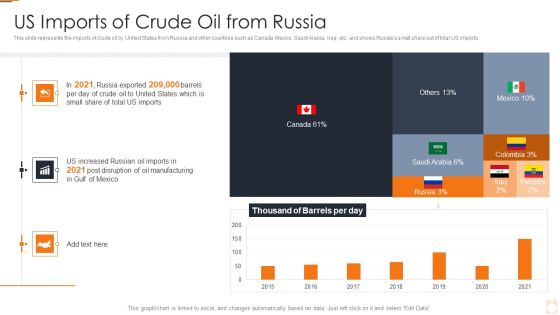
Ukraine Russia Conflict Effect On Petroleum Industry US Imports Of Crude Oil From Russia Designs PDF
This slide represents the imports of crude oil by United States from Russia and other countries such as Canada, Mexico, Saudi Arabia, Iraq, etc. and shows Russias small share out of total US imports.Deliver and pitch your topic in the best possible manner with this Ukraine Russia Conflict Effect On Petroleum Industry US Imports Of Crude Oil From Russia Designs PDF. Use them to share invaluable insights on Us Imports Of Crude Oil From Russia and impress your audience. This template can be altered and modified as per your expectations. So, grab it now.
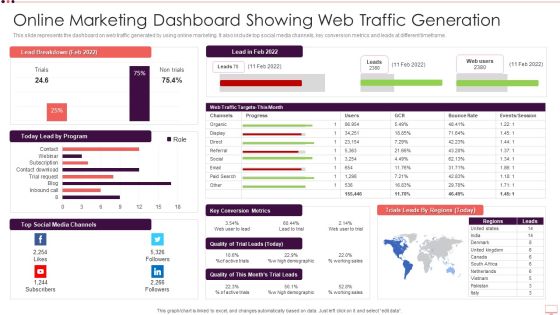
Online Marketing Dashboard Showing Web Traffic Generation Formats PDF
This slide represents the dashboard on web traffic generated by using online marketing. It also include top social media channels, key conversion metrics and leads at different timeframe. Showcasing this set of slides titled Online Marketing Dashboard Showing Web Traffic Generation Formats PDF. The topics addressed in these templates are Online Marketing Dashboard Showing Web Traffic Generation. All the content presented in this PPT design is completely editable. Download it and make adjustments in color, background, font etc. as per your unique business setting.
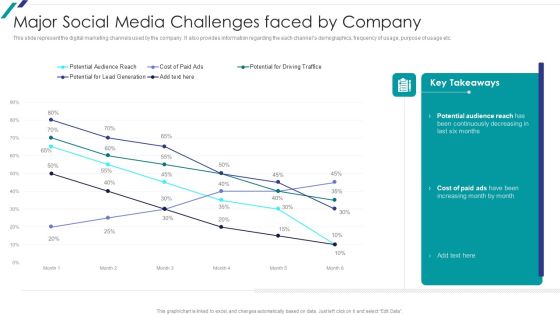
Linkedin Promotional Strategies For Organizational Growth Major Social Media Challenges Faced By Company Themes PDF
This slide represent the digital marketing channels used by the company. It also provides information regarding the each channels demographics, frequency of usage, purpose of usage etc.Deliver and pitch your topic in the best possible manner with this Linkedin Promotional Strategies For Organizational Growth Major Social Media Challenges Faced By Company Themes PDF. Use them to share invaluable insights on Major Social Media Challenges Faced By Company and impress your audience. This template can be altered and modified as per your expectations. So, grab it now.

Tactical Approach To Vendor Relationship How Poor Supplier Relationships Impact Business Clipart PDF
This slide represents the impact of poor supplier relationships on business such as loss of profitability, bad reputation, negative publicity, provides lower quality service and offers smaller price concessions.Deliver and pitch your topic in the best possible manner with this Tactical Approach To Vendor Relationship How Poor Supplier Relationships Impact Business Clipart PDF Use them to share invaluable insights on How Poor Supplier Relationships Impact Business and impress your audience. This template can be altered and modified as per your expectations. So, grab it now.

Graph Indicating Clinical Trial Phases Probability Of Success Infographics PDF
This slide compares and visually presents the success rate of each stage with preceding one of the clinical research procedures to represent the achievement of the drug efficacy objective of the firm.Deliver and pitch your topic in the best possible manner with this Graph Indicating Clinical Trial Phases Probability Of Success Infographics PDF Use them to share invaluable insights on Graph Indicating Clinical Trial Phases Probability Of Success and impress your audience. This template can be altered and modified as per your expectations. So, grab it now.

Organization IT Service Desk Administration Performance Dashboard Infographics PDF
This slide represents the dashboard showing the performance of the service desk management team of the organization. It shows details related to benchmark achieved, customer satisfaction, contracts by type and manufacturer, incidents by category, computer by status, service level management etc. Showcasing this set of slides titled Organization IT Service Desk Administration Performance Dashboard Infographics PDF. The topics addressed in these templates are Service, Management, Manufacturer. All the content presented in this PPT design is completely editable. Download it and make adjustments in color, background, font etc. as per your unique business setting.

Sales Management Playbook Gap Selling Sales Methodology For Deal Closure Inspiration PDF
Sales methodology caters guidelines that assist sales representatives in closing deal with clients. GAP selling sales methodology focus on highlighting gap among prospects business at present and desired level. It cater best way to position firms offerings most effective in filling existing gaps.Deliver and pitch your topic in the best possible manner with this Sales Management Playbook Gap Selling Sales Methodology For Deal Closure Inspiration PDF Use them to share invaluable insights on Problems Identified, Customer Is Frustrated, Facts About Present Product and impress your audience. This template can be altered and modified as per your expectations. So, grab it now.
Sales Management Playbook Sales Management Activities Tracking Dashboard Themes PDF
This slide provides information regarding various metrics catered to track sales team performance in terms of average revenue per account, win rate, NPS, along with sales representative performance tracking through number of opportunities created, lead response time, etc. Deliver an awe inspiring pitch with this creative Sales Management Playbook Sales Management Activities Tracking Dashboard Themes PDF bundle. Topics like Sales Management Activities Tracking Dashboard can be discussed with this completely editable template. It is available for immediate download depending on the needs and requirements of the user.

Defined Sales Assistance For Business Clients Key Statistics Related To B2B Buyer Purchase Pattern Portrait PDF
This slide provides information regarding statistics related to B2B buyer purchase pattern in terms of completion of buying journey, average people involved in buying decision, preference of social media platforms by B2B buyer.Deliver and pitch your topic in the best possible manner with this Defined Sales Assistance For Business Clients Key Statistics Related To B2B Buyer Purchase Pattern Portrait PDF Use them to share invaluable insights on Involvement Of Sales Representative, Reach Out To Vendors, Customized Offers And Experience and impress your audience. This template can be altered and modified as per your expectations. So, grab it now.

Risk Assessment Software Dashboard For Cybersecurity Ppt PowerPoint Presentation Gallery Pictures PDF
This slide represents risk assessment software dashboard for cybersecurity. It includes risk percentage, number of risks, risk analysis progress, risk response progress, risk rating etc. Showcasing this set of slides titled Risk Assessment Software Dashboard For Cybersecurity Ppt PowerPoint Presentation Gallery Pictures PDF. The topics addressed in these templates are Risk Rating Breakdown, Action Plan Breakdown, Top 5 Entities Prone To Risk. All the content presented in this PPT design is completely editable. Download it and make adjustments in color, background, font etc. as per your unique business setting.
Emerging Trends In Integrated Solid Waste Administration Icons PDF
This slide represents the statistical data of the upcoming trends in the management of solid waste of different areas. It shows millions of tonnes collected for the current year and forecast of future years. Pitch your topic with ease and precision using this Emerging Trends In Integrated Solid Waste Administration Icons PDF. This layout presents information on Emerging, Integrated, Administration. It is also available for immediate download and adjustment. So, changes can be made in the color, design, graphics or any other component to create a unique layout.
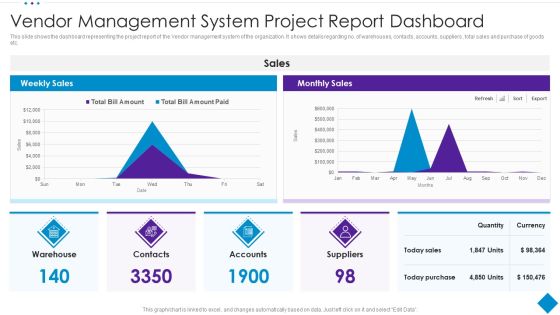
Vendor Management System Project Report Dashboard Template PDF
This slide shows the dashboard representing the project report of the Vendor management system of the organization. It shows details regarding no. of warehouses, contacts, accounts, suppliers , total sales and purchase of goods etc. Showcasing this set of slides titled Vendor Management System Project Report Dashboard Template PDF. The topics addressed in these templates are Purchase, Sales, Suppliers. All the content presented in this PPT design is completely editable. Download it and make adjustments in color, background, font etc. as per your unique business setting.

Construction Services Company Profile Competitive Assessment Based On Market Share Introduction PDF
This slide represents the company comparison with competitors based on market share which shows our leading company with greatest share in market due to rise in construction projects such as commercial offices, pipeline infrastructure, etc.Deliver and pitch your topic in the best possible manner with this Construction Services Company Profile Competitive Assessment Based On Market Share Introduction PDF Use them to share invaluable insights on Distribution Of Construction, Behind Highest, Pipeline Infrastructure and impress your audience. This template can be altered and modified as per your expectations. So, grab it now.

Catering And Restaurant Promotion Marketing Analysis Dashboard Graphics PDF
This slide shows the dashboard representing data of restaurant and catering for analysis of its marketing performance. It includes details related to presentation of food platters, functionality and flow of set up, quality of food, aesthetics of catering supplies etc.Showcasing this set of slides titled Catering And Restaurant Promotion Marketing Analysis Dashboard Graphics PDF The topics addressed in these templates are Consistent Serving, Functionally, Quality Food All the content presented in this PPT design is completely editable. Download it and make adjustments in color, background, font etc. as per your unique business setting.

Restaurant Promotion Online Marketing Report With Website Performance Dashboard Information PDF
This slide shows the dashboard representing the online marketing performance of restaurant and its website. It includes details related to sessions conducted, menu views, table reservations and table reservation value.Showcasing this set of slides titled Restaurant Promotion Online Marketing Report With Website Performance Dashboard Information PDF The topics addressed in these templates are Performance, Table Reservations, Table Reservation All the content presented in this PPT design is completely editable. Download it and make adjustments in color, background, font etc. as per your unique business setting.

Statistical Data Showcasing Key Elements Of Cyber War Rules PDF
This slide represents the statistics related to the key elements of the cyber terrorism. It includes elements such as fear as an outcome, civilian targets, criminality or illegality, digital means or target.Pitch your topic with ease and precision using this Statistical Data Showcasing Key Elements Of Cyber War Rules PDF This layout presents information on Cyber Terrorism, Political Or Ideological, Random Or Indiscriminate It is also available for immediate download and adjustment. So, changes can be made in the color, design, graphics or any other component to create a unique layout.

Revenue And Customer Acquisition Analysis Strategic Administration Dashboard Clipart PDF
This slide shows the dashboard representing analysis of the revenue and customers acquired by the organization. It shows comparison between current and previous year revenue and customer acquisition.Pitch your topic with ease and precision using this Revenue And Customer Acquisition Analysis Strategic Administration Dashboard Clipart PDF This layout presents information on Revenue Customer, Compared Previous, Customer Acquisition It is also available for immediate download and adjustment. So, changes can be made in the color, design, graphics or any other component to create a unique layout.
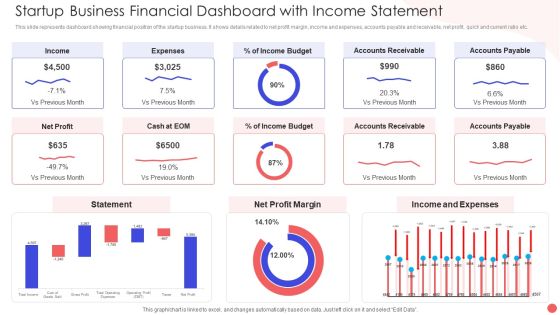
Startup Business Financial Dashboard With Income Statement Portrait PDF
This slide represents dashboard showing financial position of the startup business. It shows details related to net profit margin, income and expenses, accounts payable and receivable, net profit, quick and current ratio etc. Showcasing this set of slides titled Startup Business Financial Dashboard With Income Statement Portrait PDF. The topics addressed in these templates are Accounts Receivable Income, Income And Expenses, Net Profit Margin. All the content presented in this PPT design is completely editable. Download it and make adjustments in color, background, font etc. as per your unique business setting.

Startup Business Financial Dashboard With Key Metrics Sample PDF
This slide represents the financial dashboard for startup company with key performance indicators. It includes details related to current working capital, cash conversion cycle in days and vendor payment error rate. Pitch your topic with ease and precision using this Startup Business Financial Dashboard With Key Metrics Sample PDF. This layout presents information on Cash Conversion Cycle, Current Working Capital, Current Liabilities Debt. It is also available for immediate download and adjustment. So, changes can be made in the color, design, graphics or any other component to create a unique layout.

Customer Relationship Management Software Dashboard For Customer Support System Demonstration PDF
This slide shows the dashboard to be used by the customer support system of the organisation. It represents the number of unresolved issues, average response time and level of customer satisfaction.Pitch your topic with ease and precision using this Customer Relationship Management Software Dashboard For Customer Support System Demonstration PDF This layout presents information on Customer Support, Vendor Management, Loyalty Programs It is also available for immediate download and adjustment. So, changes can be made in the color, design, graphics or any other component to create a unique layout.

Workforce Management Strategies For Effective Hiring Process Kpi Dashboard To Measure Talent Performance Formats PDF
This slide represents dashboard to measure talent performance in organization. It includes talent applicant status, team training methods, talented candidate status, risk for loss of potential talent pool etc. Deliver an awe inspiring pitch with this creative Workforce Management Strategies For Effective Hiring Process Kpi Dashboard To Measure Talent Performance Formats PDF bundle. Topics like Potential Candidate, Talent Performance, Learning Platform can be discussed with this completely editable template. It is available for immediate download depending on the needs and requirements of the user.
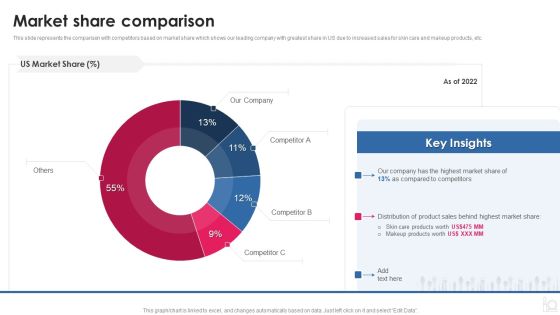
Makeup And Beauty Care Products Company Profile Market Share Comparison Summary PDF
This slide represents the comparison with competitors based on market share which shows our leading company with greatest share in US due to increased sales for skin care and makeup products, etc. Deliver and pitch your topic in the best possible manner with this Makeup And Beauty Care Products Company Profile Market Share Comparison Summary PDF Use them to share invaluable insights on Compared Competitors, Distribution Product, Behind Highest and impress your audience. This template can be altered and modified as per your expectations. So, grab it now.
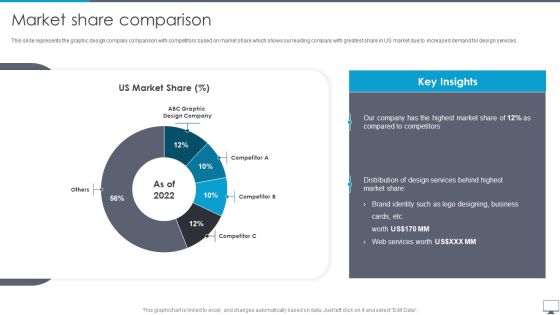
Graphic Designing And Visual Arts Company Profile Market Share Comparison Ideas PDF
This slide represents the graphic design company comparison with competitors based on market share which shows our leading company with greatest share in US market due to increased demand for design services. Deliver and pitch your topic in the best possible manner with this Graphic Designing And Visual Arts Company Profile Market Share Comparison Ideas PDF. Use them to share invaluable insights on Market Share, Design Services, Business and impress your audience. This template can be altered and modified as per your expectations. So, grab it now.

Tour Management Company Profile Competitive Assessment Based On Market Share Demonstration PDF
This slide represents the company comparison with competitors based on market share which shows our leading company with greatest share in US market due to rise in demand for tour packages.Deliver and pitch your topic in the best possible manner with this Tour Management Company Profile Competitive Assessment Based On Market Share Demonstration PDF Use them to share invaluable insights on Highest Market, Compared Competitors, Distribution Tours and impress your audience. This template can be altered and modified as per your expectations. So, grab it now.
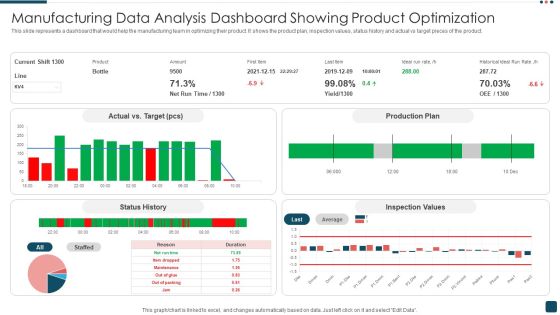
Manufacturing Data Analysis Dashboard Showing Product Optimization Structure PDF
This slide represents a dashboard that would help the manufacturing team in optimizing their product. It shows the product plan, inspection values, status history and actual vs target pieces of the product. Pitch your topic with ease and precision using this Manufacturing Data Analysis Dashboard Showing Product Optimization Structure PDF. This layout presents information on Target, Production Plan, Inspection Values. It is also available for immediate download and adjustment. So, changes can be made in the color, design, graphics or any other component to create a unique layout.

Event Management Services Company Profile Financial Highlights Revenue Gross Profit And Net Profit Template PDF
This slide focuses on financial highlights of event management company which represents revenue, gross profit and net profit for last five years from 2018 to 2022.Deliver and pitch your topic in the best possible manner with this Event Management Services Company Profile Financial Highlights Revenue Gross Profit And Net Profit Template PDF Use them to share invaluable insights on Gross Profit, Key Insights, profit increased and impress your audience. This template can be altered and modified as per your expectations. So, grab it now.
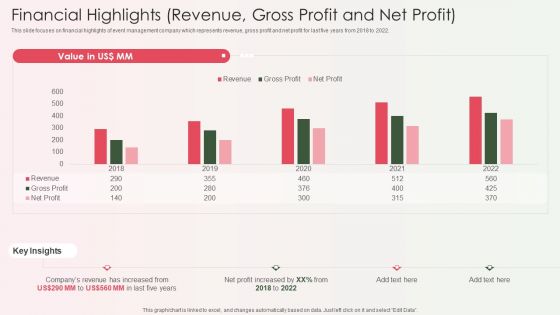
Event Organizer And Coordinator Company Profile Financial Highlights Revenue Gross Profit And Net Profit Formats PDF
This slide focuses on financial highlights of event management company which represents revenue, gross profit and net profit for last five years from 2018 to 2022.Deliver and pitch your topic in the best possible manner with this Event Organizer And Coordinator Company Profile Financial Highlights Revenue Gross Profit And Net Profit Formats PDF Use them to share invaluable insights on Revenue Increased, Profit Increased, Key Insights and impress your audience. This template can be altered and modified as per your expectations. So, grab it now.

Tour Agency Business Profile Competitive Assessment Based On Market Share Download PDF
This slide represents the company comparison with competitors based on market share which shows our leading company with greatest share in US market due to rise in demand for tour packages.Deliver and pitch your topic in the best possible manner with this Tour Agency Business Profile Competitive Assessment Based On Market Share Download PDF Use them to share invaluable insights on Travel Agency, Compared To Competitors, Distribution Of Tours and impress your audience. This template can be altered and modified as per your expectations. So, grab it now.
Tour Agency Business Profile Revenue Split By Geography And Tours Icons PDF
This slide shows the revenue split by geography which represents highest revenue from South Africa region and type of tours such as educational, adventure, culture, MICE tours, etc.Deliver and pitch your topic in the best possible manner with this Tour Agency Business Profile Revenue Split By Geography And Tours Icons PDF Use them to share invaluable insights on Revenue Generated, Revenue By Geography, Conferences And Exhibitions and impress your audience. This template can be altered and modified as per your expectations. So, grab it now.

Enterprise Quarterly Income And Expenditure Performance Chart Graphics PDF
This slide depicts total income and expenses incurred annually. It represents the value of the income to expenses for each pair of bars, by quarter and variance is the profit earned. Pitch your topic with ease and precision using this Enterprise Quarterly Income And Expenditure Performance Chart Graphics PDF. This layout presents information on Expenses Surpassed Income, Sales, Huge Profit. It is also available for immediate download and adjustment. So, changes can be made in the color, design, graphics or any other component to create a unique layout.

KPI Dashboard Of Real Estate Customer Relationship Management Pictures PDF
This slide represents the dashboard generated through CRM software used in a real estate company. It shows details related to key performance metrics such as leads by source, closed and pending transactions, projected monthly sales volume etc. Showcasing this set of slides titled KPI Dashboard Of Real Estate Customer Relationship Management Pictures PDF. The topics addressed in these templates are Projected Monthly Sales Volume, Leads By Source, Annual Commissions. All the content presented in this PPT design is completely editable. Download it and make adjustments in color, background, font etc. as per your unique business setting.
Pipeline Tracking And Management By Real Estate Customer Relationship Management Brochure PDF
This slide represents the report prepared with the help of CRM software for real estate company to track and manage companys sales pipeline. It includes details related to region wise conversion, lead source analysis, accounts analytics etc. Pitch your topic with ease and precision using this Pipeline Tracking And Management By Real Estate Customer Relationship Management Brochure PDF. This layout presents information on Conversion Rate, Lead Source Analysis, Wise Conversion. It is also available for immediate download and adjustment. So, changes can be made in the color, design, graphics or any other component to create a unique layout.

Real Estate Construction Firm Details Competitive Assessment Based On Market Share Sample PDF
This slide represents the company comparison with competitors based on market share which shows our leading company with greatest share in market due to rise in construction projects such as commercial offices, pipeline infrastructure, etc.Deliver an awe inspiring pitch with this creative Real Estate Construction Firm Details Competitive Assessment Based On Market Share Sample PDF bundle. Topics like Compared To Competitors, Distribution Of Construction, Highest Market can be discussed with this completely editable template. It is available for immediate download depending on the needs and requirements of the user.
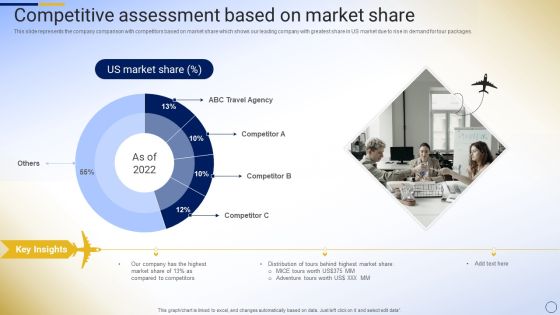
Online Tour And Travel Company Profile Competitive Assessment Based On Market Share Demonstration PDF
This slide represents the company comparison with competitors based on market share which shows our leading company with greatest share in US market due to rise in demand for tour packages.Deliver and pitch your topic in the best possible manner with this Online Tour And Travel Company Profile Competitive Assessment Based On Market Share Demonstration PDF. Use them to share invaluable insights on Compared To Competitors, Distribution Of Tours, Highest Market and impress your audience. This template can be altered and modified as per your expectations. So, grab it now.
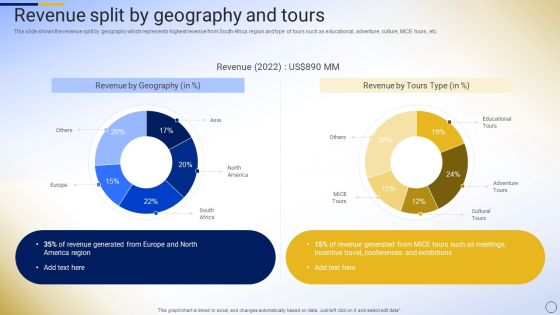
Online Tour And Travel Company Profile Revenue Split By Geography And Tours Infographics PDF
This slide shows the revenue split by geography which represents highest revenue from South Africa region and type of tours such as educational, adventure, culture, MICE tours, etc.Deliver and pitch your topic in the best possible manner with this Online Tour And Travel Company Profile Revenue Split By Geography And Tours Infographics PDF. Use them to share invaluable insights on Revenue Generated, America Region, Revenue Generated and impress your audience. This template can be altered and modified as per your expectations. So, grab it now.

Cosmetics And Skin Care Company Profile Market Share Comparison Slides PDF
This slide represents the comparison with competitors based on market share which shows our leading company with greatest share in US due to increased sales for skin care and makeup products, etc. Deliver an awe inspiring pitch with this creative Cosmetics And Skin Care Company Profile Market Share Comparison Slides PDF bundle. Topics like US Market Share, Competitor, Product Sales, Makeup Products can be discussed with this completely editable template. It is available for immediate download depending on the needs and requirements of the user.
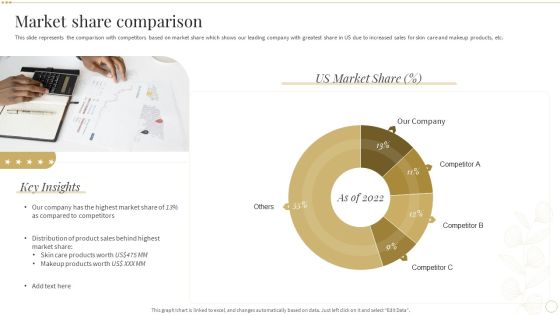
Market Share Comparison Skin Care And Beautifying Products Company Profile Summary PDF
This slide represents the comparison with competitors based on market share which shows our leading company with greatest share in US due to increased sales for skin care and makeup products, etc. Deliver an awe inspiring pitch with this creative Market Share Comparison Skin Care And Beautifying Products Company Profile Summary PDF bundle. Topics like Compared To Competitors, Distribution Of Product, Behind Highest can be discussed with this completely editable template. It is available for immediate download depending on the needs and requirements of the user.
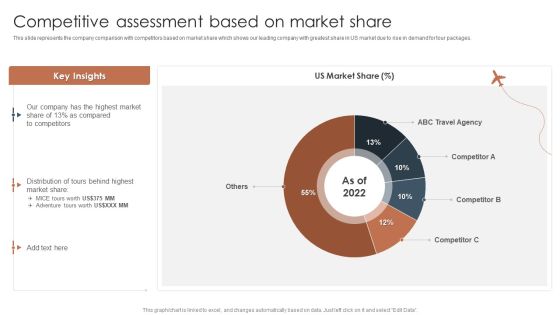
Tour And Travels Agency Profile Competitive Assessment Based On Market Share Elements PDF
This slide represents the company comparison with competitors based on market share which shows our leading company with greatest share in US market due to rise in demand for tour packages.Deliver and pitch your topic in the best possible manner with this Tour And Travels Agency Profile Competitive Assessment Based On Market Share Elements PDF. Use them to share invaluable insights on Compared Competitors, Distribution Tours, Travel Agency and impress your audience. This template can be altered and modified as per your expectations. So, grab it now.

Tour And Travels Agency Profile Revenue Split By Geography And Tours Diagrams PDF
This slide shows the revenue split by geography which represents highest revenue from South Africa region and type of tours such as educational, adventure, culture, MICE tours, etc.Deliver and pitch your topic in the best possible manner with this Tour And Travels Agency Profile Revenue Split By Geography And Tours Diagrams PDF. Use them to share invaluable insights on Revenue Generated, America Region, Such As Meetings and impress your audience. This template can be altered and modified as per your expectations. So, grab it now.

Big Data Architect Impact Of Big Data Management On Business Processes Designs PDF
This slide represents the impacts of the big data deployment on the organization, and it shows the effect on decision making, decrease in expenses, customer service, and speed to market.Deliver and pitch your topic in the best possible manner with this Big Data Architect Impact Of Big Data Management On Business Processes Designs PDF. Use them to share invaluable insights on Advanced Analytics, Better Decision, Decrease Expenses and impress your audience. This template can be altered and modified as per your expectations. So, grab it now.

Data Analytics Management Impacts Of Big Data Management On Business Processes Sample PDF
This slide represents the impacts of the big data deployment on the organization, and it shows the effect on decision making, decrease in expenses, customer service, and speed to market.Deliver and pitch your topic in the best possible manner with this Data Analytics Management Impacts Of Big Data Management On Business Processes Sample PDF. Use them to share invaluable insights on Advanced Analytics, Decrease Expenses, Customer Service and impress your audience. This template can be altered and modified as per your expectations. So, grab it now.
Metaverse Technology IT Dashboard For Tracking Metaverse Environment Ppt Outline Elements PDF
This slide represents the dashboard for tracking the metaverse environment. It covers the details of daily revenue, the total number of users, the number of new users, and total sales. Deliver and pitch your topic in the best possible manner with this Metaverse Technology IT Dashboard For Tracking Metaverse Environment Ppt Outline Elements PDF. Use them to share invaluable insights on Digital Spot, Satisfaction Rate, All Metaverses, Transaction Details and impress your audience. This template can be altered and modified as per your expectations. So, grab it now.
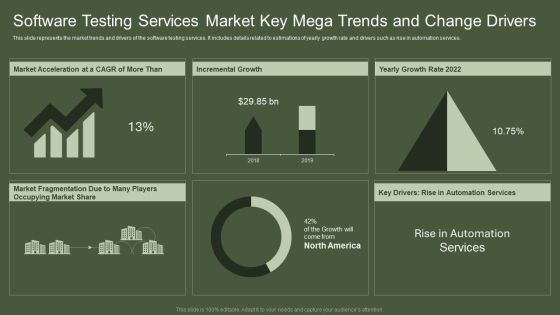
Software Testing Services Market Key Mega Trends And Change Drivers Elements PDF
This slide represents the market trends and drivers of the software testing services. It includes details related to estimations of yearly growth rate and drivers such as rise in automation services. Showcasing this set of slides titled Software Testing Services Market Key Mega Trends And Change Drivers Elements PDF. The topics addressed in these templates are Incremental Growth, Yearly Growth Rate, Automation Services. All the content presented in this PPT design is completely editable. Download it and make adjustments in color, background, font etc. as per your unique business setting.
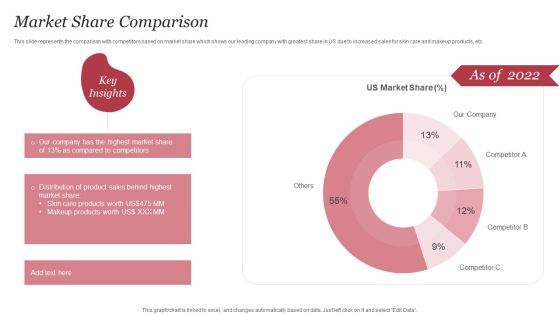
Personal Care Company Profile Market Share Comparison Ppt PowerPoint Presentation Gallery Deck PDF
This slide represents the comparison with competitors based on market share which shows our leading company with greatest share in US due to increased sales for skin care and makeup products, etc. Deliver an awe inspiring pitch with this creative Personal Care Company Profile Market Share Comparison Ppt PowerPoint Presentation Gallery Deck PDF bundle. Topics like US Market Share, Product Sales, Skin Care Products can be discussed with this completely editable template. It is available for immediate download depending on the needs and requirements of the user.
Interior Design Company Outline Market Share Comparison Ppt PowerPoint Presentation Icon Styles PDF
This slide represents the interior design company comparison with competitors based on market share which shows our leading company with greatest share in US market due to increased demand for design services. Deliver an awe inspiring pitch with this creative Interior Design Company Outline Market Share Comparison Ppt PowerPoint Presentation Icon Styles PDF bundle. Topics like US Market Share, Highest Market Share, Residential Projects Worth can be discussed with this completely editable template. It is available for immediate download depending on the needs and requirements of the user.

Home Interior Design And Decoration Company Profile Market Share Comparison Summary PDF
This slide represents the interior design company comparison with competitors based on market share which shows our leading company with greatest share in US market due to increased demand for design services. Deliver an awe inspiring pitch with this creative Home Interior Design And Decoration Company Profile Market Share Comparison Summary PDF bundle. Topics like Compared To Competitors, Projects Behind, Highest Market Share can be discussed with this completely editable template. It is available for immediate download depending on the needs and requirements of the user.

Film Making Firm Profile Revenue And Net Profits Ppt PowerPoint Presentation Gallery Template PDF
This slide represents the financial highlights of our film production house which includes revenue and net profits for last five years from 2018 to 2022 that shows highest revenue in 2022. Deliver an awe inspiring pitch with this creative Film Making Firm Profile Revenue And Net Profits Ppt PowerPoint Presentation Gallery Template PDF bundle. Topics like 2018 To 2022, Net Profit Increased, Revenue can be discussed with this completely editable template. It is available for immediate download depending on the needs and requirements of the user.

Film Making Firm Profile Box Office Collection In Last Five Years Ppt PowerPoint Presentation File Graphics PDF
This slide represents the box office collection of our film production house in last five years from 2018 to 2022 which shows maximum collection in 2021. Deliver an awe inspiring pitch with this creative Film Making Firm Profile Box Office Collection In Last Five Years Ppt PowerPoint Presentation File Graphics PDF bundle. Topics like Office Collection, Box Office Collection, 2018 To 2022 can be discussed with this completely editable template. It is available for immediate download depending on the needs and requirements of the user.

Film Making Firm Profile Competitive Assessment Based On Market Share Ppt PowerPoint Presentation Gallery Files PDF
This slide represents the film production house comparison with competitors based on market share which shows our leading company with greatest share in US market. Deliver and pitch your topic in the best possible manner with this Film Making Firm Profile Competitive Assessment Based On Market Share Ppt PowerPoint Presentation Gallery Files PDF. Use them to share invaluable insights on Key Insights, US Market Share, Market Share and impress your audience. This template can be altered and modified as per your expectations. So, grab it now.

Retail Outlet Experience Optimization Playbook Statistics Associated With Consumer While Shopping At Retail Store Guidelines PDF
This slide provides information regarding statistics associated with consumer while shopping at retail store. These statistics include consumer preference of online vs. offline store, interaction with sales representatives, etc. Deliver an awe inspiring pitch with this creative Retail Outlet Experience Optimization Playbook Statistics Associated With Consumer While Shopping At Retail Store Guidelines PDF bundle. Topics like Purchase Product, Service Payment, Consumers Access can be discussed with this completely editable template. It is available for immediate download depending on the needs and requirements of the user.
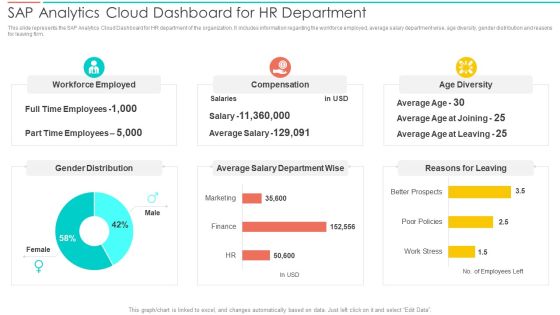
SAC Planning And Implementation SAP Analytics Cloud Dashboard For Hr Department Inspiration PDF
This slide represents the SAP Analytics Cloud Dashboard for HR department of the organization. It includes information regarding the workforce employed, average salary department wise, age diversity, gender distribution and reasons for leaving firm. Deliver and pitch your topic in the best possible manner with this SAC Planning And Implementation SAP Analytics Cloud Dashboard For Hr Department Inspiration PDF. Use them to share invaluable insights on Workforce Employed, Compensation, Age Diversity and impress your audience. This template can be altered and modified as per your expectations. So, grab it now.
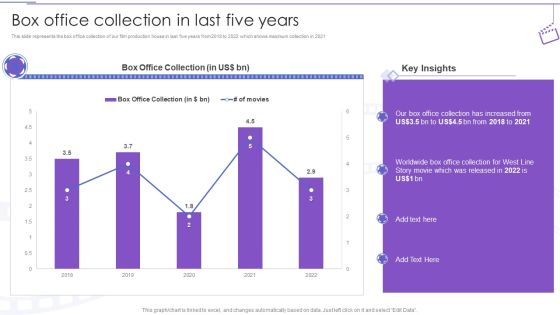
Film Making Company Outline Box Office Collection In Last Five Years Ppt PowerPoint Presentation Slides Clipart PDF
This slide represents the box office collection of our film production house in last five years from 2018 to 2022 which shows maximum collection in 2021.Deliver and pitch your topic in the best possible manner with this Film Making Company Outline Box Office Collection In Last Five Years Ppt PowerPoint Presentation Slides Clipart PDF. Use them to share invaluable insights on Office Collection, Worldwide Box, Released and impress your audience. This template can be altered and modified as per your expectations. So, grab it now.

Film Making Company Outline Revenue And Net Profits Ppt PowerPoint Presentation Ideas Slide Portrait PDF
This slide represents the financial highlights of our film production house which includes revenue and net profits for last five years from 2018 to 2022 that shows highest revenue in 2022.Deliver an awe inspiring pitch with this creative Film Making Company Outline Revenue And Net Profits Ppt PowerPoint Presentation Ideas Slide Portrait PDF bundle. Topics like Revenue Increased, Five Years, Profit Increased can be discussed with this completely editable template. It is available for immediate download depending on the needs and requirements of the user.
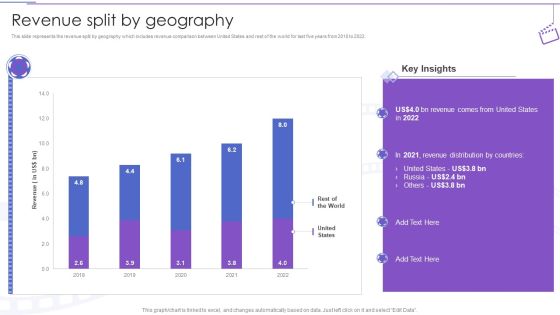
Film Making Company Outline Revenue Split By Geography Ppt PowerPoint Presentation Professional Graphic Images PDF
This slide represents the revenue split by geography which includes revenue comparison between United States and rest of the world for last five years from 2018 to 2022.Deliver and pitch your topic in the best possible manner with this Film Making Company Outline Revenue Split By Geography Ppt PowerPoint Presentation Professional Graphic Images PDF. Use them to share invaluable insights on United States, Revenue Distribution, Revenue Comes and impress your audience. This template can be altered and modified as per your expectations. So, grab it now.

Box Office Collection In Last Five Years Film Media Company Profile Ppt PowerPoint Presentation Icon Show PDF
This slide represents the box office collection of our film production house in last five years from 2018 to 2022 which shows maximum collection in 2021.Deliver and pitch your topic in the best possible manner with this Box Office Collection In Last Five Years Film Media Company Profile Ppt PowerPoint Presentation Icon Show PDF. Use them to share invaluable insights on Collection Increased, Released, Office Collection and impress your audience. This template can be altered and modified as per your expectations. So, grab it now.

Competitive Assessment Based On Market Share Film Media Company Profile Ppt PowerPoint Presentation File Design Inspiration PDF
This slide represents the film production house comparison with competitors based on market share which shows our leading company with greatest share in US market.Deliver and pitch your topic in the best possible manner with this Competitive Assessment Based On Market Share Film Media Company Profile Ppt PowerPoint Presentation File Design Inspiration PDF. Use them to share invaluable insights on Compared Competitors, Calculated Based, Office Revenue and impress your audience. This template can be altered and modified as per your expectations. So, grab it now.

Revenue Split By Geography Film Media Company Profile Ppt PowerPoint Presentation Infographics Infographics PDF
This slide represents the financial highlights of our film production house which includes revenue and net profits for last five years from 2018 to 2022 that shows highest revenue in 2022.Deliver and pitch your topic in the best possible manner with this Revenue Split By Geography Film Media Company Profile Ppt PowerPoint Presentation Infographics Infographics PDF. Use them to share invaluable insights on United States, Revenue Distribution, Key Insights and impress your audience. This template can be altered and modified as per your expectations. So, grab it now.
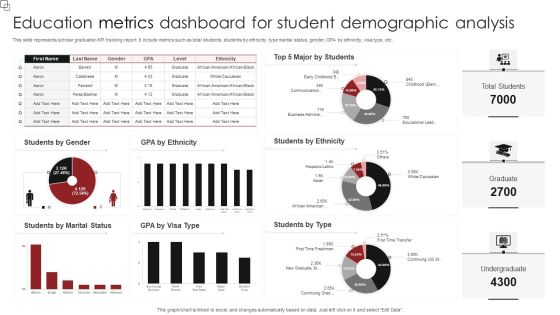
Education Metrics Dashboard For Student Demographic Analysis Diagrams PDF
This slide represents scholar graduation KPI tracking report. It include metrics such as total students, students by ethnicity, type marital status, gender, GPA by ethnicity, visa type, etc. Showcasing this set of slides titled Education Metrics Dashboard For Student Demographic Analysis Diagrams PDF. The topics addressed in these templates are Students Ethnicity, Students Type, Students Marital Status. All the content presented in this PPT design is completely editable. Download it and make adjustments in color, background, font etc. as per your unique business setting.
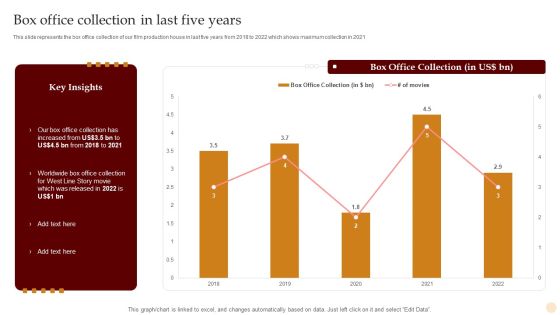
Motion Pictures Production Company Profile Box Office Collection In Last Five Years Diagrams PDF
This slide represents the box office collection of our film production house in last five years from 2018 to 2022 which shows maximum collection in 2021. Deliver and pitch your topic in the best possible manner with this Motion Pictures Production Company Profile Box Office Collection In Last Five Years Diagrams PDF. Use them to share invaluable insights on Box Office Collection, 2018 To 2022 and impress your audience. This template can be altered and modified as per your expectations. So, grab it now.
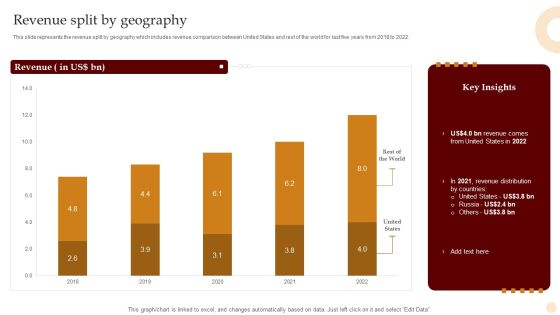
Motion Pictures Production Company Profile Revenue Split By Geography Brochure PDF
This slide represents the revenue split by geography which includes revenue comparison between United States and rest of the world for last five years from 2018 to 2022. Deliver and pitch your topic in the best possible manner with this Motion Pictures Production Company Profile Revenue Split By Geography Brochure PDF. Use them to share invaluable insights on Rest World, United States, 2018 To 2022 and impress your audience. This template can be altered and modified as per your expectations. So, grab it now.
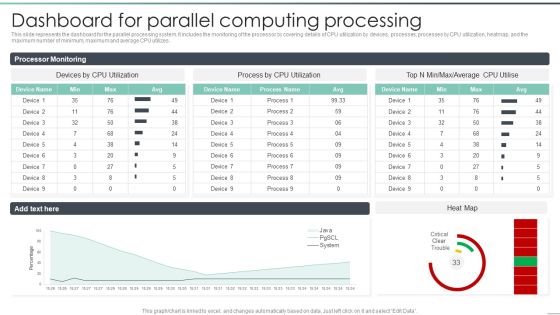
Parallel Computing Processing Dashboard For Parallel Computing Processing Template PDF
This slide represents the dashboard for the parallel processing system. It includes the monitoring of the processor by covering details of CPU utilization by devices, processes, processes by CPU utilization, heatmap, and the maximum number of minimum, maximum and average CPU utilizes. Deliver an awe inspiring pitch with this creative Parallel Computing Processing Dashboard For Parallel Computing Processing Template PDF bundle. Topics like Average, Processor Monitoring, Device can be discussed with this completely editable template. It is available for immediate download depending on the needs and requirements of the user.

Survey Showing Usage Of Quantitative Market Research By Teams Formats PDF
The following slide exhibits survey representing response of users on their usage of quantitative research methods. The answers includes at least 1 per project, sometimes, rarely, never and not sure. Pitch your topic with ease and precision using this Survey Showing Usage Of Quantitative Market Research By Teams Formats PDF. This layout presents information on Quantitative Market Research, Survey, Teams. It is also available for immediate download and adjustment. So, changes can be made in the color, design, graphics or any other component to create a unique layout.
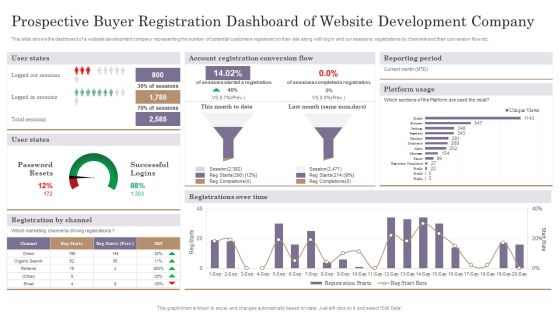
Prospective Buyer Registration Dashboard Of Website Development Company Sample PDF
This slide shows the dashboard of a website development company representing the number of potential customers registered on their site along with log in and our sessions, registrations by channels and their conversion flow etc. Showcasing this set of slides titled Prospective Buyer Registration Dashboard Of Website Development Company Sample PDF. The topics addressed in these templates are Account Registration, Reporting Period, Registrations Over. All the content presented in this PPT design is completely editable. Download it and make adjustments in color, background, font etc. as per your unique business setting.

Three Key Workplace Trend Statistics For Staff Slides PDF
This slide represents the organization trends for understanding the initiatives that are shifting the company. It includes effect of positive workplace, reasons of increased interest in remote area, etc. Pitch your topic with ease and precision using this Three Key Workplace Trend Statistics For Staff Slides PDF. This layout presents information on Workplace Environment, Greater Profitability, Customer. It is also available for immediate download and adjustment. So, changes can be made in the color, design, graphics or any other component to create a unique layout.

Top Trending Tools In RPA Market Robotic Process Automation Technology Download PDF
This slide represents the market value of the top trending RPA tools on a yearly basis, and UiPath is the tool that conquered the market in the last years. Deliver and pitch your topic in the best possible manner with this Top Trending Tools In RPA Market Robotic Process Automation Technology Download PDF. Use them to share invaluable insights on Visual Originator, Enormous Computerization, Different Highlights and impress your audience. This template can be altered and modified as per your expectations. So, grab it now.

Impacts Of Big Data Management On Business Processes Ppt PowerPoint Presentation File Infographics PDF
This slide represents the impacts of the big data deployment on the organization, and it shows the effect on decision making, decrease in expenses, customer service, and speed to market. Deliver and pitch your topic in the best possible manner with this Impacts Of Big Data Management On Business Processes Ppt PowerPoint Presentation File Infographics PDF. Use them to share invaluable insights on Decision Making, Expenses, Customer Engagement Rate and impress your audience. This template can be altered and modified as per your expectations. So, grab it now.

Instagram Company Details Story Reach Percentage By Content Type Rules PDF
This slide represents the average story reach rate by type of content such as images and videos in comparison to users profile size which shows video stories success to gain greater reach. Deliver and pitch your topic in the best possible manner with this Instagram Company Details Story Reach Percentage By Content Type Rules PDF. Use them to share invaluable insights on Story Reach Rate, Average Reach Rate and impress your audience. This template can be altered and modified as per your expectations. So, grab it now.
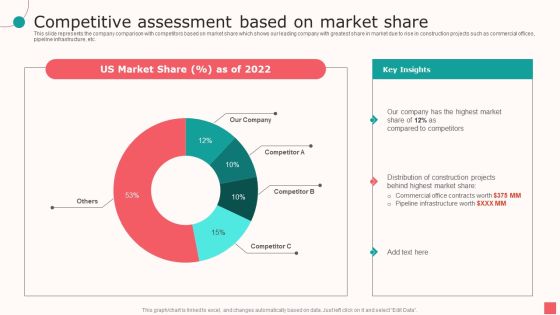
Real Estate Company Details Competitive Assessment Based On Market Share Ppt PowerPoint Presentation Summary Infographics PDF
This slide represents the company comparison with competitors based on market share which shows our leading company with greatest share in market due to rise in construction projects such as commercial offices, pipeline infrastructure, etc.Deliver an awe inspiring pitch with this creative Real Estate Company Details Competitive Assessment Based On Market Share Ppt PowerPoint Presentation Summary Infographics PDF bundle. Topics like Compared Competitors, Distribution Construction, Pipeline Infrastructure can be discussed with this completely editable template. It is available for immediate download depending on the needs and requirements of the user.

Emerging Software Development Trends Analysis Statistical Diagrams PDF
This slide shows the statistical graph representing the data related to emerging trends in the software development. It shows the change in usage of AI native apps, mix hybrid and native and AI hybrid for different years. Deliver and pitch your topic in the best possible manner with this Emerging Software Development Trends Analysis Statistical Diagrams PDF. Use them to share invaluable insights on Emerging Software Development, Trends Analysis Statistical and impress your audience. This template can be altered and modified as per your expectations. So, grab it now.
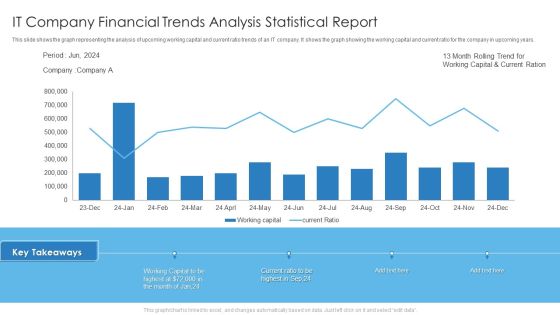
IT Company Financial Trends Analysis Statistical Report Slides PDF
This slide shows the graph representing the analysis of upcoming working capital and current ratio trends of an IT company. It shows the graph showing the working capital and current ratio for the company in upcoming years. Deliver and pitch your topic in the best possible manner with this IT Company Financial Trends Analysis Statistical Report Slides PDF. Use them to share invaluable insights on It Company Financial, Trends Analysis Statistical Report and impress your audience. This template can be altered and modified as per your expectations. So, grab it now.

Latest Digital Marketing Trend Analysis Statistical Template PDF
This slide represents the graph showing the latest trends in the field of digital marketing. It includes trends such as content marketing, AI and machine learning, marketing automation, big data, CRO and improving website experiences, social media marketing etc. Deliver an awe inspiring pitch with this creative Latest Digital Marketing Trend Analysis Statistical Template PDF bundle. Topics like Business Growth, Content Marketing, Technique can be discussed with this completely editable template. It is available for immediate download depending on the needs and requirements of the user.
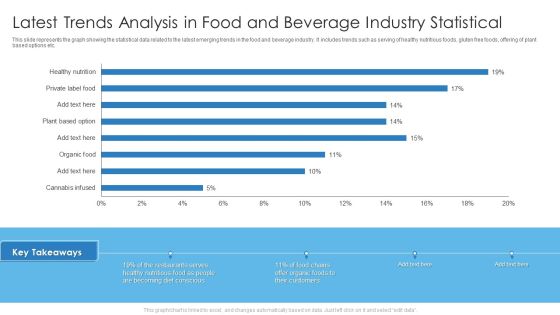
Latest Trends Analysis In Food And Beverage Industry Statistical Graphics PDF
This slide represents the graph showing the statistical data related to the latest emerging trends in the food and beverage industry. It includes trends such as serving of healthy nutritious foods, gluten free foods, offering of plant based options etc. Deliver and pitch your topic in the best possible manner with this Latest Trends Analysis In Food And Beverage Industry Statistical Graphics PDF. Use them to share invaluable insights on Latest Trends Analysis, Food And Beverage, Industry Statistical and impress your audience. This template can be altered and modified as per your expectations. So, grab it now.

Social Media Influencer Marketing Trend Analysis Statistical Themes PDF
This slide shows the graph representing the statistical data related to the emerging trends in the field of social media influencer marketing. It shows the upcoming trends in influencer marketing in the near future. Deliver an awe inspiring pitch with this creative Social Media Influencer Marketing Trend Analysis Statistical Themes PDF bundle. Topics like Social Media Influencer, Marketing Trend Analysis Statistical can be discussed with this completely editable template. It is available for immediate download depending on the needs and requirements of the user.

Abc Company Sales Trends Analysis Statistical Report Slides PDF
This slide represents the statistical report showing the sales trends analysis for ABC company. It includes details related to sales , gross profit and new customers for the current year, sales monthly trends, top 5 sales by region etc. Deliver an awe inspiring pitch with this creative Abc Company Sales Trends Analysis Statistical Report Slides PDF bundle. Topics like Abc Company Sales, Trends Analysis Statistical Report can be discussed with this completely editable template. It is available for immediate download depending on the needs and requirements of the user.

B2B Content Marketing Latest Trend Analysis Statistical Icons PDF
This slide shows the graph representing the statistical data related to latest trends emerging in the field of content marketing. It includes trends such as blog posts, email newsletters, case studies, videos, virtual events, infographics etc. Deliver an awe inspiring pitch with this creative B2B Content Marketing Latest Trend Analysis Statistical Icons PDF bundle. Topics like B2b Content Marketing, Latest Trend Analysis Statistical can be discussed with this completely editable template. It is available for immediate download depending on the needs and requirements of the user.
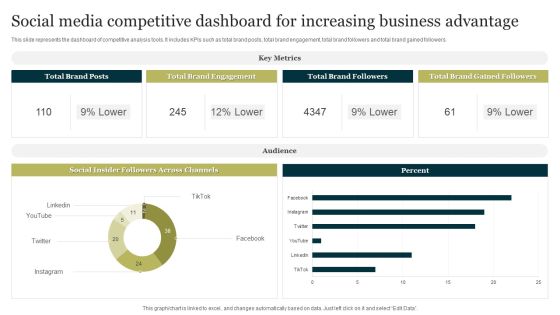
Social Media Competitive Dashboard For Increasing Business Advantage Portrait PDF
This slide represents the dashboard of competitive analysis tools. It includes KPIs such as total brand posts, total brand engagement, total brand followers and total brand gained followers. Pitch your topic with ease and precision using this Social Media Competitive Dashboard For Increasing Business Advantage Portrait PDF. This layout presents information on Social Media Competitive Dashboard, Increasing Business Advantage. It is also available for immediate download and adjustment. So, changes can be made in the color, design, graphics or any other component to create a unique layout.
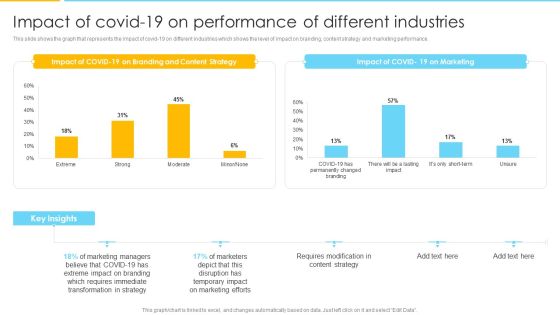
Optimizing Ecommerce Marketing Plan To Improve Sales Impact Of Covid 19 On Performance Of Different Industries Formats PDF
This slide shows the graph that represents the impact of covid 19 on different industries which shows the level of impact on branding, content strategy and marketing performance. Deliver an awe inspiring pitch with this creative Optimizing Ecommerce Marketing Plan To Improve Sales Impact Of Covid 19 On Performance Of Different Industries Formats PDF bundle. Topics like Transformation In Strategy, Marketing Managers, Content Strategy can be discussed with this completely editable template. It is available for immediate download depending on the needs and requirements of the user.

Business Opportunity Dashboard With Customer Metrics Information PDF
This Slide illustrates market opportunity dashboard with customer metrics which contains favorable net promoter score NPS, standard customers, growth rate, cumulative average of customer location, net income vs projection, customer distribution, sales by representatives, etc. Pitch your topic with ease and precision using this Business Opportunity Dashboard With Customer Metrics Information PDF. This layout presents information on Customer Distribution, Growth Rate, Top Customers Locations. It is also available for immediate download and adjustment. So, changes can be made in the color, design, graphics or any other component to create a unique layout.

Achieved And Pending Workplace Diversity Objectives Chart Guidelines PDF
This slide displays the bar chart representing the percentage of diversity goals achieved. It also includes some key insights such as an increase in the women workforce in tech roles, increase in director level black representation, etc. Showcasing this set of slides titled Achieved And Pending Workplace Diversity Objectives Chart Guidelines PDF. The topics addressed in these templates are Achieved And Pending Workplace, Diversity Objectives Chart. All the content presented in this PPT design is completely editable. Download it and make adjustments in color, background, font etc. as per your unique business setting.
Everything As A Service Xaas Market Share Xaas Cloud Computing Models Ppt PowerPoint Presentation Icon Designs PDF
This slide represents the market share for everything as a service over the projection period of 2020 2026 by covering details of the compound annual growth rate. Deliver an awe inspiring pitch with this creative Everything As A Service Xaas Market Share Xaas Cloud Computing Models Ppt PowerPoint Presentation Icon Designs PDF bundle. Topics like Projection Period, Behind Popularity, Increasing Need can be discussed with this completely editable template. It is available for immediate download depending on the needs and requirements of the user.
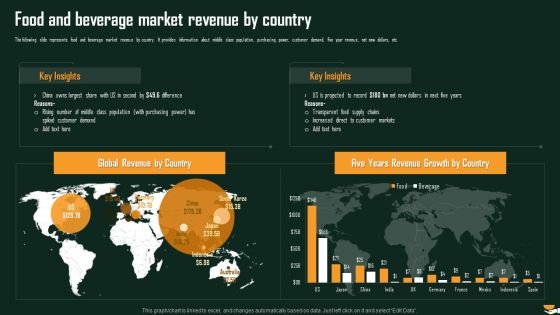
Food And Beverage Market Revenue By Country International Food And Beverages Sector Analysis Clipart PDF
The following slide represents food and beverage market revenue by country. It provides information about middle class population, purchasing power, customer demand, five year revenue, net new dollars, etc.Deliver an awe inspiring pitch with this creative Food And Beverage Market Revenue By Country International Food And Beverages Sector Analysis Clipart PDF bundle. Topics like Transparent Food Supply, Increased Direct, Customer Markets can be discussed with this completely editable template. It is available for immediate download depending on the needs and requirements of the user.
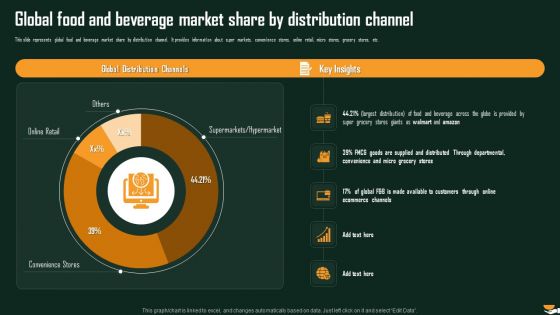
Global Food And Beverage Market Share By Distribution Channel International Food And Beverages Sector Analysis Portrait PDF
This slide represents global food and beverage market share by distribution channel. It provides information about super markets, convenience stores, online retail, micro stores, grocery stores, etc. Deliver and pitch your topic in the best possible manner with this Global Food And Beverage Market Share By Distribution Channel International Food And Beverages Sector Analysis Portrait PDF. Use them to share invaluable insights on Distribution Channels, Beverage Across, Through Departmental and impress your audience. This template can be altered and modified as per your expectations. So, grab it now.
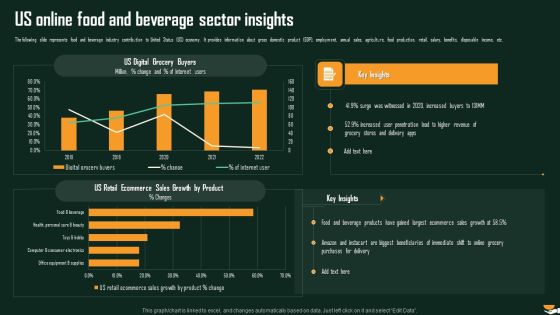
Us Online Food And Beverage Sector Insights International Food And Beverages Sector Analysis Template PDF
The following slide represents food and beverage industry contribution to United Status US economy. It provides information about gross domestic product GDP, employment, annual sales, agriculture, food production, retail, salary, benefits, disposable income, etc. Deliver and pitch your topic in the best possible manner with this Us Online Food And Beverage Sector Insights International Food And Beverages Sector Analysis Template PDF. Use them to share invaluable insights on Digital Grocery, Increased Penetration, Retail Ecommerce and impress your audience. This template can be altered and modified as per your expectations. So, grab it now.

Retail Store Social Media Activities Analysis Retail Outlet Performance Assessment Rules PDF
This slide represents the dashboard to showcase retail store social media activities such as followers on Facebook, Twitter, website traffic, etc. It also provides information regarding social media channels engagement in terms of clicks, shares, likes, and comments.Deliver an awe inspiring pitch with this creative Retail Store Social Media Activities Analysis Retail Outlet Performance Assessment Rules PDF bundle. Topics like Social Media, Channels, Referral Traffic can be discussed with this completely editable template. It is available for immediate download depending on the needs and requirements of the user.
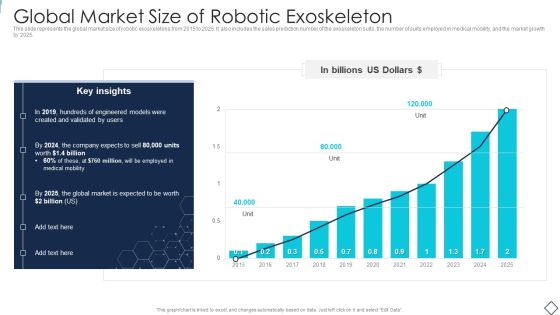
Robotic Armor IT Global Market Size Of Robotic Exoskeleton Brochure PDF
This slide represents the global market size of robotic exoskeletons from 2015 to 2025. It also includes the sales prediction number of the exoskeleton suits, the number of suits employed in medical mobility, and the market growth by 2025. Deliver an awe inspiring pitch with this creative Robotic Armor IT Global Market Size Of Robotic Exoskeleton Brochure PDF bundle. Topics like Billions US Dollars, Global Market, 2015 To 2025 can be discussed with this completely editable template. It is available for immediate download depending on the needs and requirements of the user.

Deployment Of Smart Factory Solutions Key Impact Of Smart Manufacturing Implementation Download PDF
This slide represents key impact of smart manufacturing on organization. It highlights increase in product quality and productivity level leading to enhancement in customer satisfaction level and revenue generation. Deliver and pitch your topic in the best possible manner with this Deployment Of Smart Factory Solutions Key Impact Of Smart Manufacturing Implementation Download PDF. Use them to share invaluable insights on Product Quality, Customer Satisfaction, Product Defects, Revenue and impress your audience. This template can be altered and modified as per your expectations. So, grab it now.

IT Project Change Management Control Dashboard Topics PDF
This slide represents the dashboard for management of requests for change in IT teams project. It shows details related to open requests for changes status, their impact levels, risk levels, priority codes etc. Showcasing this set of slides titled IT Project Change Management Control Dashboard Topics PDF. The topics addressed in these templates are IT Project Change Management, Control Dashboard. All the content presented in this PPT design is completely editable. Download it and make adjustments in color, background, font etc. as per your unique business setting.
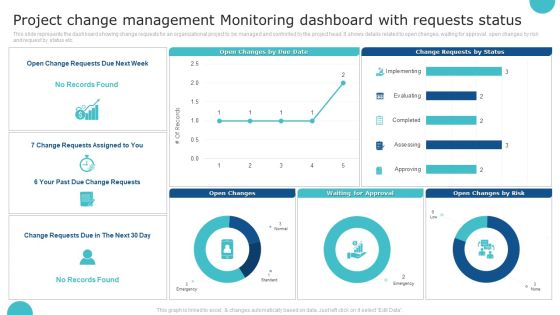
Project Change Management Monitoring Dashboard With Requests Status Structure PDF
This slide represents the dashboard showing change requests for an organizational project to be managed and controlled by the project head. It shows details related to open changes, waiting for approval, open changes by risk and request by status etc. Showcasing this set of slides titled Project Change Management Monitoring Dashboard With Requests Status Structure PDF. The topics addressed in these templates are Project Change Management, Monitoring Dashboard. All the content presented in this PPT design is completely editable. Download it and make adjustments in color, background, font etc. as per your unique business setting.

Cyber Risk Management Dashboard Of Enterprise Guidelines PDF
This slide shows dashboard of cyber risk management of an enterprise representing risk analysis progress, risk rating breakdown and heat map, action plan breakdown and top five vulnerabilities and entities etc. Showcasing this set of slides titled Cyber Risk Management Dashboard Of Enterprise Guidelines PDF. The topics addressed in these templates are Cyber Risk Management Dashboard, Enterprise. All the content presented in this PPT design is completely editable. Download it and make adjustments in color, background, font etc. as per your unique business setting.
Risk Management Dashboard Of IT Department With Threat Frequency Icons PDF
This slide shows dashboard of risk management of IT department representing net critical risks, threat and vulnerability frequency in last 60 days, open audit findings, open and vendor risks etc. Showcasing this set of slides titled Risk Management Dashboard Of IT Department With Threat Frequency Icons PDF. The topics addressed in these templates are Net Critical Risk, Organization, Threat Frequency. All the content presented in this PPT design is completely editable. Download it and make adjustments in color, background, font etc. as per your unique business setting.

Yearly Sales Assessment Dashboard With Total Revenue Introduction PDF
This slide represent annual sales review dashboard of various products sold by an organization through various selling platform with comparison and product wise revenue generated .It includes product, unit sold and total revenue. Showcasing this set of slides titled Yearly Sales Assessment Dashboard With Total Revenue Introduction PDF. The topics addressed in these templates are Product Sold, Inventory Outstanding, Average. All the content presented in this PPT design is completely editable. Download it and make adjustments in color, background, font etc. as per your unique business setting.

Yearly Sales Assessment Of Products With Bar Graph Structure PDF
This slide represent graphical presentation of annual sales review of various products sold by an organization within 5 years showing difference in revenue generated .It shows report of following years 2018,2019,2020,and 2021. Showcasing this set of slides titled Yearly Sales Assessment Of Products With Bar Graph Structure PDF. The topics addressed in these templates are Product, Sales Of Product, Product Demand. All the content presented in this PPT design is completely editable. Download it and make adjustments in color, background, font etc. as per your unique business setting.
Shipping And Logistics Tracking Dashboard With Shipments And Fleet Status Elements PDF
This slide covers Key performance indicators to track the automation system of the company. This dashboard includes Logistics Efficiency Status, delivery time accuracy etc. Take your projects to the next level with our ultimate collection of Shipping And Logistics Tracking Dashboard With Shipments And Fleet Status Elements PDF. Slidegeeks has designed a range of layouts that are perfect for representing task or activity duration, keeping track of all your deadlines at a glance. Tailor these designs to your exact needs and give them a truly corporate look with your own brand colors they ll make your projects stand out from the rest.

Comparison Of Beauty Care Products Sales With Competitor Companies Ppt Slides Samples PDF
This slide shows graph which can be used by organizations to represent the sales performance of company in comparison to other competitors. It includes quarterly sales data Showcasing this set of slides titled Comparison Of Beauty Care Products Sales With Competitor Companies Ppt Slides Samples PDF. The topics addressed in these templates are Our Product, Poor Sales Strategy, Product Improvement. All the content presented in this PPT design is completely editable. Download it and make adjustments in color, background, font etc. as per your unique business setting.

Statistics Showing Annual Comparison Of Multiple Beauty Care Products Ppt Infographics Objects PDF
This slide contains graph which can be used by cosmetic manufacturing organizations to represent difference between annual sales of various products. It includes products such as skin care, hair care, oral care and others. Showcasing this set of slides titled Statistics Showing Annual Comparison Of Multiple Beauty Care Products Ppt Infographics Objects PDF. The topics addressed in these templates are Skin Care, Hair Care, 2022 To 2023. All the content presented in this PPT design is completely editable. Download it and make adjustments in color, background, font etc. as per your unique business setting.

Brand Value Measuring KPI Dashboard Guide To Understand Evaluate And Enhance Brand Value Slides PDF
Following slide illustrates KPI dashboard to measure brand value. KPIs covered are brand value and percentage change, brand value over time, most followed brands on social media.Take your projects to the next level with our ultimate collection of Brand Value Measuring KPI Dashboard Guide To Understand Evaluate And Enhance Brand Value Slides PDF. Slidegeeks has designed a range of layouts that are perfect for representing task or activity duration, keeping track of all your deadlines at a glance. Tailor these designs to your exact needs and give them a truly corporate look with your own brand colors they all make your projects stand out from the rest
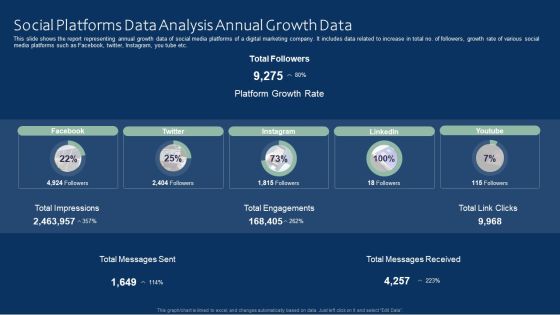
Social Platforms Data Analysis Annual Growth Data Ideas PDF
This slide shows the report representing annual growth data of social media platforms of a digital marketing company. It includes data related to increase in total no. of followers, growth rate of various social media platforms such as Facebook, twitter, Instagram, you tube etc. Pitch your topic with ease and precision using this Social Platforms Data Analysis Annual Growth Data Ideas PDF. This layout presents information on Social Platforms Data Analysis, Annual Growth Data. It is also available for immediate download and adjustment. So, changes can be made in the color, design, graphics or any other component to create a unique layout.

Customer Engagement Data Through Social Platforms Data Analysis Brochure PDF
This slide demonstrates the dashboard representing the user engagement related to campaign A organized by ABC company. It includes statistical data related to no. of reach, custom button clicks, no. of shares, post engagement rate, taps on website link by users etc. Showcasing this set of slides titled Customer Engagement Data Through Social Platforms Data Analysis Brochure PDF. The topics addressed in these templates are Customer Engagement Data, Social Platforms Data Analysis. All the content presented in this PPT design is completely editable. Download it and make adjustments in color, background, font etc. as per your unique business setting.
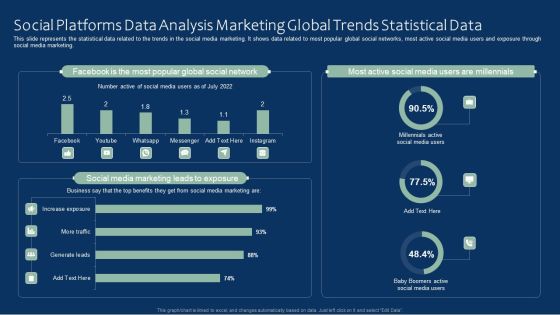
Social Platforms Data Analysis Marketing Global Trends Statistical Data Rules PDF
This slide represents the statistical data related to the trends in the social media marketing. It shows data related to most popular global social networks, most active social media users and exposure through social media marketing. Pitch your topic with ease and precision using this Social Platforms Data Analysis Marketing Global Trends Statistical Data Rules PDF. This layout presents information on Social Platforms Data Analysis, Marketing Global, Trends Statistical Data. It is also available for immediate download and adjustment. So, changes can be made in the color, design, graphics or any other component to create a unique layout.

Social Platforms Data Analysis Usage By Digital Marketing Companies Data Clipart PDF
This slide represents statistical data related to use of various social media platforms by digital marketing company for customer engagement. It includes use of various social media platforms such as Instagram, facebook, twitter, you tube etc. for customer engagement. Pitch your topic with ease and precision using this Social Platforms Data Analysis Usage By Digital Marketing Companies Data Clipart PDF. This layout presents information on Social Platforms Data Analysis, Digital Marketing Companies Data. It is also available for immediate download and adjustment. So, changes can be made in the color, design, graphics or any other component to create a unique layout.
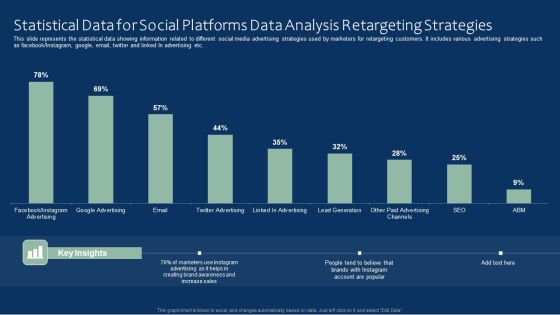
Statistical Data For Social Platforms Data Analysis Retargeting Strategies Inspiration PDF
This slide represents the statistical data showing information related to different social media advertising strategies used by marketers for retargeting customers. It includes various advertising strategies such as facebook or Instagram, google, email, twitter and linked In advertising etc. Showcasing this set of slides titled Statistical Data For Social Platforms Data Analysis Retargeting Strategies Inspiration PDF. The topics addressed in these templates are Social Platforms Data, Statistical Data, Analysis Retargeting Strategies. All the content presented in this PPT design is completely editable. Download it and make adjustments in color, background, font etc. as per your unique business setting.

Usage Of Social Platforms Data Analysis For Marketers Information PDF
This slide represents the various uses of social media data analysis for marketers. It includes various uses of data analysis for marketers such as development of creative content, trend analysis, measure ROI, competitive insights etc. Showcasing this set of slides titled Usage Of Social Platforms Data Analysis For Marketers Information PDF. The topics addressed in these templates are Creative Content Development, Assess Campaign Performance, Build Communication. All the content presented in this PPT design is completely editable. Download it and make adjustments in color, background, font etc. as per your unique business setting.

KPI Dashboard To Measure Talent Performance Slides PDF
This slide represents dashboard to measure talent performance in organization. It includes talent applicant status, team training methods, talented candidate status, risk for loss of potential talent pool etc. Get a simple yet stunning designed KPI Dashboard To Measure Talent Performance Slides PDF. It is the best one to establish the tone in your meetings. It is an excellent way to make your presentations highly effective. So, download this PPT today from Slidegeeks and see the positive impacts. Our easy to edit KPI Dashboard To Measure Talent Performance Slides PDF can be your go-to option for all upcoming conferences and meetings. So, what are you waiting for Grab this template today.
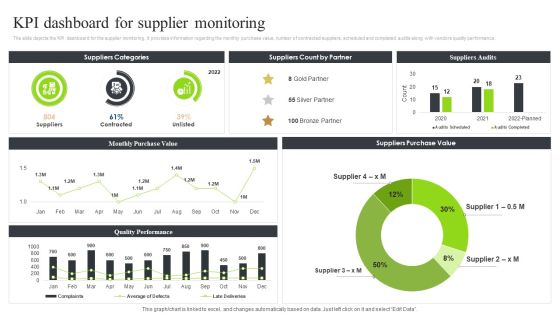
Strategic Sourcing And Supplier Quality Kpi Dashboard For Supplier Monitoring Graphics PDF
The slide depicts the KPI dashboard for the supplier monitoring. It provides information regarding the monthly purchase value, number of contracted suppliers, scheduled and completed audits along with vendors quality performance.Take your projects to the next level with our ultimate collection of Strategic Sourcing And Supplier Quality Kpi Dashboard For Supplier Monitoring Graphics PDF. Slidegeeks has designed a range of layouts that are perfect for representing task or activity duration, keeping track of all your deadlines at a glance. Tailor these designs to your exact needs and give them a truly corporate look with your own brand colors they all make your projects stand out from the rest.

Benefits Of Enterprise Risk Management Experienced By Organizations Pictures PDF
This slide represents the ways in which enterprise risk management helps organizations to improve decision quality, reduce business liability and frame regulatory issues. It includes details related to results of survey conducted to analyze benefits of ERM experienced by various organizations. Find a pre designed and impeccable Benefits Of Enterprise Risk Management Experienced By Organizations Pictures PDF. The templates can ace your presentation without additional effort. You can download these easy to edit presentation templates to make your presentation stand out from others. So, what are you waiting for Download the template from Slidegeeks today and give a unique touch to your presentation.
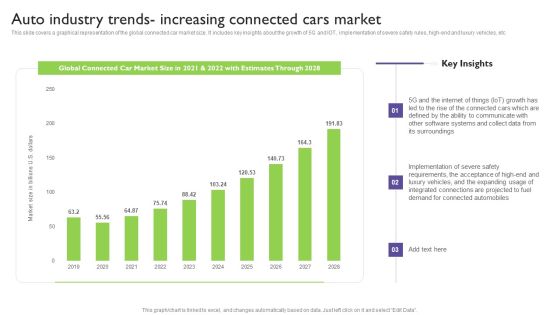
Global Automotive Industry Analysis Auto Industry Trends Increasing Connected Cars Market Pictures PDF
This slide covers a graphical representation of the global connected car market size. It includes key insights about the growth of 5G and IOT, implementation of severe safety rules, high-end and luxury vehicles, etc. Take your projects to the next level with our ultimate collection of Global Automotive Industry Analysis Auto Industry Trends Increasing Connected Cars Market Pictures PDF. Slidegeeks has designed a range of layouts that are perfect for representing task or activity duration, keeping track of all your deadlines at a glance. Tailor these designs to your exact needs and give them a truly corporate look with your own brand colors they will make your projects stand out from the rest.

Centralized Repository Data Lake Reporting Dashboard Icons PDF
This slide represents the data lake reporting dashboard by covering the total number of users, total lake size, trusted zone size, conversion rate, and retention. Find a pre designed and impeccable Centralized Repository Data Lake Reporting Dashboard Icons PDF. The templates can ace your presentation without additional effort. You can download these easy to edit presentation templates to make your presentation stand out from others. So, what are you waiting for Download the template from Slidegeeks today and give a unique touch to your presentation.

Application Of SDLC Models In Different Sectors Phases Of Software Development Procedure Clipart PDF
This slide represents the application of software development life cycle models in different sectors, such as software houses, software solution providers, government, and telecom.From laying roadmaps to briefing everything in detail, our templates are perfect for you. You can set the stage with your presentation slides. All you have to do is download these easy-to-edit and customizable templates. Application Of SDLC Models In Different Sectors Phases Of Software Development Procedure Clipart PDF will help you deliver an outstanding performance that everyone would remember and praise you for. Do download this presentation today.
Performance Tracking Dashboard For SDLC Phases Of Software Development Procedure Demonstration PDF
This slide represents the requirement gathering and analysis phase of the software development life cycle, including the steps taken in this stage, such as collecting needed information about the product to be made.This Performance Tracking Dashboard For SDLC Phases Of Software Development Procedure Demonstration PDF is perfect for any presentation, be it in front of clients or colleagues. It is a versatile and stylish solution for organizing your meetings. The product features a modern design for your presentation meetings. The adjustable and customizable slides provide unlimited possibilities for acing up your presentation. Slidegeeks has done all the homework before launching the product for you. So, do not wait, grab the presentation templates today.
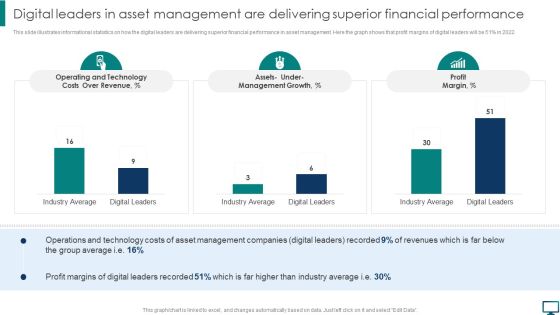
Digital Leaders In Asset Management Are Delivering Superior Financial Performance Topics PDF
This slide illustrates informational statistics on how the digital leaders are delivering superior financial performance in asset management. Here the graph shows that profit margins of digital leaders will be 51 percent in 2022. Take your projects to the next level with our ultimate collection of Digital Leaders In Asset Management Are Delivering Superior Financial Performance Topics PDF. Slidegeeks has designed a range of layouts that are perfect for representing task or activity duration, keeping track of all your deadlines at a glance. Tailor these designs to your exact needs and give them a truly corporate look with your own brand colors they will make your projects stand out from the rest.

Dashboard To Track Product Sales Performance Implementing Focus Strategy To Improve Designs PDF
This slide showcases dashboard that can help organization to analyse the sales of product after entering into niche market. Its key elements are sales, sales target, sales growth, sales by channel, inventory days outstanding etc.Take your projects to the next level with our ultimate collection of Dashboard To Track Product Sales Performance Implementing Focus Strategy To Improve Designs PDF. Slidegeeks has designed a range of layouts that are perfect for representing task or activity duration, keeping track of all your deadlines at a glance. Tailor these designs to your exact needs and give them a truly corporate look with your own brand colors they all make your projects stand out from the rest.

Architecture Engineering Planning Services Company Key CSR Initiatives Sample PDF
This slide highlights the corporate social responsibilities activities of architecture company which include eLearning, blood donation camps, engage empower and educate. Take your projects to the next level with our ultimate collection of Architecture Engineering Planning Services Company Key CSR Initiatives Sample PDF. Slidegeeks has designed a range of layouts that are perfect for representing task or activity duration, keeping track of all your deadlines at a glance. Tailor these designs to your exact needs and give them a truly corporate look with your own brand colors they will make your projects stand out from the rest.

Experian Company Outline Revenue By Customer Fy2022 Microsoft PDF
This slide highlights the revenue by customer which includes financial service, direct to consumer, health, retail, automotive, insurance, government, and public sector, media and technology. Take your projects to the next level with our ultimate collection of Experian Company Outline Revenue By Customer Fy2022 Microsoft PDF. Slidegeeks has designed a range of layouts that are perfect for representing task or activity duration, keeping track of all your deadlines at a glance. Tailor these designs to your exact needs and give them a truly corporate look with your own brand colors they will make your projects stand out from the rest.
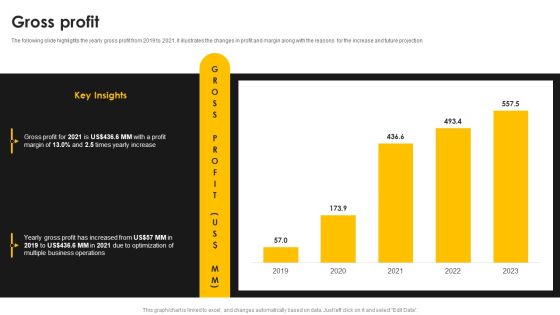
Kantar Consulting Company Outline Gross Profit Template PDF
The following slide highlights the yearly gross profit from 2019 to 2021. it illustrates the changes in profit and margin along with the reasons for the increase and future projection. Take your projects to the next level with our ultimate collection of Kantar Consulting Company Outline Gross Profit Template PDF. Slidegeeks has designed a range of layouts that are perfect for representing task or activity duration, keeping track of all your deadlines at a glance. Tailor these designs to your exact needs and give them a truly corporate look with your own brand colors they will make your projects stand out from the rest.
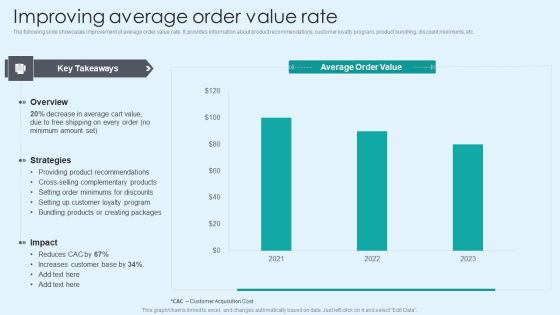
Improving Average Order Value Rate Slides PDF
The following slide showcases improvement of average order value rate. It provides information about product recommendations, customer loyalty program, product bundling, discount minimums, etc. Take your projects to the next level with our ultimate collection of Improving Average Order Value Rate Slides PDF. Slidegeeks has designed a range of layouts that are perfect for representing task or activity duration, keeping track of all your deadlines at a glance. Tailor these designs to your exact needs and give them a truly corporate look with your own brand colors they will make your projects stand out from the rest.

Automobile Company Actual And Forecasted Monthly Sales Dashboard Ppt Infographic Template Aids PDF
This slide shows the dashboard for forecasting the sales of an automobile company for the current month. It represents details related to revenue by pipeline, new deals, sales forecast, revenue goal attainment by owner for the current month and pipeline coverage by next month. Showcasing this set of slides titled Automobile Company Actual And Forecasted Monthly Sales Dashboard Ppt Infographic Template Aids PDF. The topics addressed in these templates are Forecast Month, Revenue Goal Attainment, Revenue Goal Attainment. All the content presented in this PPT design is completely editable. Download it and make adjustments in color, background, font etc. as per your unique business setting.

Financial Services Organization Monthly Sales Forecast Dashboard Ppt Summary Slideshow PDF
This slide shows the dashboard representing data related to monthly sales forecast of the organization offering financial services to its clients. It includes information related to forecasted data, sales forecast, total sales, forecast projection etc. Showcasing this set of slides titled Financial Services Organization Monthly Sales Forecast Dashboard Ppt Summary Slideshow PDF. The topics addressed in these templates are Forecasts Sales, Time Series View, Forecast Projection. All the content presented in this PPT design is completely editable. Download it and make adjustments in color, background, font etc. as per your unique business setting.
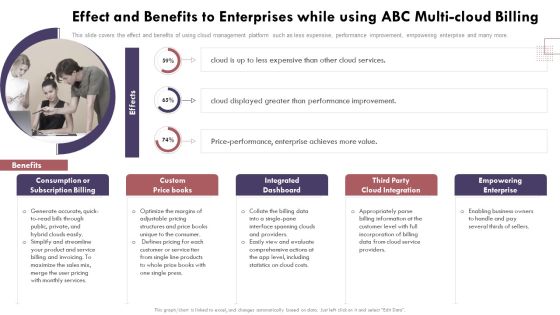
Effect And Benefits To Enterprises While Using Abc Cloud Computing Complexities And Solutions Slides PDF
This slide covers the effect and benefits of using cloud management platform such as less expensive, performance improvement, empowering enterprise and many more.Take your projects to the next level with our ultimate collection of Effect And Benefits To Enterprises While Using Abc Cloud Computing Complexities And Solutions Slides PDF. Slidegeeks has designed a range of layouts that are perfect for representing task or activity duration, keeping track of all your deadlines at a glance. Tailor these designs to your exact needs and give them a truly corporate look with your own brand colors they all make your projects stand out from the rest.

Brand Engagement Promotional Campaign Implementation Key Impact Of Promotional Event For Brand Awareness Diagrams PDF
This slide represents key impacts for promotional event. It covers site traffic, ROAS, customer lifetime value, engaged visit rate, page value etc. Find a pre designed and impeccable Brand Engagement Promotional Campaign Implementation Key Impact Of Promotional Event For Brand Awareness Diagrams PDF. The templates can ace your presentation without additional effort. You can download these easy to edit presentation templates to make your presentation stand out from others. So, what are you waiting for Download the template from Slidegeeks today and give a unique touch to your presentation.
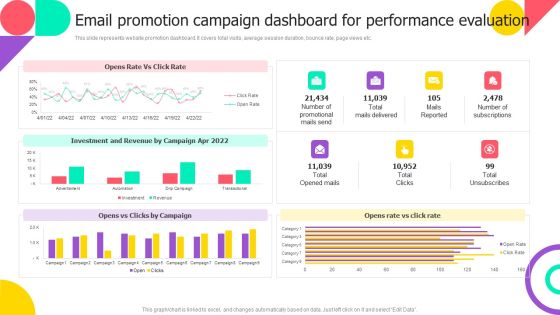
Email Promotion Campaign Dashboard For Performance Evaluation Pictures PDF
This slide represents website promotion dashboard. It covers total visits, average session duration, bounce rate, page views etc. Want to ace your presentation in front of a live audience Our Email Promotion Campaign Dashboard For Performance Evaluation Pictures PDF can help you do that by engaging all the users towards you. Slidegeeks experts have put their efforts and expertise into creating these impeccable powerpoint presentations so that you can communicate your ideas clearly. Moreover, all the templates are customizable, and easy to edit and downloadable. Use these for both personal and commercial use.

Network Risks Management And Barriers Dashboard Ppt PowerPoint Presentation Gallery Graphic Tips PDF
This slide represents a dashboard of network risk management. It also includes problem servers , workstations and their status, unmonitored network devices. Pitch your topic with ease and precision using this Network Risks Management And Barriers Dashboard Ppt PowerPoint Presentation Gallery Graphic Tips PDF. This layout presents information on Problem Servers, Server Status, Problem Workstations, Workstation Status. It is also available for immediate download and adjustment. So, changes can be made in the color, design, graphics or any other component to create a unique layout.

Ad And Media Agency Company Profile Revenue And Net Profits Diagrams PDF
This slide focuses on financial highlights of advertising agency which represents revenue and net profits for last five years from 2018 to 2022. Welcome to our selection of the Ad And Media Agency Company Profile Revenue And Net Profits Diagrams PDF. These are designed to help you showcase your creativity and bring your sphere to life. Planning and Innovation are essential for any business that is just starting out. This collection contains the designs that you need for your everyday presentations. All of our PowerPoints are 100 percent editable, so you can customize them to suit your needs. This multi-purpose template can be used in various situations. Grab these presentation templates today.
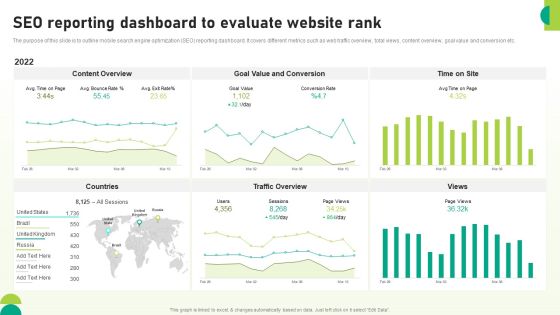
Utilizing SEO To Boost Customer SEO Reporting Dashboard To Evaluate Website Rank Background PDF
The purpose of this slide is to outline mobile search engine optimization SEO reporting dashboard. It covers different metrics such as web traffic overview, total views, content overview, goal value and conversion etc. Take your projects to the next level with our ultimate collection of Utilizing SEO To Boost Customer SEO Reporting Dashboard To Evaluate Website Rank Background PDF. Slidegeeks has designed a range of layouts that are perfect for representing task or activity duration, keeping track of all your deadlines at a glance. Tailor these designs to your exact needs and give them a truly corporate look with your own brand colors theyll make your projects stand out from the rest.
Digital Application Software Development Business Profile Financial Statements Icons PDF
The slide showcases income statement, balance sheet and cashflow statement of last five years to represent current financial position of organisation. Crafting an eye-catching presentation has never been more straightforward. Let your presentation shine with this tasteful yet straightforward Digital Application Software Development Business Profile Financial Statements Icons PDF template. It offers a minimalistic and classy look that is great for making a statement. The colors have been employed intelligently to add a bit of playfulness while still remaining professional. Construct the ideal Digital Application Software Development Business Profile Financial Statements Icons PDF that effortlessly grabs the attention of your audience Begin now and be certain to wow your customers.

Retail Analytics Dashboard To Measure Merchandise Planning Effectiveness Designs PDF
Do you have to make sure that everyone on your team knows about any specific topic I yes, then you should give Retail Analytics Dashboard To Measure Merchandise Planning Effectiveness Designs PDF a try. Our experts have put a lot of knowledge and effort into creating this impeccable Retail Analytics Dashboard To Measure Merchandise Planning Effectiveness Designs PDF. You can use this template for your upcoming presentations, as the slides are perfect to represent even the tiniest detail. You can download these templates from the Slidegeeks website and these are easy to edit. So grab these today.

Business Strategy Consulting Solutions Company Outline Revenue Split By Geography And Business Areas Designs PDF
This slide showcases the revenue breakdown by geography such as Asia, North America, Australia, etc. It also covers business areas revenue split such as management consulting, IT consulting, etc. Take your projects to the next level with our ultimate collection of Business Strategy Consulting Solutions Company Outline Revenue Split By Geography And Business Areas Designs PDF. Slidegeeks has designed a range of layouts that are perfect for representing task or activity duration, keeping track of all your deadlines at a glance. Tailor these designs to your exact needs and give them a truly corporate look with your own brand colors they will make your projects stand out from the rest.

Business Strategy Consulting Solutions Company Outline Shareholding Structure Professional PDF
This slide represents the shareholding structure of consulting firm which includes promoters, general public, foreign institutional investors, state or government, etc. Do you know about Slidesgeeks Business Strategy Consulting Solutions Company Outline Shareholding Structure Professional PDF These are perfect for delivering any kind od presentation. Using it, create PowerPoint presentations that communicate your ideas and engage audiences. Save time and effort by using our pre designed presentation templates that are perfect for a wide range of topic. Our vast selection of designs covers a range of styles, from creative to business, and are all highly customizable and easy to edit. Download as a PowerPoint template or use them as Google Slides themes.
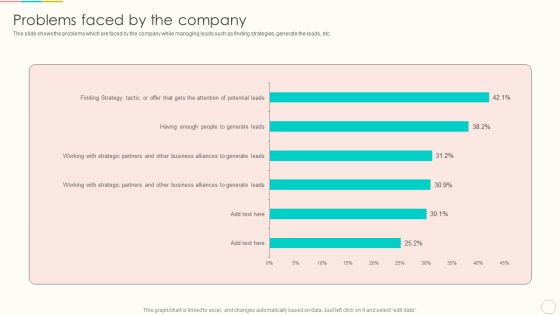
Lead Management To Engage Potential Customers Problems Faced By The Company Summary PDF
This slide shows the problems which are faced by the company while managing leads such as finding strategies, generate the leads, etc. Take your projects to the next level with our ultimate collection of Lead Management To Engage Potential Customers Problems Faced By The Company Summary PDF. Slidegeeks has designed a range of layouts that are perfect for representing task or activity duration, keeping track of all your deadlines at a glance. Tailor these designs to your exact needs and give them a truly corporate look with your own brand colors they will make your projects stand out from the rest.
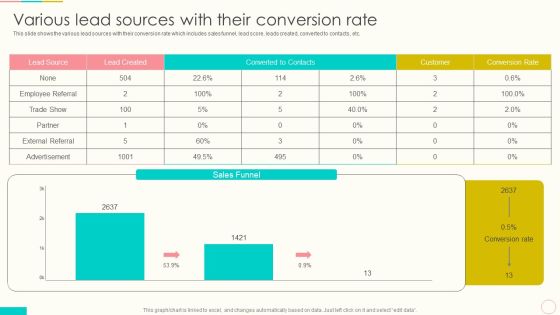
Lead Management To Engage Potential Customers Various Lead Sources With Their Conversion Rate Template PDF
This slide shows the various lead sources with their conversion rate which includes sales funnel, lead score, leads created, converted to contacts, etc. Take your projects to the next level with our ultimate collection of Lead Management To Engage Potential Customers Various Lead Sources With Their Conversion Rate Template PDF. Slidegeeks has designed a range of layouts that are perfect for representing task or activity duration, keeping track of all your deadlines at a glance. Tailor these designs to your exact needs and give them a truly corporate look with your own brand colors they will make your projects stand out from the rest.
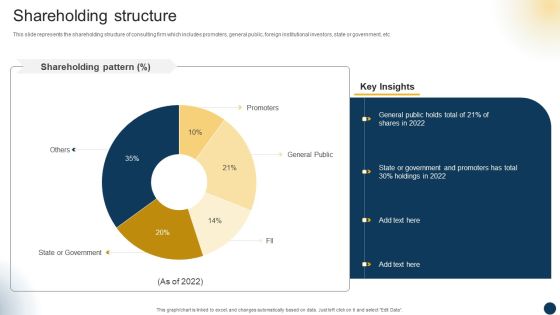
Organizational Advisory Solutions Business Profile Shareholding Structure Designs PDF
This slide represents the shareholding structure of consulting firm which includes promoters, general public, foreign institutional investors, state or government, etc. This Organizational Advisory Solutions Business Profile Shareholding Structure Designs PDF from Slidegeeks makes it easy to present information on your topic with precision. It provides customization options, so you can make changes to the colors, design, graphics, or any other component to create a unique layout. It is also available for immediate download, so you can begin using it right away. Slidegeeks has done good research to ensure that you have everything you need to make your presentation stand out. Make a name out there for a brilliant performance.
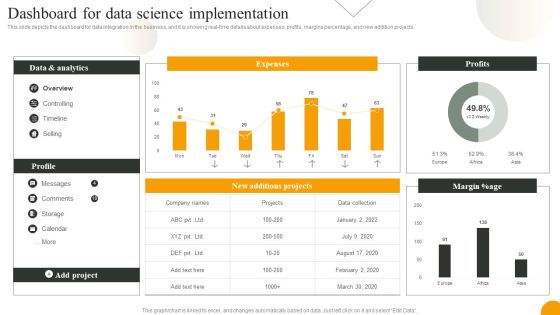
Using Data Science Technologies For Business Transformation Dashboard For Data Science Implementation Portrait PDF
This slide depicts the dashboard for data integration in the business, and it is showing real-time details about expenses, profits, margins percentage, and new addition projects. Take your projects to the next level with our ultimate collection of Using Data Science Technologies For Business Transformation Dashboard For Data Science Implementation Portrait PDF. Slidegeeks has designed a range of layouts that are perfect for representing task or activity duration, keeping track of all your deadlines at a glance. Tailor these designs to your exact needs and give them a truly corporate look with your own brand colors they will make your projects stand out from the rest.
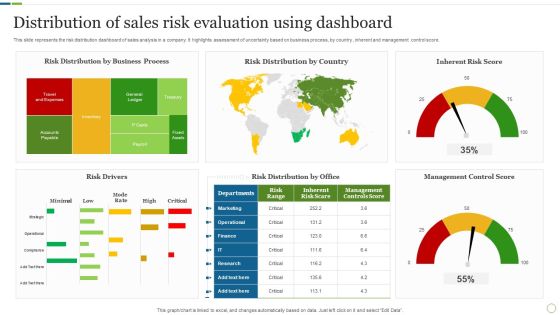
Distribution Of Sales Risk Evaluation Using Dashboard Brochure PDF
This slide represents the risk distribution dashboard of sales analysis in a company. It highlights assessment of uncertainty based on business process, by country , inherent and management control score. Showcasing this set of slides titled Distribution Of Sales Risk Evaluation Using Dashboard Brochure PDF. The topics addressed in these templates are Risk Drivers, Management Control Score, Inherent Risk Score. All the content presented in this PPT design is completely editable. Download it and make adjustments in color, background, font etc. as per your unique business setting.
Six Months Business Valuation Chart Ppt Styles Icons PDF
This slide shows the 6 months graph to measure company valuation. It is representing that highest valuation of company was calculated in the month of June due to increase in sales. Pitch your topic with ease and precision using this Six Months Business Valuation Chart Ppt Styles Icons PDF. This layout presents information on Increase Sales, Company Valuation. It is also available for immediate download and adjustment. So, changes can be made in the color, design, graphics or any other component to create a unique layout.

Analyzing Top Reasons For Product Creating And Offering Multiple Product Ranges In New Business Designs PDF
This slide displays various reasons that may contribute to product portfolio failure in new region. Most contributing factor is unclear or continuously changing product definitions which contribute 42 precent to product failure.Take your projects to the next level with our ultimate collection of Analyzing Top Reasons For Product Creating And Offering Multiple Product Ranges In New Business Designs PDF. Slidegeeks has designed a range of layouts that are perfect for representing task or activity duration, keeping track of all your deadlines at a glance. Tailor these designs to your exact needs and give them a truly corporate look with your own brand colors they all make your projects stand out from the rest.
Strategic Brand Refreshing Actions Rebranding Project Progress Tracking Dashboard Brochure PDF
This slide provides information regarding essential characteristics of co branding in terms of strategic partnership, build credibility, developing marketing strategy, develop innovation and value addition, etc. Take your projects to the next level with our ultimate collection of Strategic Brand Refreshing Actions Rebranding Project Progress Tracking Dashboard Brochure PDF. Slidegeeks has designed a range of layouts that are perfect for representing task or activity duration, keeping track of all your deadlines at a glance. Tailor these designs to your exact needs and give them a truly corporate look with your own brand colors they will make your projects stand out from the rest.
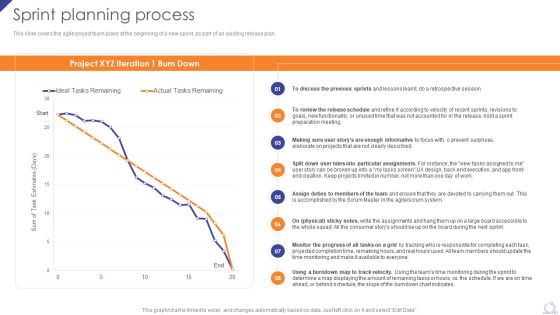
Sprint Planning Process Agile Project Development Strategies Information PDF
Do you have to make sure that everyone on your team knows about any specific topic I yes, then you should give Sprint Planning Process Agile Project Development Strategies Information PDF a try. Our experts have put a lot of knowledge and effort into creating this impeccable Sprint Planning Process Agile Project Development Strategies Information PDF. You can use this template for your upcoming presentations, as the slides are perfect to represent even the tiniest detail. You can download these templates from the Slidegeeks website and these are easy to edit. So grab these today.

Impact Of Problems On Business IT Service Management Framework Graphics PDF
This slide depicts the impacts of issues on the business, such as revenue loss and customer loss, by describing the number monthly from January to December.Take your projects to the next level with our ultimate collection of Impact Of Problems On Business IT Service Management Framework Graphics PDF. Slidegeeks has designed a range of layouts that are perfect for representing task or activity duration, keeping track of all your deadlines at a glance. Tailor these designs to your exact needs and give them a truly corporate look with your own brand colors they all make your projects stand out from the rest.
Reverse Proxy Web Server Dashboard For Reverse Proxy Performance Tracking Elements PDF
This slide represents the dashboard for reverse proxy performance tracking by covering details of CPU load, available memory, and connections. If your project calls for a presentation, then Slidegeeks is your go-to partner because we have professionally designed, easy-to-edit templates that are perfect for any presentation. After downloading, you can easily edit Reverse Proxy Web Server Dashboard For Reverse Proxy Performance Tracking Elements PDF and make the changes accordingly. You can rearrange slides or fill them with different images. Check out all the handy templates
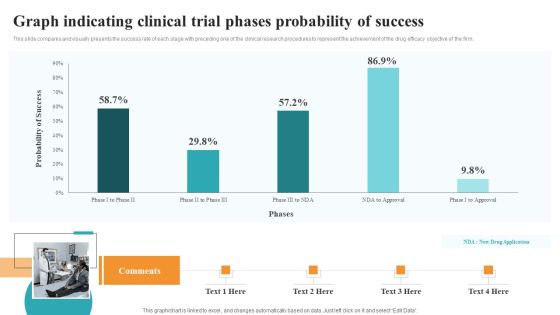
Graph Indicating Clinical Trial Phases Probability Of Success Medical Research Phases For Clinical Tests Graphics PDF
This slide compares and visually presents the success rate of each stage with preceding one of the clinical research procedures to represent the achievement of the drug efficacy objective of the firm. There are so many reasons you need a Graph Indicating Clinical Trial Phases Probability Of Success Medical Research Phases For Clinical Tests Graphics PDF. The first reason is you can not spend time making everything from scratch, Thus, Slidegeeks has made presentation templates for you too. You can easily download these templates from our website easily.

Historical And Forecasted Sales Analysis Efficient B2B And B2C Marketing Techniques For Organization Topics PDF
Do you have to make sure that everyone on your team knows about any specific topic I yes, then you should give Historical And Forecasted Sales Analysis Efficient B2B And B2C Marketing Techniques For Organization Topics PDF a try. Our experts have put a lot of knowledge and effort into creating this impeccable Historical And Forecasted Sales Analysis Efficient B2B And B2C Marketing Techniques For Organization Topics PDF. You can use this template for your upcoming presentations, as the slides are perfect to represent even the tiniest detail. You can download these templates from the Slidegeeks website and these are easy to edit. So grab these today.

Deploying House Flipping Business Plan Real Estate Industry Analysis For Performance Evaluation Inspiration PDF
This slide represents industry analysis and performance assessment for real estate market to build business plan. It covers generations buying properties, mortgages, consumer spending etc. From laying roadmaps to briefing everything in detail, our templates are perfect for you. You can set the stage with your presentation slides. All you have to do is download these easy to edit and customizable templates. Deploying House Flipping Business Plan Real Estate Industry Analysis For Performance Evaluation Inspiration PDF will help you deliver an outstanding performance that everyone would remember and praise you for. Do download this presentation today.

Metric Dashboard To Measure Product Performance Product Development And Management Plan Demonstration PDF
This slide represents dashboard for tracking product success. It covers new customer, total sessions, purchase, total inquires, total crashes etc.If your project calls for a presentation, then Slidegeeks is your go to partner because we have professionally designed, easy to edit templates that are perfect for any presentation. After downloading, you can easily edit Metric Dashboard To Measure Product Performance Product Development And Management Plan Demonstration PDF and make the changes accordingly. You can rearrange slides or fill them with different images. Check out all the handy templates.

Metric Dashboard For Portfolio Performance Monitoring Strategies To Enhance Portfolio Management Information PDF
This slide represents metric dashboard for portfolio evaluation and performance monitoring. It covers project completion, top project risk, portfolio completion etc.Want to ace your presentation in front of a live audience Our Metric Dashboard For Portfolio Performance Monitoring Strategies To Enhance Portfolio Management Information PDF can help you do that by engaging all the users towards you.. Slidegeeks experts have put their efforts and expertise into creating these impeccable powerpoint presentations so that you can communicate your ideas clearly. Moreover, all the templates are customizable, and easy-to-edit and downloadable. Use these for both personal and commercial use.
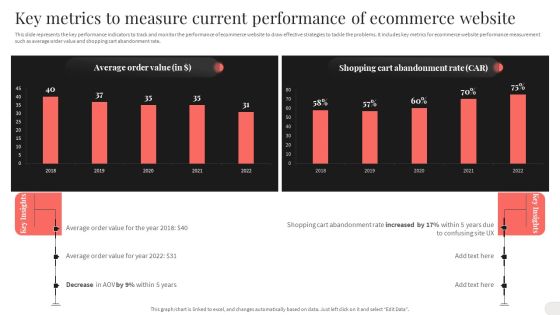
Key Metrics To Measure Current Performance Of Ecommerce Website Structure PDF
This slide represents the key performance indicators to track and monitor the performance of ecommerce website to draw effective strategies to tackle the problems. It includes key metrics for ecommerce website performance measurement such as average order value and shopping cart abandonment rate. There are so many reasons you need a Key Metrics To Measure Current Performance Of Ecommerce Website Structure PDF. The first reason is you can not spend time making everything from scratch, Thus, Slidegeeks has made presentation templates for you too. You can easily download these templates from our website easily.
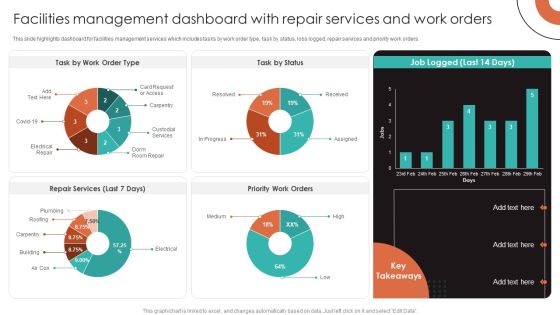
Facilities Management Dashboard With Repair Services And Work Orders Background PDF
This slide highlights dashboard for facilities management services which includes tasks by work order type, task by status, lobs logged, repair services and priority work orders. Take your projects to the next level with our ultimate collection of Facilities Management Dashboard With Repair Services And Work Orders Background PDF. Slidegeeks has designed a range of layouts that are perfect for representing task or activity duration, keeping track of all your deadlines at a glance. Tailor these designs to your exact needs and give them a truly corporate look with your own brand colors they will make your projects stand out from the rest.

Nielsen Business Profile Revenue Growth Trend In Q4 And Fy21 Ppt PowerPoint Presentation File Show PDF
This slide highlights the Nielsen company organic currency and organic constant currency growth trend. It also includes the full year revenue growth for measurement and content. Take your projects to the next level with our ultimate collection of Nielsen Business ProfiNielsen Business Profile Revenue Growth Trend In Q4 And Fy21 Ppt PowerPoint Presentation File Show PDF. Slidegeeks has designed a range of layouts that are perfect for representing task or activity duration, keeping track of all your deadlines at a glance. Tailor these designs to your exact needs and give them a truly corporate look with your own brand colors they will make your projects stand out from the rest.
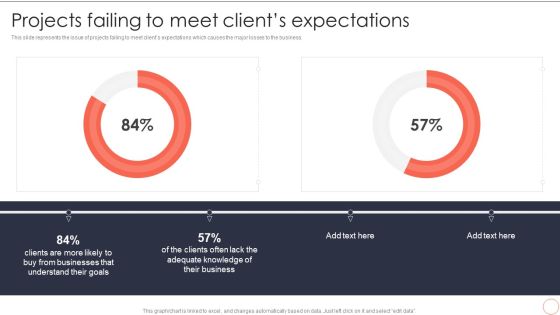
Projects Failing To Meet Clients Expectations Dynamic System Development Model Professional PDF
This slide represents the issue of projects failing to meet clients expectations which causes the major losses to the business.Make sure to capture your audiences attention in your business displays with our gratis customizable Projects Failing To Meet Clients Expectations Dynamic System Development Model Professional PDF. These are great for business strategies, office conferences, capital raising or task suggestions. If you desire to acquire more customers for your tech business and ensure they stay satisfied, create your own sales presentation with these plain slides.
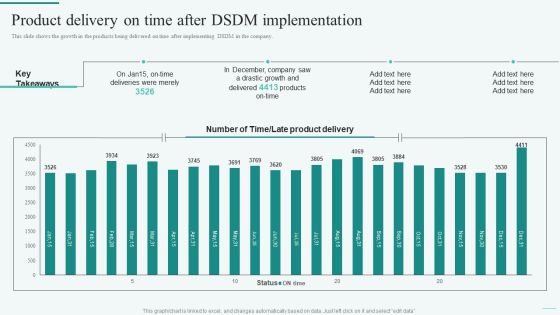
Product Delivery On Time After DSDM Implementation Integration Of Dynamic System To Enhance Processes Mockup PDF
This slide shows the growth in the products being delivered on time after implementing DSDM in the company.Take your projects to the next level with our ultimate collection of Product Delivery On Time After DSDM Implementation Integration Of Dynamic System To Enhance Processes Mockup PDF. Slidegeeks has designed a range of layouts that are perfect for representing task or activity duration, keeping track of all your deadlines at a glance. Tailor these designs to your exact needs and give them a truly corporate look with your own brand colors they all make your projects stand out from the rest.
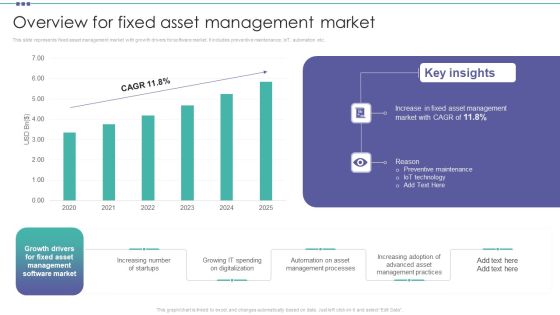
Overview For Fixed Asset Management Market Organization Physical Assets Portrait PDF
This slide represents fixed asset management market with growth drivers for software market. It includes preventive maintenance, IoT, automation etc.This Overview For Fixed Asset Management Market Organization Physical Assets Portrait PDF from Slidegeeks makes it easy to present information on your topic with precision. It provides customization options, so you can make changes to the colors, design, graphics, or any other component to create a unique layout. It is also available for immediate download, so you can begin using it right away. Slidegeeks has done good research to ensure that you have everything you need to make your presentation stand out. Make a name out there for a brilliant performance.

Expanding Target Audience With Cultural Branding Revenue And Net Profit Trend For Brand Clipart PDF
This slide represents revenue and net profit for five years for the company. It showcase increase in revenue due to product recognition in market and gaining competitive edge in market. Want to ace your presentation in front of a live audience Our Expanding Target Audience With Cultural Branding Revenue And Net Profit Trend For Brand Clipart PDF can help you do that by engaging all the users towards you.. Slidegeeks experts have put their efforts and expertise into creating these impeccable powerpoint presentations so that you can communicate your ideas clearly. Moreover, all the templates are customizable, and easy-to-edit and downloadable. Use these for both personal and commercial use.
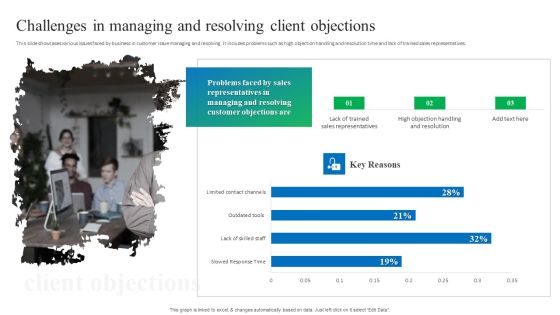
Process Enhancement Plan To Boost Sales Performance Challenges In Managing And Resolving Client Objections Themes PDF
This slide showcases various issues faced by business in customer issue managing and resolving. It includes problems such as high objection handling and resolution time and lack of trained sales representatives. Find a pre designed and impeccable Process Enhancement Plan To Boost Sales Performance Challenges In Managing And Resolving Client Objections Themes PDF. The templates can ace your presentation without additional effort. You can download these easy to edit presentation templates to make your presentation stand out from others. So, what are you waiting for Download the template from Slidegeeks today and give a unique touch to your presentation.

Strategic Promotion Guide To Boost Customer Brand Awareness Leveraging Social Media Hashtags For Brand Awareness Diagrams PDF
Do you have to make sure that everyone on your team knows about any specific topic I yes, then you should give Strategic Promotion Guide To Boost Customer Brand Awareness Leveraging Social Media Hashtags For Brand Awareness Diagrams PDF a try. Our experts have put a lot of knowledge and effort into creating this impeccable Strategic Promotion Guide To Boost Customer Brand Awareness Leveraging Social Media Hashtags For Brand Awareness Diagrams PDF. You can use this template for your upcoming presentations, as the slides are perfect to represent even the tiniest detail. You can download these templates from the Slidegeeks website and these are easy to edit. So grab these today.

Guide To Mergers And Acquisitions Post Merger And Acquisition Performance Gap Assessment Template PDF
Following slide shows the comparison of current versus target capabilities of the firm post merger and acquisition. It includes information about the companys score as well as a performance rating. Take your projects to the next level with our ultimate collection of Guide To Mergers And Acquisitions Post Merger And Acquisition Performance Gap Assessment Template PDF. Slidegeeks has designed a range of layouts that are perfect for representing task or activity duration, keeping track of all your deadlines at a glance. Tailor these designs to your exact needs and give them a truly corporate look with your own brand colors they will make your projects stand out from the rest.

Promotion Strategies For New Service Launch Global Market Sizing For New Service Infographics PDF
This slide showcases market sizing that can help organization to estimate the profit and revenue potential before launching new service. Its key components are market size, estimated growth and target market. Take your projects to the next level with our ultimate collection of Promotion Strategies For New Service Launch Global Market Sizing For New Service Infographics PDF. Slidegeeks has designed a range of layouts that are perfect for representing task or activity duration, keeping track of all your deadlines at a glance. Tailor these designs to your exact needs and give them a truly corporate look with your own brand colors they will make your projects stand out from the rest.

Adopting Flexible Work Policy Area Chart Ppt PowerPoint Presentation File Slideshow PDF
Do you have to make sure that everyone on your team knows about any specific topic I yes, then you should give Adopting Flexible Work Policy Area Chart Ppt PowerPoint Presentation File Slideshow PDF a try. Our experts have put a lot of knowledge and effort into creating this impeccable Adopting Flexible Work Policy Area Chart Ppt PowerPoint Presentation File Slideshow PDF. You can use this template for your upcoming presentations, as the slides are perfect to represent even the tiniest detail. You can download these templates from the Slidegeeks website and these are easy to edit. So grab these today.

Challenges For Blockchain Technology In Supply Chain Management Demonstration PDF
This slide represents a graph showing the challenges faced by blockchain in areas of supply chain that are visibility, risk allocation, sourcing, fluctuating consumer demand, keeping pace with technology manufacturing, inventory and data management. Showcasing this set of slides titled Challenges For Blockchain Technology In Supply Chain Management Demonstration PDF. The topics addressed in these templates are Inventory Management Challenges, Supply Chain Complexity. All the content presented in this PPT design is completely editable. Download it and make adjustments in color, background, font etc. as per your unique business setting.
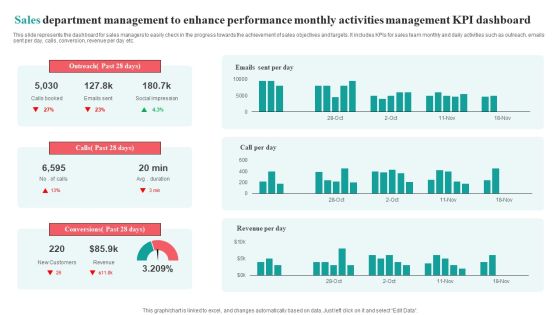
Sales Department Management To Enhance Performance Monthly Activities Management KPI Dashboard Brochure PDF
This slide represents the dashboard for sales managers to easily check in the progress towards the achievement of sales objectives and targets. It includes KPIs for sales team monthly and daily activities such as outreach, emails sent per day, calls, conversion, revenue per day etc.Pitch your topic with ease and precision using this Sales Department Management To Enhance Performance Monthly Activities Management KPI Dashboard Brochure PDF. This layout presents information on Social Impression, Conversions Past, Outreach Past. It is also available for immediate download and adjustment. So, changes can be made in the color, design, graphics or any other component to create a unique layout.

Web Interface Development Services Company Summary Revenue And Net Profit Analysis Slides PDF
This slide focuses on financial highlights of Web design company which represents revenue and net profit for last five years from 2019 to 2023. The Web Interface Development Services Company Summary Revenue And Net Profit Analysis Slides PDF is a compilation of the most recent design trends as a series of slides. It is suitable for any subject or industry presentation, containing attractive visuals and photo spots for businesses to clearly express their messages. This template contains a variety of slides for the user to input data, such as structures to contrast two elements, bullet points, and slides for written information. Slidegeeks is prepared to create an impression.
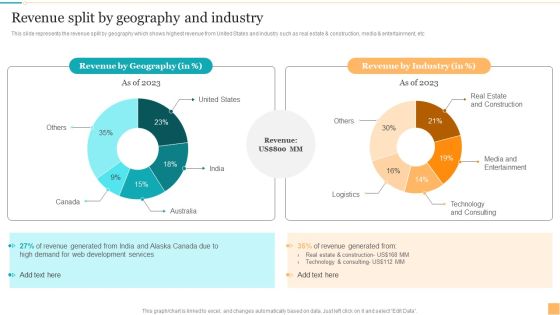
Website Design And Branding Studio Company Profile Revenue Split By Geography And Industry Guidelines PDF
This slide represents the revenue split by geography which shows highest revenue from United States and industry such as real estate and construction, media and entertainment, etc. The Website Design And Branding Studio Company Profile Revenue Split By Geography And Industry Guidelines PDF is a compilation of the most recent design trends as a series of slides. It is suitable for any subject or industry presentation, containing attractive visuals and photo spots for businesses to clearly express their messages. This template contains a variety of slides for the user to input data, such as structures to contrast two elements, bullet points, and slides for written information. Slidegeeks is prepared to create an impression.

Effect Of Conflict Resolution On The Organization Functioning Pictures PDF
The following slide showcases graph representing the effects of conflict management on the organization. Key effects included are reduction in turnover, absenteeism, defects and increase in productivity, sales, profitability and customer satisfaction. Showcasing this set of slides titled Effect Of Conflict Resolution On The Organization Functioning Topics PDF. The topics addressed in these templates areEffect Of Conflict Resolution On The Organization Functioning Pictures PDF. All the content presented in this PPT design is completely editable. Download it and make adjustments in color, background, font etc. as per your unique business setting.
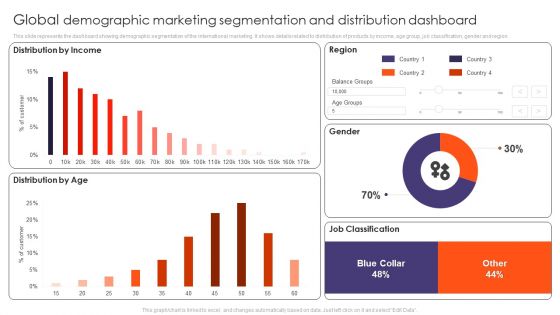
Global Demographic Marketing Segmentation And Distribution Dashboard Ppt Gallery Tips PDF
This slide represents the dashboard showing demographic segmentation of the international marketing. It shows details related to distribution of products by income, age group, job classification, gender and region. Pitch your topic with ease and precision using this Global Demographic Marketing Segmentation And Distribution Dashboard Ppt Gallery Tips PDF. This layout presents information on Distribution Income, Distribution Age, Region, Gender, Job Classification. It is also available for immediate download and adjustment. So, changes can be made in the color, design, graphics or any other component to create a unique layout.

Global Products Customer Segmentation Dashboard With Descriptions Ppt Styles Template PDF
This slide represents a dashboard showing the customer segmentation for an international product. It shows details related to total customers in each segments, segments description, characteristics and search customers by ID. Showcasing this set of slides titled Global Products Customer Segmentation Dashboard With Descriptions Ppt Styles Template PDF. The topics addressed in these templates are Total Customer, Each Segments, Segments Description, Search Customers. All the content presented in this PPT design is completely editable. Download it and make adjustments in color, background, font etc. as per your unique business setting.

Dashboard Showing Monitoring Campaign Of Marketing Ppt Infographics PDF
This slide represents dashboard showcasing campaign report. It includes recipients, email clients, open rate, spam complaints etc that enable organization in analyzing progress of marketing campaign to develop more effective strategies. Showcasing this set of slides titled Dashboard Showing Monitoring Campaign Of Marketing Ppt Infographics PDF. The topics addressed in these templates are Recipients, Open Rate, Spam Complaints, Shares. All the content presented in this PPT design is completely editable. Download it and make adjustments in color, background, font etc. as per your unique business setting.

Marketing Performance Dashboard With Analytics Campaign Ppt Infographics Background Images PDF
This slide represents dashboard for campaign performance analytics report. It covers total clicks, CTR, impressions , view-through conversions , total conversion, lead generation, activity per click etc to track campaign progress. Showcasing this set of slides titled Marketing Performance Dashboard With Analytics Campaign Ppt Infographics Background Images PDF. The topics addressed in these templates are Total Clicks, Total Impressions, Total Conversions, Activity Per Click. All the content presented in this PPT design is completely editable. Download it and make adjustments in color, background, font etc. as per your unique business setting.
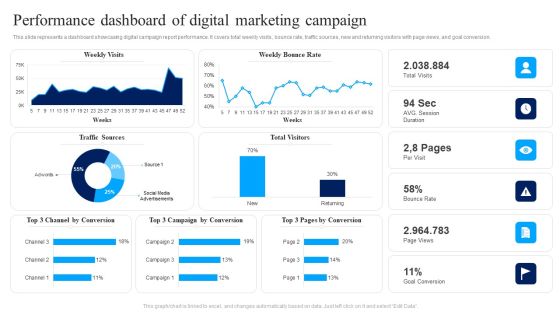
Performance Dashboard Of Digital Marketing Campaign Ppt Show Slide PDF
This slide represents a dashboard showcasing digital campaign report performance. It covers total weekly visits, bounce rate, traffic sources, new and returning visitors with page views, and goal conversion. Pitch your topic with ease and precision using this Performance Dashboard Of Digital Marketing Campaign Ppt Show Slide PDF. This layout presents information on Weekly Visits, Weekly Bounce Rate, Bounce Rate. It is also available for immediate download and adjustment. So, changes can be made in the color, design, graphics or any other component to create a unique layout.

Financial Dashboard For Organization Scenario Analysis Ppt Show Ideas PDF
This slide represents the key financial performance indicators of a business to analyze and plan its scenario. It includes KPIs such as cash conversion cycle, working capital and current ratio. Showcasing this set of slides titled Financial Dashboard For Organization Scenario Analysis Ppt Show Ideas PDF. The topics addressed in these templates are Current Working Capital, Current Liabilities, Current Assets. All the content presented in this PPT design is completely editable. Download it and make adjustments in color, background, font etc. as per your unique business setting.
 Home
Home