AI PPT Maker
Templates
PPT Bundles
Design Services
Business PPTs
Business Plan
Management
Strategy
Introduction PPT
Roadmap
Self Introduction
Timelines
Process
Marketing
Agenda
Technology
Medical
Startup Business Plan
Cyber Security
Dashboards
SWOT
Proposals
Education
Pitch Deck
Digital Marketing
KPIs
Project Management
Product Management
Artificial Intelligence
Target Market
Communication
Supply Chain
Google Slides
Research Services
 One Pagers
All Categories
-
Home
- Customer Favorites
- Bank Icon
Bank Icon

Doughnut Graph Depicting Time Spent On Multiple Project Activities Microsoft PDF
This graph or chart is linked to excel, and changes automatically based on data. Just left click on it and select Edit Data. Showcasing this set of slides titled Doughnut Graph Depicting Time Spent On Multiple Project Activities Microsoft PDF. The topics addressed in these templates are Website Development, IT Incident Management, Portfolio Management. All the content presented in this PPT design is completely editable. Download it and make adjustments in color, background, font etc. as per your unique business setting.
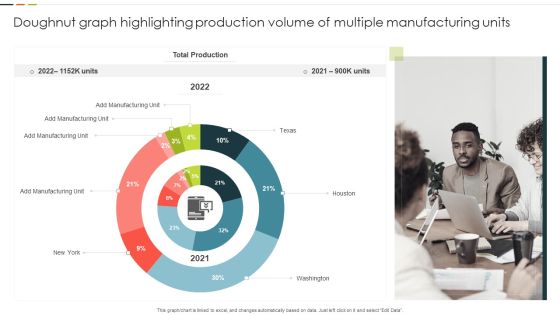
Doughnut Graph Highlighting Production Volume Of Multiple Manufacturing Units Guidelines PDF
This graph or chart is linked to excel, and changes automatically based on data. Just left click on it and select Edit Data. Showcasing this set of slides titled Doughnut Graph Highlighting Production Volume Of Multiple Manufacturing Units Guidelines PDF. The topics addressed in these templates are Total Production, Manufacturing Unit, Washington. All the content presented in this PPT design is completely editable. Download it and make adjustments in color, background, font etc. as per your unique business setting.

Doughnut Graph With Multiple Construction Project Detail Structure PDF
This graph or chart is linked to excel, and changes automatically based on data. Just left click on it and select Edit Data. Showcasing this set of slides titled Doughnut Graph With Multiple Construction Project Detail Structure PDF. The topics addressed in these templates are Corporate Buildings, Residential Houses, Commercial Buildings. All the content presented in this PPT design is completely editable. Download it and make adjustments in color, background, font etc. as per your unique business setting.

Doughnut Graph With Online Employee Recruitment Via Multiple Portals Mockup PDF
This graph or chart is linked to excel, and changes automatically based on data. Just left click on it and select Edit Data. Pitch your topic with ease and precision using this Doughnut Graph With Online Employee Recruitment Via Multiple Portals Mockup PDF. This layout presents information on ABC Employment, Multiple Portals, 2020 To 2022. It is also available for immediate download and adjustment. So, changes can be made in the color, design, graphics or any other component to create a unique layout.

Doughnut Graph With Skills Criteria For Job Application Designs PDF
This graph or chart is linked to excel, and changes automatically based on data. Just left click on it and select Edit Data. Showcasing this set of slides titled Doughnut Graph With Skills Criteria For Job Application Designs PDF. The topics addressed in these templates are Accounting Skills, Leadership Skills, Coding Skills. All the content presented in this PPT design is completely editable. Download it and make adjustments in color, background, font etc. as per your unique business setting.
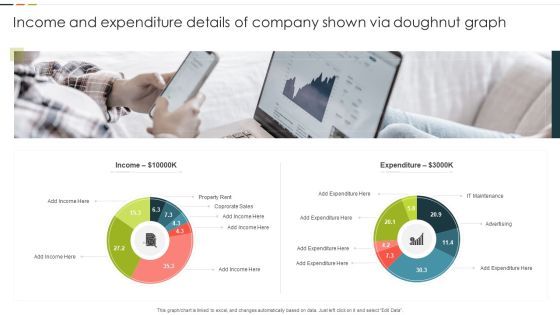
Income And Expenditure Details Of Company Shown Via Doughnut Graph Graphics PDF
This graph or chart is linked to excel, and changes automatically based on data. Just left click on it and select Edit Data. Pitch your topic with ease and precision using this Income And Expenditure Details Of Company Shown Via Doughnut Graph Graphics PDF. This layout presents information on Property Rent, Corporate Sales, Expenditure. It is also available for immediate download and adjustment. So, changes can be made in the color, design, graphics or any other component to create a unique layout.

Kanban Structure For Monitor Weekly Issues Resolving Progress Ppt Professional Outline PDF
This graph or chart is linked to excel, and changes automatically based on data. Just left click on it and select Edit Data. Showcasing this set of slides titled Kanban Structure For Monitor Weekly Issues Resolving Progress Ppt Professional Outline PDF. The topics addressed in these templates are Issues Resolved, Progress To Resolved, Issues To Resolved. All the content presented in this PPT design is completely editable. Download it and make adjustments in color, background, font etc. as per your unique business setting.

Kanban Structure For Product Quality Assurance Ppt Portfolio Deck PDF
This graph or chart is linked to excel, and changes automatically based on data. Just left click on it and select Edit Data. Pitch your topic with ease and precision using this Kanban Structure For Product Quality Assurance Ppt Portfolio Deck PDF. This layout presents information on Product Deployment, Quality Assurance, Product, Designing And Development. It is also available for immediate download and adjustment. So, changes can be made in the color, design, graphics or any other component to create a unique layout.

Kanban Structure For Task Management Ppt Summary Information PDF
This graph or chart is linked to excel, and changes automatically based on data. Just left click on it and select Edit Data. Showcasing this set of slides titled Kanban Structure For Task Management Ppt Summary Information PDF. The topics addressed in these templates are Backlog, In Progress, New Epic Added. All the content presented in this PPT design is completely editable. Download it and make adjustments in color, background, font etc. as per your unique business setting.
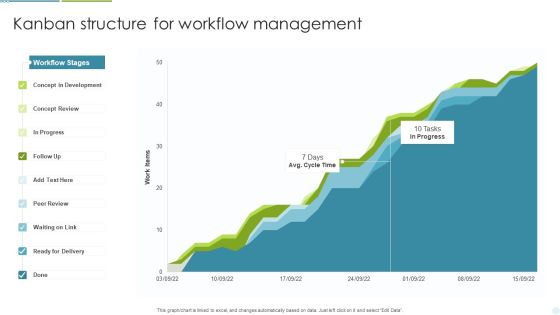
Kanban Structure For Workflow Management Ppt Inspiration Template PDF
This graph or chart is linked to excel, and changes automatically based on data. Just left click on it and select Edit Data. Pitch your topic with ease and precision using this Kanban Structure For Workflow Management Ppt Inspiration Template PDF. This layout presents information on Concept Development, Concept Review, Ready For Delivery. It is also available for immediate download and adjustment. So, changes can be made in the color, design, graphics or any other component to create a unique layout.
Kanban Structure For Yearly Project Progress Tracking Ppt File Example Introduction PDF
This graph or chart is linked to excel, and changes automatically based on data. Just left click on it and select Edit Data. Showcasing this set of slides titled Kanban Structure For Yearly Project Progress Tracking Ppt File Example Introduction PDF. The topics addressed in these templates are Number Projects, Backlog Approved, Final Review. All the content presented in this PPT design is completely editable. Download it and make adjustments in color, background, font etc. as per your unique business setting.

Kanban Structure To Manage Weekly Work Activities Ppt Professional Aids PDF
This graph or chart is linked to excel, and changes automatically based on data. Just left click on it and select Edit Data. Pitch your topic with ease and precision using this Kanban Structure To Manage Weekly Work Activities Ppt Professional Aids PDF. This layout presents information on Legend, Ready To Start, In Progress. It is also available for immediate download and adjustment. So, changes can be made in the color, design, graphics or any other component to create a unique layout.

Kanban Structure With Process Lead Time Ppt Gallery Template PDF
This graph or chart is linked to excel, and changes automatically based on data. Just left click on it and select Edit Data. Showcasing this set of slides titled Kanban Structure With Process Lead Time Ppt Gallery Template PDF. The topics addressed in these templates are Lead Time, In Realization, Requirements. All the content presented in this PPT design is completely editable. Download it and make adjustments in color, background, font etc. as per your unique business setting.

Human Capital Metrics For New Hire Ppt Pictures Brochure PDF
This graph or chart is linked to excel, and changes automatically based on data. Just left click on it and select Edit Data. Pitch your topic with ease and precision using this Human Capital Metrics For New Hire Ppt Pictures Brochure PDF. This layout presents information on Active Employee Count, New Hire Count, New Hire. It is also available for immediate download and adjustment. So, changes can be made in the color, design, graphics or any other component to create a unique layout.

Human Capital Metrics For Proper Management Ppt Show Inspiration PDF
This graph or chart is linked to excel, and changes automatically based on data. Just left click on it and select Edit Data. Showcasing this set of slides titled Human Capital Metrics For Proper Management Ppt Show Inspiration PDF. The topics addressed in these templates are Candidates Per Position, Hired Per Source, Location. All the content presented in this PPT design is completely editable. Download it and make adjustments in color, background, font etc. as per your unique business setting.

Human Capital Metrics With Absenteeism Rate Ppt Infographic Template Ideas PDF
This graph or chart is linked to excel, and changes automatically based on data. Just left click on it and select Edit Data. Pitch your topic with ease and precision using this Human Capital Metrics With Absenteeism Rate Ppt Infographic Template Ideas PDF. This layout presents information on Overall Labor Effectiveness, OLE Department, Absenteeism. It is also available for immediate download and adjustment. So, changes can be made in the color, design, graphics or any other component to create a unique layout.
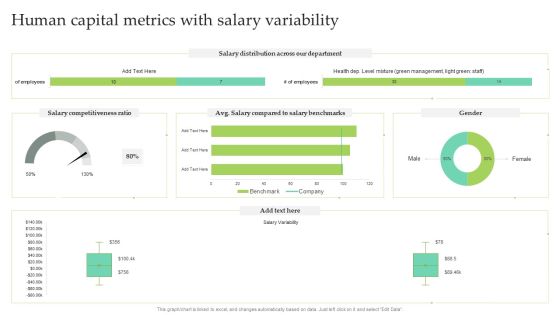
Human Capital Metrics With Salary Variability Ppt Infographic Template Designs PDF
This graph or chart is linked to excel, and changes automatically based on data. Just left click on it and select Edit Data. Pitch your topic with ease and precision using this Human Capital Metrics With Salary Variability Ppt Infographic Template Designs PDF. This layout presents information on Salary Distribution, Salary Competitiveness Ratio, Male. It is also available for immediate download and adjustment. So, changes can be made in the color, design, graphics or any other component to create a unique layout.
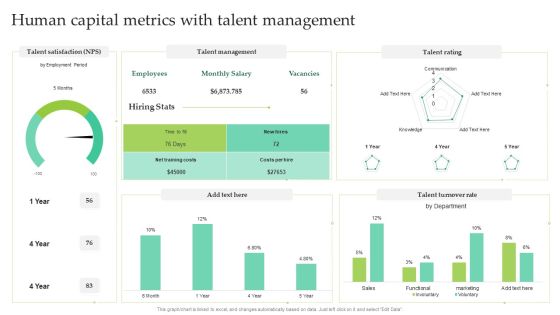
Human Capital Metrics With Talent Management Ppt Layouts Mockup PDF
This graph or chart is linked to excel, and changes automatically based on data. Just left click on it and select Edit Data. Showcasing this set of slides titled Human Capital Metrics With Talent Management Ppt Layouts Mockup PDF. The topics addressed in these templates are Talent Management, Talent Rating, Talent Turnover Rate. All the content presented in this PPT design is completely editable. Download it and make adjustments in color, background, font etc. as per your unique business setting.
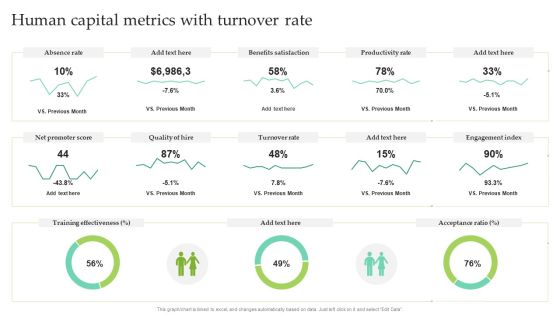
Human Capital Metrics With Turnover Rate Ppt Pictures Outline PDF
This graph or chart is linked to excel, and changes automatically based on data. Just left click on it and select Edit Data. Pitch your topic with ease and precision using this Human Capital Metrics With Turnover Rate Ppt Pictures Outline PDF. This layout presents information on Absence Rate, Benefits Satisfaction, Productivity Rate. It is also available for immediate download and adjustment. So, changes can be made in the color, design, graphics or any other component to create a unique layout.

Sales Funnel And Leads Performance Monitoring Sheet Ppt Professional Tips PDF
This slide illustrates leads tracking and sales funnel sheet. It provides details such as company, name, status, next action, price, taxes, discounts, total, etc. Showcasing this set of slides titled Sales Funnel And Leads Performance Monitoring Sheet Ppt Professional Tips PDF. The topics addressed in these templates are Sales Funnel Chart, Salesperson, Next Action. All the content presented in this PPT design is completely editable. Download it and make adjustments in color, background, font etc. as per your unique business setting.

Dashboard Depicting Security Problem Management Metrics Ppt Gallery Designs PDF
This graph or chart is linked to excel, and changes automatically based on data. Just left click on it and select Edit Data. Showcasing this set of slides titled Dashboard Depicting Security Problem Management Metrics Ppt Gallery Designs PDF. The topics addressed in these templates are Percentage, New Critical, Security Incidents. All the content presented in this PPT design is completely editable. Download it and make adjustments in color, background, font etc. as per your unique business setting.

Carbon Emission Rate Percentage Stacked Bar Graph Rules PDF
This slide shows emission rate percentage chart comparison of continents to determine lowest emission releasing continents. It includes continents and emission percentage Showcasing this set of slides titled Carbon Emission Rate Percentage Stacked Bar Graph Rules PDF. The topics addressed in these templates are Carbon Emission, Increase In Industrialization, New Manufacturing. All the content presented in this PPT design is completely editable. Download it and make adjustments in color, background, font etc. as per your unique business setting.

Carbon Emissions Of Countries Bar Graph Professional PDF
This slide depicts emissions chart of various countries to avoid the worst impacts of climate change. It includes countries and carbon emissions in million metric tons. Pitch your topic with ease and precision using this Carbon Emissions Of Countries Bar Graph Professional PDF. This layout presents information on Maximum Production, Consumer Goods, Carbon Emissions. It is also available for immediate download and adjustment. So, changes can be made in the color, design, graphics or any other component to create a unique layout.

Global Electric Cars Sales Bar Graph Graphics PDF
This slide shows usage chart of electric cars world over to access present sales and future of EV. It includes years and number of electric cars sales. Showcasing this set of slides titled Global Electric Cars Sales Bar Graph Graphics PDF. The topics addressed in these templates are Electric Vehicle Sales, Electric Cars Purchased, Underdeveloped Technology. All the content presented in this PPT design is completely editable. Download it and make adjustments in color, background, font etc. as per your unique business setting.

Manufacturing Productivity Analysis Bar Graph Introduction PDF
This slide illustrates the productivity chart of manufacturing of a company. It includes quantity produced in million units against the time period. Pitch your topic with ease and precision using this Manufacturing Productivity Analysis Bar Graph Introduction PDF. This layout presents information on Manufacturing Productivity, Production Decreased, Closure Of Companies. It is also available for immediate download and adjustment. So, changes can be made in the color, design, graphics or any other component to create a unique layout.
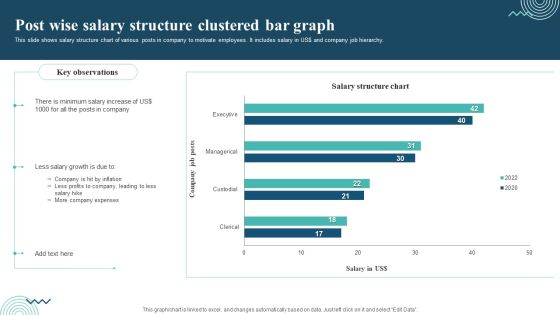
Post Wise Salary Structure Clustered Bar Graph Professional PDF
This slide shows salary structure chart of various posts in company to motivate employees. It includes salary in US dollar and company job hierarchy. Showcasing this set of slides titled Post Wise Salary Structure Clustered Bar Graph Professional PDF. The topics addressed in these templates are Minimum Salary Increase, Less Salary Growth, Company Expenses. All the content presented in this PPT design is completely editable. Download it and make adjustments in color, background, font etc. as per your unique business setting.
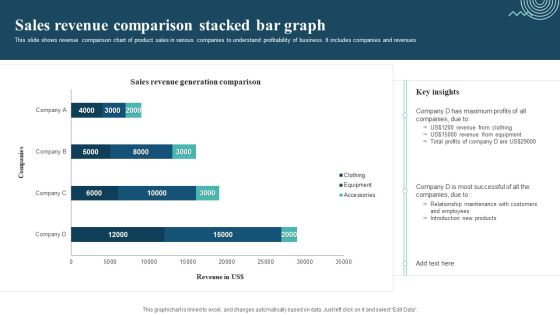
Sales Revenue Comparison Stacked Bar Graph Mockup PDF
This slide shows revenue comparison chart of product sales in various companies to understand profitability of business. It includes companies and revenues. Showcasing this set of slides titled Sales Revenue Comparison Stacked Bar Graph Mockup PDF. The topics addressed in these templates are Sales Revenue Comparison, Revenue From Clothing, Revenue From Equipment. All the content presented in this PPT design is completely editable. Download it and make adjustments in color, background, font etc. as per your unique business setting.

Annual Customer Sales Performance Comparison Graph Portrait PDF
This slide shows the annual sales comparison chart. It also includes total and monthly sales target. Pitch your topic with ease and precision using this Annual Customer Sales Performance Comparison Graph Portrait PDF. This layout presents information on Total Sales Target, Sales Target, Achievement. It is also available for immediate download and adjustment. So, changes can be made in the color, design, graphics or any other component to create a unique layout.

Target Market Assessment Process Roadmap Demonstration PDF
This slide represents the Gantt chart for target market analysis. It includes tasks such as conducting market research, identifying demographics, developing buyer persona, developing business strategy, etc. Showcasing this set of slides titled Target Market Assessment Process Roadmap Demonstration PDF. The topics addressed in these templates are Develop, Target Demographics, Target Market. All the content presented in this PPT design is completely editable. Download it and make adjustments in color, background, font etc. as per your unique business setting.
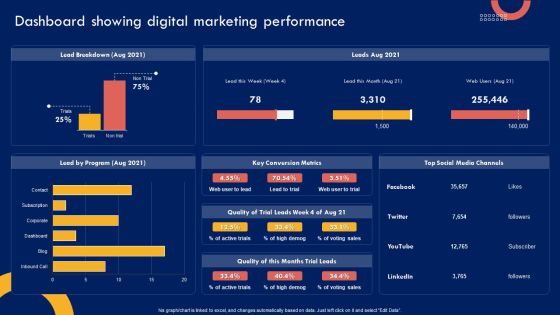
Product Marketing Leadership Dashboard Showing Digital Marketing Performance Download PDF
This graph OR chart is linked to excel, and changes automatically based on data. Just left click on it and select Edit Data. There are so many reasons you need a Product Marketing Leadership Dashboard Showing Digital Marketing Performance Download PDF. The first reason is you cant spend time making everything from scratch, Thus, Slidegeeks has made presentation templates for you too. You can easily download these templates from our website easily.

Product Marketing Leadership Product Marketing Dashboard For Pay Per Microsoft PDF
This graph or chart is linked to excel, and changes automatically based on data. Just left click on it and select Edit Data. Find a pre-designed and impeccable Product Marketing Leadership Product Marketing Dashboard For Pay Per Microsoft PDF. The templates can ace your presentation without additional effort. You can download these easy-to-edit presentation templates to make your presentation stand out from others. So, what are you waiting for Download the template from Slidegeeks today and give a unique touch to your presentation.

Annual Revenue Margin Comparison Sheet Information PDF
This slide showcases a comparison chart with monthly new customers, revenue, profits, and profit margins. It also includes the profit categorization based on set standards. Showcasing this set of slides titled Annual Revenue Margin Comparison Sheet Information PDF. The topics addressed in these templates are Customers, Revenue, Profit Margin. All the content presented in this PPT design is completely editable. Download it and make adjustments in color, background, font etc. as per your unique business setting.
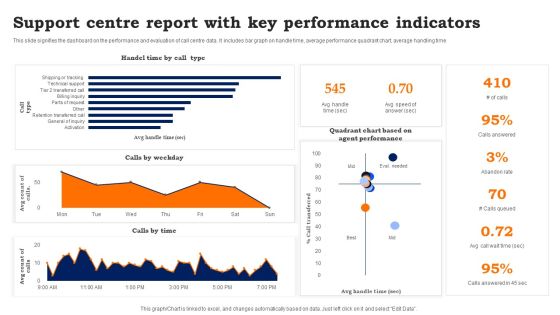
Support Centre Report With Key Performance Indicators Information PDF
This slide signifies the dashboard on the performance and evaluation of call centre data. It includes bar graph on handle time, average performance quadrant chart, average handling time. Showcasing this set of slides titled Support Centre Report With Key Performance Indicators Information PDF. The topics addressed in these templates are Support Centre Report, Key Performance Indicators. All the content presented in this PPT design is completely editable. Download it and make adjustments in color, background, font etc. as per your unique business setting.
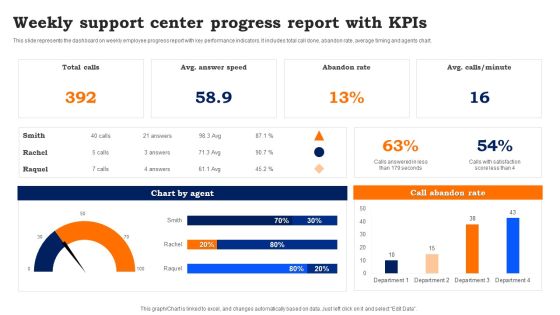
Weekly Support Center Progress Report With Kpis Template PDF
This slide represents the dashboard on weekly employee progress report with key performance indicators. It includes total call done, abandon rate, average timing and agents chart. Pitch your topic with ease and precision using this Weekly Support Center Progress Report With Kpis Template PDF. This layout presents information on Weekly Support, Center Progress Report. It is also available for immediate download and adjustment. So, changes can be made in the color, design, graphics or any other component to create a unique layout.

Prevention Of Information Major Statistics Of Cyber Security Awareness Pictures PDF
This graph or chart is linked to excel, and changes automatically based on data. Just left click on it and select Edit Data. There are so many reasons you need a Prevention Of Information Major Statistics Of Cyber Security Awareness Pictures PDF. The first reason is you cant spend time making everything from scratch, Thus, Slidegeeks has made presentation templates for you too. You can easily download these templates from our website easily.

Inventories By Segment 2016 And 2021 Global Food Products Company Profile Summary PDF
This slide highlights the inventories for 2016 and 2021 through pie chart format. It includes retail products, potash, nitrogen, and phosphateFind a pre-designed and impeccable Inventories By Segment 2016 And 2021 Global Food Products Company Profile Summary PDF. The templates can ace your presentation without additional effort. You can download these easy-to-edit presentation templates to make your presentation stand out from others. So, what are you waiting for Download the template from Slidegeeks today and give a unique touch to your presentation.

Monthly Production Summary Dashboard With Overall Batch Production Portrait PDF
The slide shows the total monthly batch production by the organisation. The slide covers the dashboard with pie charts and bar graphs. Showcasing this set of slides titled Monthly Production Summary Dashboard With Overall Batch Production Portrait PDF. The topics addressed in these templates are Monthly Production Summary Dashboard, Overall Batch Production. All the content presented in this PPT design is completely editable. Download it and make adjustments in color, background, font etc. as per your unique business setting.

Agile Team Member Customer Relationship Management Dashboard With Deals Funnel Mockup PDF
This slide illustrates graphical representation of CRM sales team member data. It includes pipeline, business components and activity level, categories etc. Pitch your topic with ease and precision using this Agile Team Member Customer Relationship Management Dashboard With Deals Funnel Mockup PDF. This layout presents information on Funnel Of Deals, Sent Campaigns Emails, Sales Chart. It is also available for immediate download and adjustment. So, changes can be made in the color, design, graphics or any other component to create a unique layout.

Financial Position Evaluation Of Organization Revenue And Expenses Slides PDF
This slide shows pie chart of organizational revenue and expenses. It can be used by a firm to categorize revenue and expenses sources. Showcasing this set of slides titled Financial Position Evaluation Of Organization Revenue And Expenses Slides PDF. The topics addressed in these templates are Expenses, Revenue, Commissions, Services, Products. All the content presented in this PPT design is completely editable. Download it and make adjustments in color, background, font etc. as per your unique business setting.

Summary Of Site Survey Results Survey SS
Following slide shows the complete overview of survey in graphs and pie charts which assist in setting future trends. It basically shows the result of website visitors, overall website rating, etc. Showcasing this set of slides titled Summary Of Site Survey Results Survey SS. The topics addressed in these templates are Summary, Site Survey Results. All the content presented in this PPT design is completely editable. Download it and make adjustments in color, background, font etc. as per your unique business setting.

Managing Hybrid Waterfall Business Approach Project Dashboard Summary PDF
This slide illustrates agile key performance indicators for individual sprints. It includes tasks, story points, bugs, burndown charts, statistics etc. Showcasing this set of slides titled Managing Hybrid Waterfall Business Approach Project Dashboard Summary PDF. The topics addressed in these templates are Tasks, Story Points, Bugs. All the content presented in this PPT design is completely editable. Download it and make adjustments in color, background, font etc. as per your unique business setting.
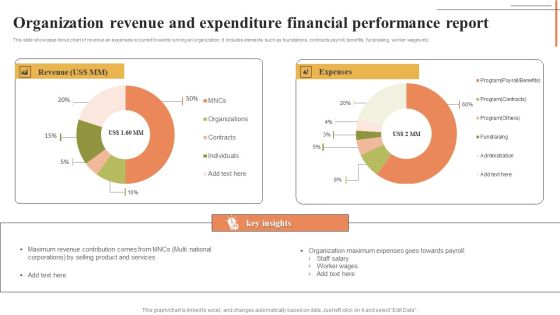
Organization Revenue And Expenditure Financial Performance Report Inspiration PDF
This slide showcase donut chart of revenue an expenses occurred towards running an organization. It includes elements such as foundations, contracts payroll, benefits, fundraising, worker wages etc. Showcasing this set of slides titled Organization Revenue And Expenditure Financial Performance Report Inspiration PDF. The topics addressed in these templates are Expenses, Revenue Worker Wages. All the content presented in this PPT design is completely editable. Download it and make adjustments in color, background, font etc. as per your unique business setting.

Security Camera System Company Profile Security Company Organization Chart Ideas PDF
This slide highlights the organization chart of home security company which includes president, finance vice president, chief legal officer and secretary, chief financial officer and chief administrative officer. Presenting Security Camera System Company Profile Security Company Organization Chart Ideas PDF to provide visual cues and insights. Share and navigate important information on four stages that need your due attention. This template can be used to pitch topics like President Finance, President And Chief, Executive Officer. In addtion, this PPT design contains high resolution images, graphics, etc, that are easily editable and available for immediate download.

Customer Trends Template 1 Ppt PowerPoint Presentation Diagrams
This is a customer trends template 1 ppt powerpoint presentation diagrams. This is a five stage process. The stages in this process are business, marketing, bar graph, finance, management.
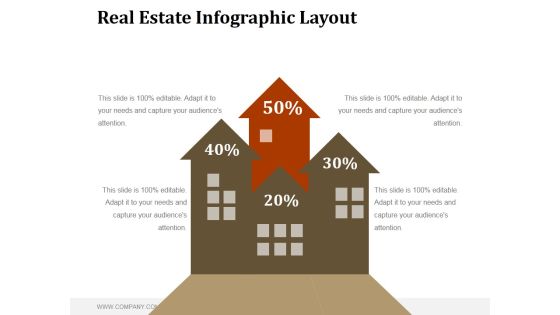
Real Estate Infographic Layout Ppt PowerPoint Presentation Diagrams
This is a real estate infographic layout ppt powerpoint presentation diagrams. This is a four stage process. The stages in this process are business, marketing, finance, sales plan, management.

Cost Performance Index Ppt PowerPoint Presentation Inspiration Graphics Example
This is a cost performance index ppt powerpoint presentation inspiration graphics example. This is a three stage process. The stages in this process are business, management, marketing, percentage, product.

break even analysis for cost control ppt powerpoint presentation summary
This is a break even analysis for cost control ppt powerpoint presentation summary. This is a four stage process. The stages in this process are break even point,break even analysis,break even level break even point,break even analysis,break even level.

Cloud Cost Management Model Components Clipart PDF
This slide shows cloud cost optimization components to make coordination between complex operations of cloud system. It include elements like orchestration, cloud network security and compliance setup etc. Presenting Cloud Cost Management Model Components Clipart PDF to dispense important information. This template comprises five stages. It also presents valuable insights into the topics including Orchestration Automation, Cloud Network Security, Compliance Governance Setup. This is a completely customizable PowerPoint theme that can be put to use immediately. So, download it and address the topic impactfully.

Commodity Bundle Costing Strategy Checklist Formats PDF
This slide presents checklist with necessary tasks to achieve best performing product bundle pricing strategy, helpful in gaining more customers and selling more products. It includes mixing less purchased items with popular ones, simple offers and personalized messages after purchase. Presenting Commodity Bundle Costing Strategy Checklist Formats PDF to dispense important information. This template comprises seven stages. It also presents valuable insights into the topics including Commodity Bundle, Costing Strategy Checklist. This is a completely customizable PowerPoint theme that can be put to use immediately. So, download it and address the topic impactfully.

Three Methods To Reducing Cost In Agriculture Business Slides PDF
This slide covers three techniques for reducing cost in agriculture sector. It involves strategies such as data management solutions, increase workflow efficiencies across farming processes and conserve existing resources.Presenting Three Methods To Reducing Cost In Agriculture Business Slides PDF to dispense important information. This template comprises three stages. It also presents valuable insights into the topics including Management Solutions, Increase Workflow, Conserve Existing This is a completely customizable PowerPoint theme that can be put to use immediately. So, download it and address the topic impactfully.

Real Estate New Home Loan Applications Ppt PowerPoint Presentation Model Themes
This is a real estate new home loan applications ppt powerpoint presentation model themes. This is a one stage process. The stages in this process are real estate, home loan, growth, finance, business.
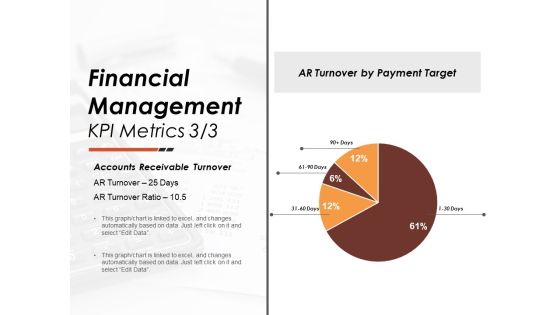
Financial Management Kpi Metrics 3 3 Ppt PowerPoint Presentation Summary Themes
This is a financial management kpi metrics 3 3 ppt powerpoint presentation summary themes. This is a four stage process. The stages in this process are finance, strategy, marketing, management, business.
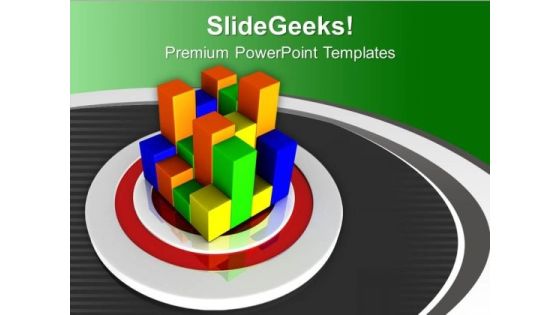
Financial Diagram Target Business PowerPoint Templates Ppt Backgrounds For Slides 0313
We present our Financial Diagram Target Business PowerPoint Templates PPT Backgrounds For Slides 0313.Present our Targets PowerPoint Templates because Our PowerPoint Templates and Slides help you pinpoint your timelines. Highlight the reasons for your deadlines with their use. Use our Business PowerPoint Templates because Our PowerPoint Templates and Slides offer you the needful to organise your thoughts. Use them to list out your views in a logical sequence. Download our Success PowerPoint Templates because you can Add colour to your speech with our PowerPoint Templates and Slides. Your presentation will leave your audience speechless. Present our Marketing PowerPoint Templates because Our PowerPoint Templates and Slides help you pinpoint your timelines. Highlight the reasons for your deadlines with their use. Download and present our Finance PowerPoint Templates because It can Bubble and burst with your ideas.Use these PowerPoint slides for presentations relating to Target with a growing chart, business, targets, marketing, success, finance. The prominent colors used in the PowerPoint template are Blue, Red, Green.

Consulting Diagram Books Stacked Marketing Diagram
Delight Them With Our Consulting Diagram Books Stacked Marketing Diagram Powerpoint Templates. Your Audience Will Be Ecstatic. Our Consulting Diagram Books Stacked Marketing Diagram Powerpoint Templates Are Created Cost Effective. They Understand The Need For Economy.

3 Diverging Aspects For Controlling Process Flows Cycle Diagram PowerPoint Templates
We present our 3 diverging aspects for controlling process flows Cycle Diagram PowerPoint templates.Download our Business PowerPoint Templates because you can Flutter your wings and enchant the world. Impress them with the innate attractiveness of your thoughts and words. Download our Shapes PowerPoint Templates because this Diagram emphasizes on any critical or key factors within them. Use our Flow Charts PowerPoint Templates because you understand the illness and its causes. Present our Arrows PowerPoint Templates because you will be able to Highlight your ideas broad-based on strong fundamentals and illustrate how they step by step acheive the set growth factor. Use our Process and Flows PowerPoint Templates because you have a clear vision of the cake you want.Use these PowerPoint slides for presentations relating to Arrow, Brochure, Business, Chart, Circle, Cyclic, Data, Diagram, Financial, Goal, Graph, Illustration, Info, Information, Investment, Manage, Marketing, Model, Option, Part, Pie, Presentation, Process, Result, Sphere, Statistics, Stock, Strategy, Template, Wheel. The prominent colors used in the PowerPoint template are Blue light, Gray, Black. People tell us our 3 diverging aspects for controlling process flows Cycle Diagram PowerPoint templates are Beautiful. Customers tell us our Chart PowerPoint templates and PPT Slides are Elegant. People tell us our 3 diverging aspects for controlling process flows Cycle Diagram PowerPoint templates are Perfect. Professionals tell us our Business PowerPoint templates and PPT Slides are Fantastic. Customers tell us our 3 diverging aspects for controlling process flows Cycle Diagram PowerPoint templates are designed by a team of presentation professionals. Use our Data PowerPoint templates and PPT Slides are Radiant.

3 Steps Colorful Arrows Parallel Process Business Plan Example Free PowerPoint Slides
We present our 3 steps colorful arrows parallel process business plan example free PowerPoint Slides.Present our Arrows PowerPoint Templates because you can Add colour to your speech with our PowerPoint Templates and Slides. Your presentation will leave your audience speechless. Present our Signs PowerPoint Templates because You can Be the star of the show with our PowerPoint Templates and Slides. Rock the stage with your ideas. Download and present our Shapes PowerPoint Templates because Our PowerPoint Templates and Slides are aesthetically designed to attract attention. We gaurantee that they will grab all the eyeballs you need. Download our Circle Charts PowerPoint Templates because you should once Tap the ingenuity of our PowerPoint Templates and Slides. They are programmed to succeed. Download and present our Business PowerPoint Templates because Our PowerPoint Templates and Slides are focused like a searchlight beam. They highlight your ideas for your target audience.Use these PowerPoint slides for presentations relating to arrow, business, chart, collaborate, colorful, colors, commerce, concept, data, development, direction, economic, forward, graph, graphics, growing, growth, illustration, improvement, interaction, lead, leadership, line, manage, management, networking, object, organization, organize, performance, race, relation, relationship, resources, results, sales, same, staff, team, together. The prominent colors used in the PowerPoint template are Orange, Green, Blue. We assure you our 3 steps colorful arrows parallel process business plan example free PowerPoint Slides will get their audience's attention. People tell us our colors PowerPoint templates and PPT Slides are the best it can get when it comes to presenting. Customers tell us our 3 steps colorful arrows parallel process business plan example free PowerPoint Slides will help you be quick off the draw. Just enter your specific text and see your points hit home. Presenters tell us our commerce PowerPoint templates and PPT Slides are designed by professionals People tell us our 3 steps colorful arrows parallel process business plan example free PowerPoint Slides will make you look like a winner. We assure you our data PowerPoint templates and PPT Slides will make the presenter successul in his career/life.

Business Growth Strategy House Framework Demonstration PDF
The following slide showcases business strategy house diagram that helps in the acquisition of assets, the recruitment of fresh people, and the funding of investments. It includes strategic direction, net growth platforms, holding value and foundation. Pitch your topic with ease and precision using this Business Growth Strategy House Framework Demonstration PDF. This layout presents information on Strategic Direction, New Growth Platforms, Innovation. It is also available for immediate download and adjustment. So, changes can be made in the color, design, graphics or any other component to create a unique layout.

Teamwork Concept Business PowerPoint Templates And PowerPoint Backgrounds 0511
Microsoft PowerPoint Template and Background with business team adding individual performance bar chart to annual financial chart

Project Health Card Scheduling And Resourcing Ppt PowerPoint Presentation Styles Tips
This is a project health card scheduling and resourcing ppt powerpoint presentation styles tips. This is a six stage process. The stages in this process are project analysis, project review, project performance management.
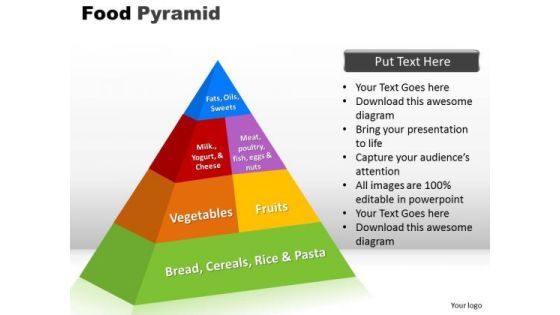
PowerPoint Slide Designs Food Pyramid Strategy Ppt Theme
PowerPoint Slide Designs Food Pyramid Strategy PPT Theme-It is a template that has a food pyramid diagram and is ideal for nutritionists or people who need to relate the slide with a presentation of food or healthy food PPT-Business, chart, color, concept, conceptual, construction, corporate, creating, data, design, diagram, direction, focus, graph, group, growth, hierarchy, illustration, information, isolated, layer, layered, level, manage, management, model, object, organization, performance, population, presentation, principal, process, progress, pyramid, rank, resource, shape, stage, structure, support, symbol, top, triangle, vector-PowerPoint Slide Designs Food Pyramid Strategy PPT Theme
