AI PPT Maker
Templates
PPT Bundles
Design Services
Business PPTs
Business Plan
Management
Strategy
Introduction PPT
Roadmap
Self Introduction
Timelines
Process
Marketing
Agenda
Technology
Medical
Startup Business Plan
Cyber Security
Dashboards
SWOT
Proposals
Education
Pitch Deck
Digital Marketing
KPIs
Project Management
Product Management
Artificial Intelligence
Target Market
Communication
Supply Chain
Google Slides
Research Services
 One Pagers
All Categories
-
Home
- Customer Favorites
- Bank Icon
Bank Icon

Transportation Company Profile Net Profit And Margin Ppt PowerPoint Presentation Summary Diagrams PDF
Deliver an awe inspiring pitch with this creative Transportation Company Profile Net Profit And Margin Ppt PowerPoint Presentation Summary Diagrams PDF bundle. Topics like Overall Profit, Increase In Crude, Profit Growth can be discussed with this completely editable template. It is available for immediate download depending on the needs and requirements of the user.

Dashboard To Track Google Cloud Monitoring Google Cloud Computing System Diagrams PDF
Deliver and pitch your topic in the best possible manner with this Dashboard To Track Google Cloud Monitoring Google Cloud Computing System Diagrams PDF. Use them to share invaluable insights on Associate Certifications, Professional Certifications, Suite Certifications and impress your audience. This template can be altered and modified as per your expectations. So, grab it now.

About Us Page Summary Of IT Company With Mission And Vision Diagrams PDF
Showcasing this set of slides titled About Us Page Summary Of IT Company With Mission And Vision Diagrams PDF. The topics addressed in these templates are Increase Productivity, Capabilities, Provide Customer. All the content presented in this PPT design is completely editable. Download it and make adjustments in color, background, font etc. as per your unique business setting.
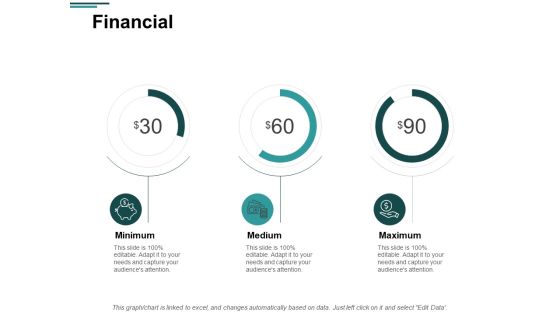
Financial Minimum Medium Ppt PowerPoint Presentation Visual Aids Infographic Template
Presenting this set of slides with name financial minimum medium ppt powerpoint presentation visual aids infographic template. This is a three stage process. The stages in this process are finance, marketing, management, investment, analysis. This is a completely editable PowerPoint presentation and is available for immediate download. Download now and impress your audience.

Percentage With Mouse Internet PowerPoint Templates And PowerPoint Themes 1112
Percentage With Mouse Internet PowerPoint Templates And PowerPoint Themes 1112-Create visually stunning and define your PPT Presentations in a unique and inspiring manner using our above template which contains a graphic of percent symbol in a cardboard box connected to a computer mouse. It imitates business, currency, finance, growth, internet, investment, sale, savings, selling, sign, symbol, tax, wealth. It is a useful captivating tool conceived to enable you to define your message in your Business PPT presentations. Deliver amazing presentations to mesmerize your audience.-Percentage With Mouse Internet PowerPoint Templates And PowerPoint Themes 1112-This PowerPoint template can be used for presentations relating to-Percentage sign connected to a computer mouse, Technology, Cables, Business, Symbol, Signs
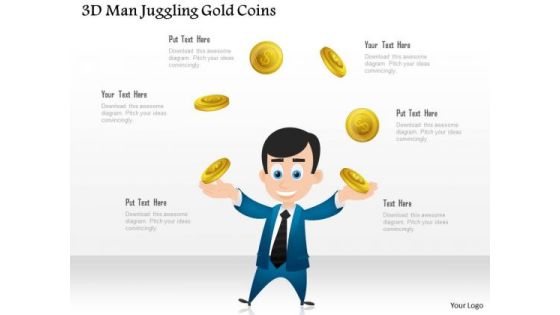
Business Diagram 3d Man Juggling Gold Coins Presentation Template
In this power point template we have displayed concept of juggling. To show this concept we have used graphic of 3d man and gold coins. Use this diagram PPT for your finance and business elated presentation.
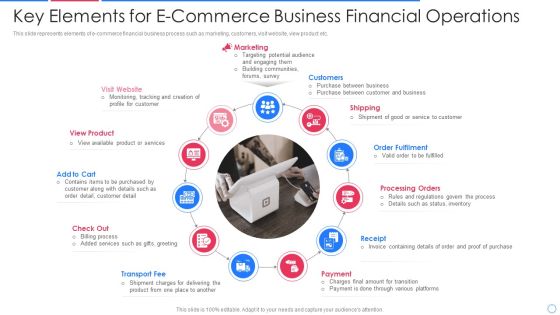
Key Elements For E Commerce Business Financial Operations Portrait PDF
This slide represents elements of e-commerce financial business process such as marketing, customers, visit website, view product etc.Presenting key elements for e commerce business financial operations portrait pdf to dispense important information. This template comprises eleven stages. It also presents valuable insights into the topics including order fulfilment, processing orders, payment, receipt, shipping This is a completely customizable PowerPoint theme that can be put to use immediately. So, download it and address the topic impactfully.

Pillars Of E Commerce Business Financial Operations Infographics PDF
This slide represents pillars of e-commerce profitability in financial process such as supply chin optimization, product selection, pricing and promotion etc.Presenting pillars of e commerce business financial operations infographics pdf to dispense important information. This template comprises four stages. It also presents valuable insights into the topics including supply chain optimization, customer acquisition and retention, it modernization and big data This is a completely customizable PowerPoint theme that can be put to use immediately. So, download it and address the topic impactfully.

Steps In E Commerce Business Financial Operations Microsoft PDF
This slide represents steps in e-commerce financial authorized process illustrating card, request, submission of request, issuer, acceptance etc.Presenting steps in e commerce business financial operations microsoft pdf to dispense important information. This template comprises eight stages. It also presents valuable insights into the topics including submission of request, acceptance, response This is a completely customizable PowerPoint theme that can be put to use immediately. So, download it and address the topic impactfully.

Business To Business E Commerce Challenges And Solutions Information PDF
This slide shows various b2b E Commerce challenges along with their solutions. These challenges are multiple sellers, shipment and cyber security. Presenting Business To Business E Commerce Challenges And Solutions Information PDF to dispense important information. This template comprises Three stages. It also presents valuable insights into the topics including Challenges, Description, Solution This is a completely customizable PowerPoint theme that can be put to use immediately. So, download it and address the topic impactfully.

Business 2 Business E Commerce Sales Funnel Summary PDF
This slide shows six stages which can be used to develop sales funnel in b2b e-commerce. It includes stages such as awareness, interest, consideration, intent, evaluation and buy. Presenting Business 2 Business E Commerce Sales Funnel Summary PDF to dispense important information. This template comprises Six stages. It also presents valuable insights into the topics including Awareness, Consideration, Evaluation. This is a completely customizable PowerPoint theme that can be put to use immediately. So, download it and address the topic impactfully.

E Commerce Launch Goals And Growth Plan Sample PDF
This slide defines the launch objectives and growth plan for e-commerce. It includes information related to strategic planning, marketing and operation. Presenting E Commerce Launch Goals And Growth Plan Sample PDF to dispense important information. This template comprises four stages. It also presents valuable insights into the topics including Strategy Planning, Marketing, Operation. This is a completely customizable PowerPoint theme that can be put to use immediately. So, download it and address the topic impactfully.

Survey Of Issues Faced By IT Employees Agile IT Methodology In Project Management Diagrams PDF
This slide covers a graph that depicts the problems what IT employees are facing in organisation while choosing software development methods by conducting a survey also showing key takeaways for the same.Get a simple yet stunning designed Survey Of Issues Faced By IT Employees Agile IT Methodology In Project Management Diagrams PDF. It is the best one to establish the tone in your meetings. It is an excellent way to make your presentations highly effective. So, download this PPT today from Slidegeeks and see the positive impacts. Our easy-to-edit Survey Of Issues Faced By IT Employees Agile IT Methodology In Project Management Diagrams PDF can be your go-to option for all upcoming conferences and meetings. So, what are you waiting for Grab this template today.
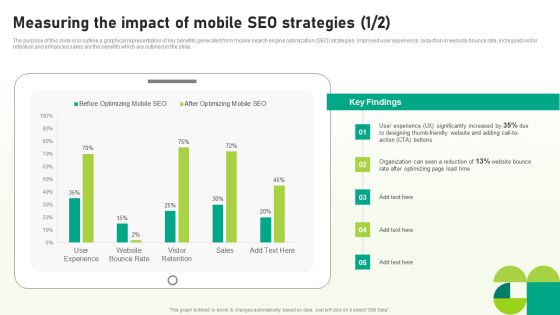
Utilizing SEO To Boost Customer Measuring The Impact Of Mobile SEO Strategies Diagrams PDF
The purpose of this slide is to outline a graphical representation of key benefits generated from mobile search engine optimization SEO strategies. Improved user experience, reduction in website bounce rate, increased visitor retention and enhanced sales are the benefits which are outlined in the slide. Explore a selection of the finest Utilizing SEO To Boost Customer Measuring The Impact Of Mobile SEO Strategies Diagrams PDF here. With a plethora of professionally designed and pre-made slide templates, you can quickly and easily find the right one for your upcoming presentation. You can use our Utilizing SEO To Boost Customer Measuring The Impact Of Mobile SEO Strategies Diagrams PDF to effectively convey your message to a wider audience. Slidegeeks has done a lot of research before preparing these presentation templates. The content can be personalized and the slides are highly editable. Grab templates today from Slidegeeks.
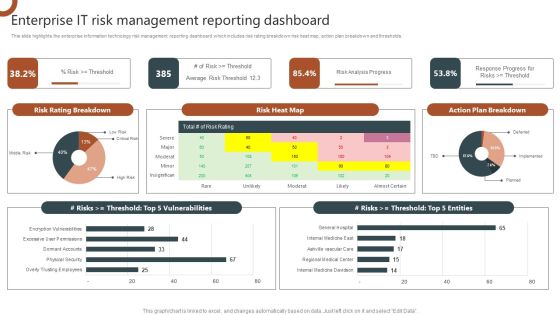
Organizations Risk Management And IT Security Enterprise IT Risk Management Reporting Dashboard Diagrams PDF
This slide highlights the enterprise information technology risk management reporting dashboard which includes risk rating breakdown risk heat map, action plan breakdown and thresholds. This Organizations Risk Management And IT Security Enterprise IT Risk Management Reporting Dashboard Diagrams PDF is perfect for any presentation, be it in front of clients or colleagues. It is a versatile and stylish solution for organizing your meetings. The Organizations Risk Management And IT Security Enterprise IT Risk Management Reporting Dashboard Diagrams PDF features a modern design for your presentation meetings. The adjustable and customizable slides provide unlimited possibilities for acing up your presentation. Slidegeeks has done all the homework before launching the product for you. So, do not wait, grab the presentation templates today.

Workplace Facility Management Services Company Facility Management Services Global Market Scenario Diagrams PDF
This slide highlights the facility management services market share and future growth rate in graphical format which showcases product life cycle of different countries and organized and unorganized sector future growth rate. Explore a selection of the finest Workplace Facility Management Services Company Facility Management Services Global Market Scenario Diagrams PDF here. With a plethora of professionally designed and pre made slide templates, you can quickly and easily find the right one for your upcoming presentation. You can use our Workplace Facility Management Services Company Facility Management Services Global Market Scenario Diagrams PDF to effectively convey your message to a wider audience. Slidegeeks has done a lot of research before preparing these presentation templates. The content can be personalized and the slides are highly editable. Grab templates today from Slidegeeks.

Kpi Dashboard To Monitor Sales Opportunities Strategic Promotion Plan To Improve Product Diagrams PDF
Mentioned slide shows the KPI dashboard that can be used to track win and lost sales opportunities. It includes metrics namely won opportunities, lost opportunities, pipeline by territory, total opportunities.Explore a selection of the finest Kpi Dashboard To Monitor Sales Opportunities Strategic Promotion Plan To Improve Product Diagrams PDF here. With a plethora of professionally designed and pre-made slide templates, you can quickly and easily find the right one for your upcoming presentation. You can use our Kpi Dashboard To Monitor Sales Opportunities Strategic Promotion Plan To Improve Product Diagrams PDF to effectively convey your message to a wider audience. Slidegeeks has done a lot of research before preparing these presentation templates. The content can be personalized and the slides are highly editable. Grab templates today from Slidegeeks.

Formulating Video Marketing Strategies To Enhance Sales Identifying Key Demographics Of Target Audience Diagrams PDF
The following slide outlines the major demographics of video marketing target audience. Information covered in this slide is related to gender, age, location, income and education level. Formulating a presentation can take up a lot of effort and time, so the content and message should always be the primary focus. The visuals of the PowerPoint can enhance the presenters message, so our Formulating Video Marketing Strategies To Enhance Sales Identifying Key Demographics Of Target Audience Diagrams PDF was created to help save time. Instead of worrying about the design, the presenter can concentrate on the message while our designers work on creating the ideal templates for whatever situation is needed. Slidegeeks has experts for everything from amazing designs to valuable content, we have put everything into Formulating Video Marketing Strategies To Enhance Sales Identifying Key Demographics Of Target Audience Diagrams PDF.

Effective Organizational B2B And B2C 70 20 10 Rule Social Media Marketing Diagrams PDF
Purpose of the following slide is to display the best practices of utilizing social media marketing. It displays the 70-20-10 rule which defines the type of content to be posted on various social media platforms. Do you have an important presentation coming up Are you looking for something that will make your presentation stand out from the rest Look no further than Effective Organizational B2B And B2C 70 20 10 Rule Social Media Marketing Diagrams PDF. With our professional designs, you can trust that your presentation will pop and make delivering it a smooth process. And with Slidegeeks, you can trust that your presentation will be unique and memorable. So why wait Grab Effective Organizational B2B And B2C 70 20 10 Rule Social Media Marketing Diagrams PDF today and make your presentation stand out from the rest.

Dashboard For Dual Branding Campaign Performance Dual Branding Marketing Campaign Diagrams PDF
This slide showcases dashboard that can help organization to measure performance after launching dual branding campaign. Its key components are sales comparison, revenue by client, revenue by source and new customers by source. Here you can discover an assortment of the finest PowerPoint and Google Slides templates. With these templates, you can create presentations for a variety of purposes while simultaneously providing your audience with an eye-catching visual experience. Download Dashboard For Dual Branding Campaign Performance Dual Branding Marketing Campaign Diagrams PDF to deliver an impeccable presentation. These templates will make your job of preparing presentations much quicker, yet still, maintain a high level of quality. Slidegeeks has experienced researchers who prepare these templates and write high-quality content for you. Later on, you can personalize the content by editing the Dashboard For Dual Branding Campaign Performance Dual Branding Marketing Campaign Diagrams PDF.
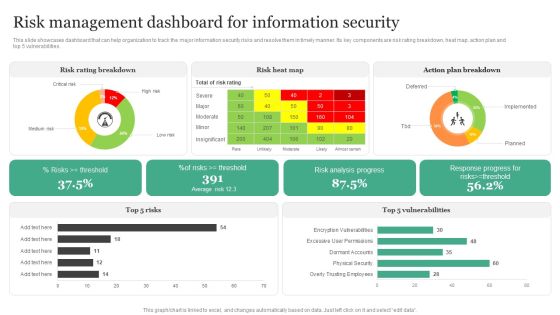
Risk Management Dashboard For Information Security Information Security Risk Administration Diagrams PDF
This slide showcases dashboard that can help organization to track the major information security risks and resolve them in timely manner. Its key components are risk rating breakdown, heat map, action plan and top 5 vulnerabilities.Create an editable Risk Management Dashboard For Information Security Information Security Risk Administration Diagrams PDF that communicates your idea and engages your audience. Whether you are presenting a business or an educational presentation, pre-designed presentation templates help save time. Risk Management Dashboard For Information Security Information Security Risk Administration Diagrams PDF is highly customizable and very easy to edit, covering many different styles from creative to business presentations. Slidegeeks has creative team members who have crafted amazing templates. So, go and get them without any delay.
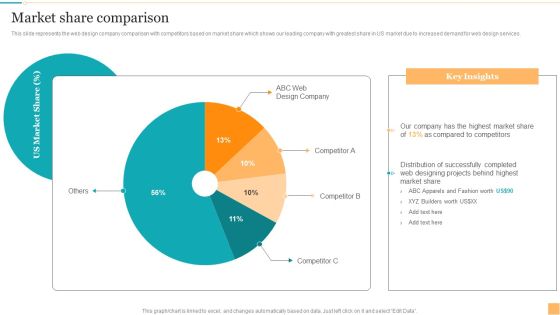
Website Design And Branding Studio Company Profile Market Share Comparison Diagrams PDF
This slide represents the web design company comparison with competitors based on market share which shows our leading company with greatest share in US market due to increased demand for web design services. Here you can discover an assortment of the finest PowerPoint and Google Slides templates. With these templates, you can create presentations for a variety of purposes while simultaneously providing your audience with an eye-catching visual experience. Download Website Design And Branding Studio Company Profile Market Share Comparison Diagrams PDF to deliver an impeccable presentation. These templates will make your job of preparing presentations much quicker, yet still, maintain a high level of quality. Slidegeeks has experienced researchers who prepare these templates and write high-quality content for you. Later on, you can personalize the content by editing the Website Design And Branding Studio Company Profile Market Share Comparison Diagrams PDF.

Global Automotive Industry Research And Analysis Global Motor Vehicle Sales By Region Diagrams PDF
This slide covers a graphical representation of worldwide automobile sales for Europe, Asia, Africa, NAFTA, Central, and South America, etc. It also includes key insights about Chinese car sales expansion, USA sales, Indias sales, etc. Explore a selection of the finest Global Automotive Industry Research And Analysis Global Motor Vehicle Sales By Region Diagrams PDF here. With a plethora of professionally designed and pre made slide templates, you can quickly and easily find the right one for your upcoming presentation. You can use our Global Automotive Industry Research And Analysis Global Motor Vehicle Sales By Region Diagrams PDF to effectively convey your message to a wider audience. Slidegeeks has done a lot of research before preparing these presentation templates. The content can be personalized and the slides are highly editable. Grab templates today from Slidegeeks.

Deploying Ai To Enhance New Business Model For Service Business Diagrams PDF
This slide describes the new business model for service business use case for the internet of things, including its impact on the product and service ratio of the company. Crafting an eye-catching presentation has never been more straightforward. Let your presentation shine with this tasteful yet straightforward Deploying Ai To Enhance New Business Model For Service Business Diagrams PDF template. It offers a minimalistic and classy look that is great for making a statement. The colors have been employed intelligently to add a bit of playfulness while still remaining professional. Construct the ideal Deploying Ai To Enhance New Business Model For Service Business Diagrams PDF that effortlessly grabs the attention of your audience Begin now and be certain to wow your customers.

ITSM Ticketing Tool Dashboard With Activity Status Ppt PowerPoint Presentation File Diagrams PDF
This slide depicts information technology service management ITSM ticketing tool dashboard with activity status. It provides information about open tickets, closed tickets, requests, desktop support, alert level, completed tickets, etc. Crafting an eye catching presentation has never been more straightforward. Let your presentation shine with this tasteful yet straightforward ITSM Ticketing Tool Dashboard With Activity Status Ppt PowerPoint Presentation File Diagrams PDF template. It offers a minimalistic and classy look that is great for making a statement. The colors have been employed intelligently to add a bit of playfulness while still remaining professional. Construct the ideal ITSM Ticketing Tool Dashboard With Activity Status Ppt PowerPoint Presentation File Diagrams PDF that effortlessly grabs the attention of your audience Begin now and be certain to wow your customers.
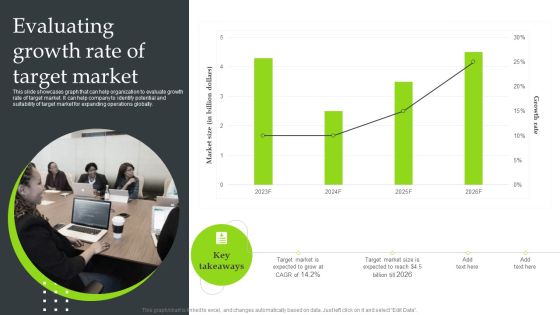
Expansion Strategic Plan Evaluating Growth Rate Of Target Market Diagrams PDF
This slide showcases graph that can help organization to evaluate growth rate of target market. It can help company to identify potential and suitability of target market for expanding operations globally. Do you have to make sure that everyone on your team knows about any specific topic I yes, then you should give Expansion Strategic Plan Evaluating Growth Rate Of Target Market Diagrams PDF a try. Our experts have put a lot of knowledge and effort into creating this impeccable Expansion Strategic Plan Evaluating Growth Rate Of Target Market Diagrams PDF. You can use this template for your upcoming presentations, as the slides are perfect to represent even the tiniest detail. You can download these templates from the Slidegeeks website and these are easy to edit. So grab these today.
Human Augmented Machine Learning IT Augmented Intelligence Information Tracking Dashboard Diagrams PDF
This slide depicts the information tracking dashboard by augmented intelligence model covering the data analysis. Data analysis includes image analysis, storage size, new users on the cloud platform, etc. Get a simple yet stunning designed Human Augmented Machine Learning IT Augmented Intelligence Information Tracking Dashboard Diagrams PDF. It is the best one to establish the tone in your meetings. It is an excellent way to make your presentations highly effective. So, download this PPT today from Slidegeeks and see the positive impacts. Our easy-to-edit Human Augmented Machine Learning IT Augmented Intelligence Information Tracking Dashboard Diagrams PDF can be your go-to option for all upcoming conferences and meetings. So, what are you waiting for. Grab this template today.
Performance Tracking Dashboard For 5G Architecture 5G Network Structure Diagrams PDF
This slide describes the performance tracking dashboard for 5G architecture by covering the details of subscribers, quality of experience, consumption, customer support, coverage, devices, and dimensions.Explore a selection of the finest Performance Tracking Dashboard For 5G Architecture 5G Network Structure Diagrams PDF here. With a plethora of professionally designed and pre-made slide templates, you can quickly and easily find the right one for your upcoming presentation. You can use our Performance Tracking Dashboard For 5G Architecture 5G Network Structure Diagrams PDF to effectively convey your message to a wider audience. Slidegeeks has done a lot of research before preparing these presentation templates. The content can be personalized and the slides are highly editable. Grab templates today from Slidegeeks.

Commodity Line Extension Techniques Product Line Performance And Outlook By Division Diagrams PDF
This slide showcases product line performance and outlook by market division which can help branding managers identify overall inputs. It provides details about increased sales, overseas market, lower marketing expenses, increased demand, etc. Do you have to make sure that everyone on your team knows about any specific topic I yes, then you should give Commodity Line Extension Techniques Product Line Performance And Outlook By Division Diagrams PDF a try. Our experts have put a lot of knowledge and effort into creating this impeccable Commodity Line Extension Techniques Product Line Performance And Outlook By Division Diagrams PDF. You can use this template for your upcoming presentations, as the slides are perfect to represent even the tiniest detail. You can download these templates from the Slidegeeks website and these are easy to edit. So grab these today.
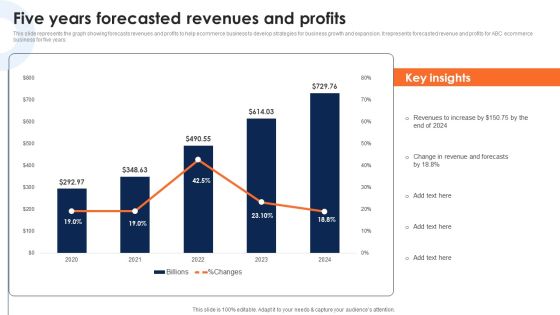
Five Years Forecasted Revenues And Profits Deploying Ecommerce Order Management Software Diagrams PDF
This slide represents the graph showing forecasts revenues and profits to help ecommerce business to develop strategies for business growth and expansion. It represents forecasted revenue and profits for ABC ecommerce business for five years.Crafting an eye-catching presentation has never been more straightforward. Let your presentation shine with this tasteful yet straightforward Five Years Forecasted Revenues And Profits Deploying Ecommerce Order Management Software Diagrams PDF template. It offers a minimalistic and classy look that is great for making a statement. The colors have been employed intelligently to add a bit of playfulness while still remaining professional. Construct the ideal Five Years Forecasted Revenues And Profits Deploying Ecommerce Order Management Software Diagrams PDF that effortlessly grabs the attention of your audience. Begin now and be certain to wow your customers.

Strategic Guide For Positioning Expanded Brand KPI Dashboard To Monitor Sales And Orders Performance Diagrams PDF
Following slide displays sales and orders performance monitoring dashboard. Key performance indicators covered in the slide are return reasons, perfect order rate, total orders, top seller by orders. Crafting an eye-catching presentation has never been more straightforward. Let your presentation shine with this tasteful yet straightforward Strategic Guide For Positioning Expanded Brand KPI Dashboard To Monitor Sales And Orders Performance Diagrams PDF template. It offers a minimalistic and classy look that is great for making a statement. The colors have been employed intelligently to add a bit of playfulness while still remaining professional. Construct the ideal Strategic Guide For Positioning Expanded Brand KPI Dashboard To Monitor Sales And Orders Performance Diagrams PDF that effortlessly grabs the attention of your audience Begin now and be certain to wow your customers.

Omnichannel Distribution System To Satisfy Customer Needs Company Sales From Current Distribution Channels Diagrams PDF
This slide includes the graphical depiction of current distribution strategies of the company with revenue numbers from last 3 years. Company is currently using strategies like retail store based sales, personal selling, direct mail etc. Get a simple yet stunning designed Omnichannel Distribution System To Satisfy Customer Needs Company Sales From Current Distribution Channels Diagrams PDF. It is the best one to establish the tone in your meetings. It is an excellent way to make your presentations highly effective. So, download this PPT today from Slidegeeks and see the positive impacts. Our easy-to-edit Omnichannel Distribution System To Satisfy Customer Needs Company Sales From Current Distribution Channels Diagrams PDF can be your go-to option for all upcoming conferences and meetings. So, what are you waiting for Grab this template today.

Brand Awareness Metrics Social Or Non-Social Media Reach Comprehensive Guide For Brand Recognition Diagrams PDF
This slide provides information regarding social or non-social media reach as brand awareness metrics. It helps in assessing brand awareness and recall. The slide also include key initiatives to enhance brand reach. Get a simple yet stunning designed Brand Awareness Metrics Social Or Non-Social Media Reach Comprehensive Guide For Brand Recognition Diagrams PDF. It is the best one to establish the tone in your meetings. It is an excellent way to make your presentations highly effective. So, download this PPT today from Slidegeeks and see the positive impacts. Our easy-to-edit Brand Awareness Metrics Social Or Non-Social Media Reach Comprehensive Guide For Brand Recognition Diagrams PDF can be your go-to option for all upcoming conferences and meetings. So, what are you waiting for Grab this template today.
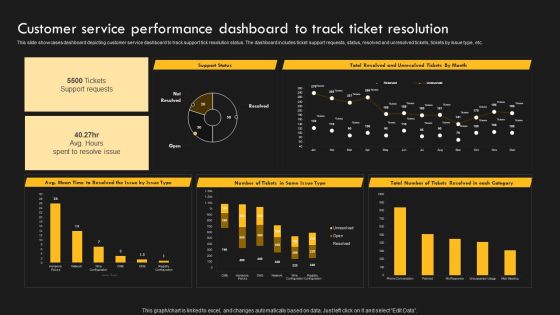
Service Improvement Techniques For Client Retention Customer Service Performance Dashboard Diagrams PDF
This slide showcases dashboard depicting customer service dashboard to track support tick resolution status. The dashboard includes ticket support requests, status, resolved and unresolved tickets, tickets by issue type, etc. Find highly impressive Service Improvement Techniques For Client Retention Customer Service Performance Dashboard Diagrams PDF on Slidegeeks to deliver a meaningful presentation. You can save an ample amount of time using these presentation templates. No need to worry to prepare everything from scratch because Slidegeeks experts have already done a huge research and work for you. You need to download Service Improvement Techniques For Client Retention Customer Service Performance Dashboard Diagrams PDF for your upcoming presentation. All the presentation templates are 100 percent editable and you can change the color and personalize the content accordingly. Download now.
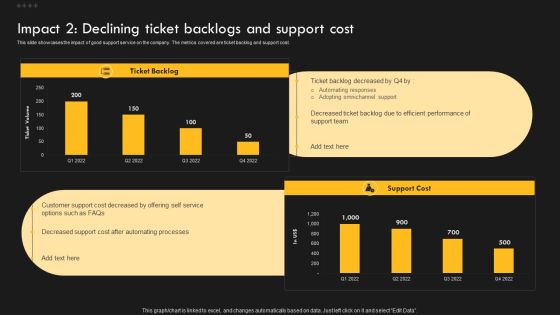
Service Improvement Techniques For Client Retention Impact 2 Declining Ticket Backlogs And Support Diagrams PDF
This slide showcases the impact of good support service on the company. The metrics covered are customer satisfaction and retention. Explore a selection of the finest Service Improvement Techniques For Client Retention Impact 2 Declining Ticket Backlogs And Support Diagrams PDF here. With a plethora of professionally designed and pre-made slide templates, you can quickly and easily find the right one for your upcoming presentation. You can use our Service Improvement Techniques For Client Retention Impact 2 Declining Ticket Backlogs And Support Diagrams PDF to effectively convey your message to a wider audience. Slidegeeks has done a lot of research before preparing these presentation templates. The content can be personalized and the slides are highly editable. Grab templates today from Slidegeeks.

Brand Personality Improvement To Increase Profits Brand Equity Performance Assessment Dashboard Diagrams PDF
This slide provides information regarding brand equity performance assessment dashboard that highlights customer lifecycle value, customer adoption rate, mentions, engagement, etc. Do you have to make sure that everyone on your team knows about any specific topic I yes, then you should give Brand Personality Improvement To Increase Profits Brand Equity Performance Assessment Dashboard Diagrams PDF a try. Our experts have put a lot of knowledge and effort into creating this impeccable Brand Personality Improvement To Increase Profits Brand Equity Performance Assessment Dashboard Diagrams PDF. You can use this template for your upcoming presentations, as the slides are perfect to represent even the tiniest detail. You can download these templates from the Slidegeeks website and these are easy to edit. So grab these today.
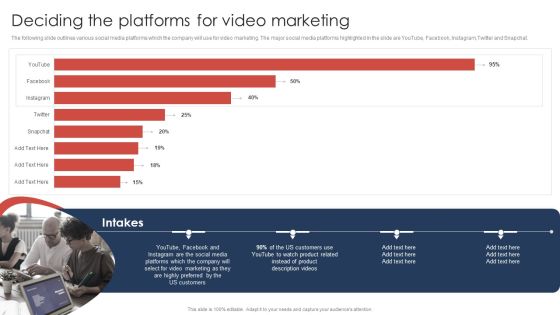
Effective Video Promotional Strategies For Brand Awareness Deciding The Platforms For Video Marketing Diagrams PDF
The following slide outlines various social media platforms which the company will use for video marketing. The major social media platforms highlighted in the slide are YouTube, Facebook, Instagram,Twitter and Snapchat. Here you can discover an assortment of the finest PowerPoint and Google Slides templates. With these templates, you can create presentations for a variety of purposes while simultaneously providing your audience with an eye catching visual experience. Download Effective Video Promotional Strategies For Brand Awareness Deciding The Platforms For Video Marketing Diagrams PDF to deliver an impeccable presentation. These templates will make your job of preparing presentations much quicker, yet still, maintain a high level of quality. Slidegeeks has experienced researchers who prepare these templates and write high quality content for you. Later on, you can personalize the content by editing the Effective Video Promotional Strategies For Brand Awareness Deciding The Platforms For Video Marketing Diagrams PDF.
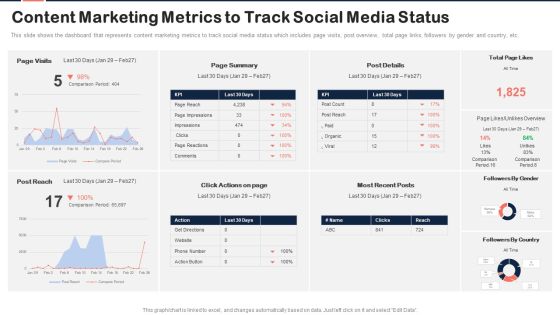
Implementing Content Marketing Plan To Nurture Leads Content Marketing Metrics To Track Diagrams PDF
This slide shows the dashboard that represents content marketing metrics to track social media status which includes page visits, post overview, total page links, followers by gender and country, etc. Crafting an eye catching presentation has never been more straightforward. Let your presentation shine with this tasteful yet straightforward Implementing Content Marketing Plan To Nurture Leads Content Marketing Metrics To Track Diagrams PDF template. It offers a minimalistic and classy look that is great for making a statement. The colors have been employed intelligently to add a bit of playfulness while still remaining professional. Construct the ideal Implementing Content Marketing Plan To Nurture Leads Content Marketing Metrics To Track Diagrams PDF that effortlessly grabs the attention of your audience Begin now and be certain to wow your customers.

Customer Service Plan To Improve Sales Initiatives To Improve Customer Experience Diagrams PDF
This slide focuses on initiatives to improve customer experience by personalizing conversations, creating templates for different channels, real time response and follow up with customer. Crafting an eye catching presentation has never been more straightforward. Let your presentation shine with this tasteful yet straightforward Customer Service Plan To Improve Sales Initiatives To Improve Customer Experience Diagrams PDF template. It offers a minimalistic and classy look that is great for making a statement. The colors have been employed intelligently to add a bit of playfulness while still remaining professional. Construct the ideal Customer Service Plan To Improve Sales Initiatives To Improve Customer Experience Diagrams PDF that effortlessly grabs the attention of your audience Begin now and be certain to wow your customers.

Developing Content Marketing Impact Of Ineffective Content Marketing Strategy Diagrams PDF
This slide covers the impact of ineffective content marketing strategies which shows increase in bounce rate and decline in marketing ROI due to disengaging content, misleading title tag, etc. which results in reduction in company sales. Find highly impressive Developing Content Marketing Impact Of Ineffective Content Marketing Strategy Diagrams PDF on Slidegeeks to deliver a meaningful presentation. You can save an ample amount of time using these presentation templates. No need to worry to prepare everything from scratch because Slidegeeks experts have already done a huge research and work for you. You need to download Developing Content Marketing Impact Of Ineffective Content Marketing Strategy Diagrams PDF for your upcoming presentation. All the presentation templates are 100 percent editable and you can change the color and personalize the content accordingly. Download now.

KPI Metrics Dashboard To Measure Success Of Customer Churn Prevention Strategies Diagrams PDF
Mentioned slide outlines a key performance indicator KPI dashboard which will assist managers to showcase the result of customer attrition prevention strategies. The KPIs are risky customers, retention rate, monthly recurring revenue MRR, churn risk by location and income, etc. This KPI Metrics Dashboard To Measure Success Of Customer Churn Prevention Strategies Diagrams PDF is perfect for any presentation, be it in front of clients or colleagues. It is a versatile and stylish solution for organizing your meetings. The KPI Metrics Dashboard To Measure Success Of Customer Churn Prevention Strategies Diagrams PDF features a modern design for your presentation meetings. The adjustable and customizable slides provide unlimited possibilities for acing up your presentation. Slidegeeks has done all the homework before launching the product for you. So, do not wait, grab the presentation templates today

Buy Side M And A Service Other Sectors Top Clients And Total Revenue Diagrams PDF
The slide identifies a list of companys clients in various other sectors manufacturing, construction, financials services, energy. Mining, automobile etc. along with the total revenue from each sector for the year 2021. Do you have to make sure that everyone on your team knows about any specific topic I yes, then you should give Buy Side M And A Service Other Sectors Top Clients And Total Revenue Diagrams PDF a try. Our experts have put a lot of knowledge and effort into creating this impeccable Buy Side M And A Service Other Sectors Top Clients And Total Revenue Diagrams PDF. You can use this template for your upcoming presentations, as the slides are perfect to represent even the tiniest detail. You can download these templates from the Slidegeeks website and these are easy to edit. So grab these today

Implementation Of An Efficient Credit Card Promotion Plan Rise In Customer Churn Rate Leading Diagrams PDF
This slide represents challenges credit card companies face, i.e., an increase in customer churn rate. It includes key performance indicators such as customer engagement rate, customer dissatisfaction and product usage. Explore a selection of the finest Implementation Of An Efficient Credit Card Promotion Plan Rise In Customer Churn Rate Leading Diagrams PDF here. With a plethora of professionally designed and pre made slide templates, you can quickly and easily find the right one for your upcoming presentation. You can use our Implementation Of An Efficient Credit Card Promotion Plan Rise In Customer Churn Rate Leading Diagrams PDF to effectively convey your message to a wider audience. Slidegeeks has done a lot of research before preparing these presentation templates. The content can be personalized and the slides are highly editable. Grab templates today from Slidegeeks.

Customer Segmentation For Shopping Mall Customers Ppt PowerPoint Presentation File Diagrams PDF
This slide represents customer segmentation for shopping mall customers. It include information regarding segmentation on the basis of gender and age group. Formulating a presentation can take up a lot of effort and time, so the content and message should always be the primary focus. The visuals of the PowerPoint can enhance the presenters message, so our Customer Segmentation For Shopping Mall Customers Ppt PowerPoint Presentation File Diagrams PDF was created to help save time. Instead of worrying about the design, the presenter can concentrate on the message while our designers work on creating the ideal templates for whatever situation is needed. Slidegeeks has experts for everything from amazing designs to valuable content, we have put everything into Customer Segmentation For Shopping Mall Customers Ppt PowerPoint Presentation File Diagrams PDF

Ultimate Guide To Improve Customer Support And Services Dashboard For Analysing Aftersales Customer Diagrams PDF
This slide covers a dashboard for tracking consumer satisfaction with metrics such as customer satisfaction score, customer effort score, net promoter score, average response time, etc. Find highly impressive Ultimate Guide To Improve Customer Support And Services Dashboard For Analysing Aftersales Customer Diagrams PDF on Slidegeeks to deliver a meaningful presentation. You can save an ample amount of time using these presentation templates. No need to worry to prepare everything from scratch because Slidegeeks experts have already done a huge research and work for you. You need to download Ultimate Guide To Improve Customer Support And Services Dashboard For Analysing Aftersales Customer Diagrams PDF for your upcoming presentation. All the presentation templates are 100 percent editable and you can change the color and personalize the content accordingly. Download now.
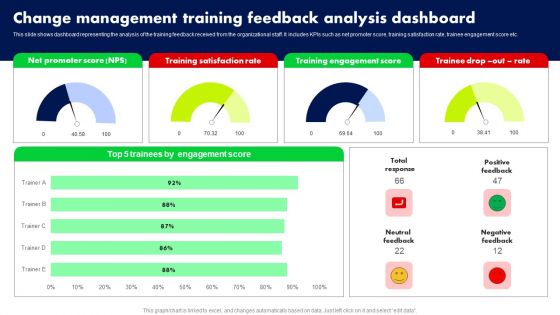
Change Management Training Feedback Analysis Dashboard Ppt PowerPoint Presentation File Diagrams PDF
This slide shows dashboard representing the analysis of the training feedback received from the organizational staff. It includes KPIs such as net promoter score, training satisfaction rate, trainee engagement score etc. Get a simple yet stunning designed Change Management Training Feedback Analysis Dashboard Ppt PowerPoint Presentation File Diagrams PDF. It is the best one to establish the tone in your meetings. It is an excellent way to make your presentations highly effective. So, download this PPT today from Slidegeeks and see the positive impacts. Our easy to edit Change Management Training Feedback Analysis Dashboard Ppt PowerPoint Presentation File Diagrams PDF can be your go to option for all upcoming conferences and meetings. So, what are you waiting for Grab this template today.
Influencers Marketing Campaign Performance Tracking Dashboard Ppt PowerPoint Presentation Diagram Lists PDF
This slide covers performance monitoring dashboard of influencer based referral marketing program. It includes elements such as impressions on Instagram, likes, comments, clicks, sales generated along with value calculators and campaign breakdown based on gender and age. Formulating a presentation can take up a lot of effort and time, so the content and message should always be the primary focus. The visuals of the PowerPoint can enhance the presenters message, so our Influencers Marketing Campaign Performance Tracking Dashboard Ppt PowerPoint Presentation Diagram Lists PDF was created to help save time. Instead of worrying about the design, the presenter can concentrate on the message while our designers work on creating the ideal templates for whatever situation is needed. Slidegeeks has experts for everything from amazing designs to valuable content, we have put everything into Influencers Marketing Campaign Performance Tracking Dashboard Ppt PowerPoint Presentation Diagram Lists PDF

Strategies For Dynamic Supply Chain Agility Segmenting The Vendors Based On Overall Performance Diagrams PDF
This slide showcases the classification of potential vendors into defined groups based on their performance scores. It also indicates that vendor 1 will get placed into group A and vendor 2 into group B. Do you have to make sure that everyone on your team knows about any specific topic I yes, then you should give Strategies For Dynamic Supply Chain Agility Segmenting The Vendors Based On Overall Performance Diagrams PDF a try. Our experts have put a lot of knowledge and effort into creating this impeccable Strategies For Dynamic Supply Chain Agility Segmenting The Vendors Based On Overall Performance Diagrams PDF. You can use this template for your upcoming presentations, as the slides are perfect to represent even the tiniest detail. You can download these templates from the Slidegeeks website and these are easy to edit. So grab these today.
Reinforcement Learning Techniques And Applications Performance Tracking Dashboard Reinforcement Diagrams PDF
This slide shows the roadmap for the reinforcement learning project, including the list of tasks to be performed from March 2023 to February 2024. The tasks include initializing the values table, observing the current state, choosing an action for that state, and so on. Formulating a presentation can take up a lot of effort and time, so the content and message should always be the primary focus. The visuals of the PowerPoint can enhance the presenters message, so our Reinforcement Learning Techniques And Applications Performance Tracking Dashboard Reinforcement Diagrams PDF was created to help save time. Instead of worrying about the design, the presenter can concentrate on the message while our designers work on creating the ideal templates for whatever situation is needed. Slidegeeks has experts for everything from amazing designs to valuable content, we have put everything into Reinforcement Learning Techniques And Applications Performance Tracking Dashboard Reinforcement Diagrams PDF

Enhancing Digital Visibility Using SEO Content Strategy KPI Dashboard To Evaluate SEO Performance Diagrams PDF
This slide shows key performance indicators dashboard which can be used by marketing managers to measure SEO performance. It includes metrics such as health score, domain rating, referring domains, backlinks, etc. This Enhancing Digital Visibility Using SEO Content Strategy KPI Dashboard To Evaluate SEO Performance Diagrams PDF is perfect for any presentation, be it in front of clients or colleagues. It is a versatile and stylish solution for organizing your meetings. The Enhancing Digital Visibility Using SEO Content Strategy KPI Dashboard To Evaluate SEO Performance Diagrams PDF features a modern design for your presentation meetings. The adjustable and customizable slides provide unlimited possibilities for acing up your presentation. Slidegeeks has done all the homework before launching the product for you. So, do not wait, grab the presentation templates today

KPI Dashboard To Track Amazon Performance Ppt PowerPoint Presentation Diagram Lists PDF
This slide provides information regarding dashboard to monitor Amazon performance. The KPIs include tracking of product sales, conversion rate, advertising spends, session, organic sales, etc. Explore a selection of the finest KPI Dashboard To Track Amazon Performance Ppt PowerPoint Presentation Diagram Lists PDF here. With a plethora of professionally designed and pre made slide templates, you can quickly and easily find the right one for your upcoming presentation. You can use our KPI Dashboard To Track Amazon Performance Ppt PowerPoint Presentation Diagram Lists PDF to effectively convey your message to a wider audience. Slidegeeks has done a lot of research before preparing these presentation templates. The content can be personalized and the slides are highly editable. Grab templates today from Slidegeeks.

Market Size Of Information Technology Industry USA Ppt PowerPoint Presentation Diagram Lists PDF
The following slide showcases expected revenue and compound annual growth rate CAGR of IT industry in USA. Information covered in this statistical slide is related to project oriented services, IT outsourcing services, IT support and training services, and enterprise cloud computing services. Get a simple yet stunning designed Market Size Of Information Technology Industry USA Ppt PowerPoint Presentation Diagram Lists PDF. It is the best one to establish the tone in your meetings. It is an excellent way to make your presentations highly effective. So, download this PPT today from Slidegeeks and see the positive impacts. Our easy to edit Market Size Of Information Technology Industry USA Ppt PowerPoint Presentation Diagram Lists PDF can be your go to option for all upcoming conferences and meetings. So, what are you waiting for Grab this template today.

Online Video Content Provider Business Profile Employee Count From 2018 To 2021 Diagrams PDF
This slide showcases the employee count for last four years from 2018 to 2021 that represents continuous increase in number of Netflix employees. It also covers employee split by region. Do you have to make sure that everyone on your team knows about any specific topic I yes, then you should give Online Video Content Provider Business Profile Employee Count From 2018 To 2021 Diagrams PDF a try. Our experts have put a lot of knowledge and effort into creating this impeccable Online Video Content Provider Business Profile Employee Count From 2018 To 2021 Diagrams PDF. You can use this template for your upcoming presentations, as the slides are perfect to represent even the tiniest detail. You can download these templates from the Slidegeeks website and these are easy to edit. So grab these today.

Flexible Working Policies And Guidelines Flexible Working Challenges Post Covid 19 Diagrams PDF
The following slide delineates flexible scheduling challenges which are faced by small, medium, and large-scale businesses after the pandemic. The challenges are lack of bonding, distractions at home, poor internet connection, staying motivated and communication gap. Formulating a presentation can take up a lot of effort and time, so the content and message should always be the primary focus. The visuals of the PowerPoint can enhance the presenters message, so our Flexible Working Policies And Guidelines Flexible Working Challenges Post Covid 19 Diagrams PDF was created to help save time. Instead of worrying about the design, the presenter can concentrate on the message while our designers work on creating the ideal templates for whatever situation is needed. Slidegeeks has experts for everything from amazing designs to valuable content, we have put everything into Flexible Working Policies And Guidelines Flexible Working Challenges Post Covid 19 Diagrams PDF

Executing Sales Risk Administration Procedure Major Factors Contributing Sales Risks Diagrams PDF
The following slide depicts some key drivers that elevate sales risks to define its scope and impact. It mainly includes elements such as rapid technology evolution, market fluctuation, market competition, risk management strategies along with key insights etc. Get a simple yet stunning designed Executing Sales Risk Administration Procedure Major Factors Contributing Sales Risks Diagrams PDF. It is the best one to establish the tone in your meetings. It is an excellent way to make your presentations highly effective. So, download this PPT today from Slidegeeks and see the positive impacts. Our easy to edit Executing Sales Risk Administration Procedure Major Factors Contributing Sales Risks Diagrams PDF can be your go to option for all upcoming conferences and meetings. So, what are you waiting for Grab this template today.

Examining Customer Experience Path To Enhance Adoption Rate Dashboard To Evaluate Consumer Adoption Diagrams PDF
This slide showcases the KPIs that would help our business organization to evaluate improvements in the consumer adoption process. It includes repeat purchase ratio per purchase frequency, conversions over time, customer adoption rate, customer churn rate, etc. Create an editable Examining Customer Experience Path To Enhance Adoption Rate Dashboard To Evaluate Consumer Adoption Diagrams PDF that communicates your idea and engages your audience. Whether youre presenting a business or an educational presentation, pre designed presentation templates help save time. Examining Customer Experience Path To Enhance Adoption Rate Dashboard To Evaluate Consumer Adoption Diagrams PDF is highly customizable and very easy to edit, covering many different styles from creative to business presentations. Slidegeeks has creative team members who have crafted amazing templates. So, go and get them without any delay.

Data And Customer Analysis Company Outline Revenue And Operating Income Diagrams PDF
This slide highlights the Nielsen company revenue and operating income for the last 3 years. It includes the data in million of US dollars with a key takeaways section. Create an editable Data And Customer Analysis Company Outline Revenue And Operating Income Diagrams PDF that communicates your idea and engages your audience. Whether youre presenting a business or an educational presentation, pre designed presentation templates help save time. Data And Customer Analysis Company Outline Revenue And Operating Income Diagrams PDF is highly customizable and very easy to edit, covering many different styles from creative to business presentations. Slidegeeks has creative team members who have crafted amazing templates. So, go and get them without any delay.
Enterprise SMS Marketing Subscribers Tracking Dashboard Ppt PowerPoint Presentation Diagram PDF
This slide represents the key metrics dashboard to monito and track the SMS marketing subscribers of the enterprise. It includes details related to KPIs such as total subscribers, new subscribers, total unsubscribes etc. Do you have an important presentation coming up Are you looking for something that will make your presentation stand out from the rest Look no further than Enterprise SMS Marketing Subscribers Tracking Dashboard Ppt PowerPoint Presentation Diagram PDF. With our professional designs, you can trust that your presentation will pop and make delivering it a smooth process. And with Slidegeeks, you can trust that your presentation will be unique and memorable. So why wait Grab Enterprise SMS Marketing Subscribers Tracking Dashboard Ppt PowerPoint Presentation Diagram PDF today and make your presentation stand out from the rest.
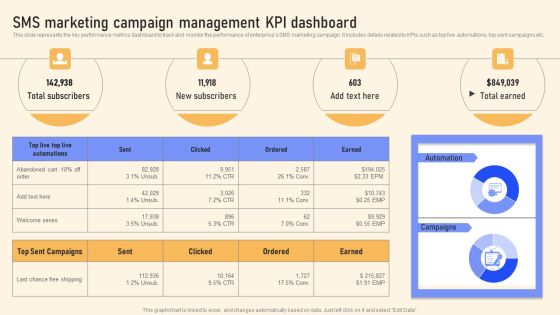
SMS Marketing Campaign Management KPI Dashboard Ppt PowerPoint Presentation Diagram Templates PDF
This slide represents the key performance metrics dashboard to track and monitor the performance of enterprises SMS marketing campaign. It includes details related to KPIs such as top live automations, top sent campaigns etc. Get a simple yet stunning designed SMS Marketing Campaign Management KPI Dashboard Ppt PowerPoint Presentation Diagram Templates PDF. It is the best one to establish the tone in your meetings. It is an excellent way to make your presentations highly effective. So, download this PPT today from Slidegeeks and see the positive impacts. Our easy to edit SMS Marketing Campaign Management KPI Dashboard Ppt PowerPoint Presentation Diagram Templates PDF can be your go to option for all upcoming conferences and meetings. So, what are you waiting for Grab this template today.
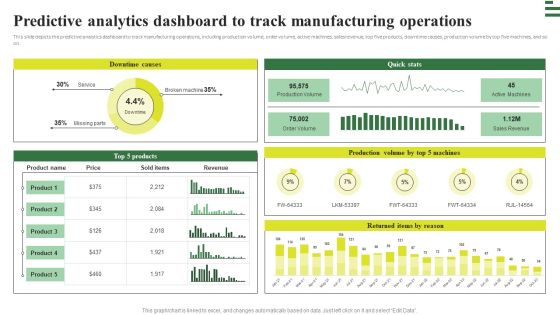
Transforming Manufacturing With Automation Predictive Analytics Dashboard To Track Diagrams PDF
This slide depicts the predictive analytics dashboard to track manufacturing operations, including production volume, order volume, active machines, sales revenue, top five products, downtime causes, production volume by top five machines, and so on. Get a simple yet stunning designed Transforming Manufacturing With Automation Predictive Analytics Dashboard To Track Diagrams PDF. It is the best one to establish the tone in your meetings. It is an excellent way to make your presentations highly effective. So, download this PPT today from Slidegeeks and see the positive impacts. Our easy to edit Transforming Manufacturing With Automation Predictive Analytics Dashboard To Track Diagrams PDF can be your go to option for all upcoming conferences and meetings. So, what are you waiting for Grab this template today.

Business Platform Dashboard With Retail KPI Performance Ppt PowerPoint Presentation Slides Diagrams PDF
Pitch your topic with ease and precision using this business platform dashboard with retail kpi performance ppt powerpoint presentation slides diagrams pdf. This layout presents information on retail kpi performance, business platform dashboard with retail kpi performance, online vs offline sales, shop visitors. It is also available for immediate download and adjustment. So, changes can be made in the color, design, graphics or any other component to create a unique layout.

Sales Optimization Best Practices To Close More Deals Sales KPI Dashboard Revenue Diagrams PDF
The sales dashboard is an effective tool that helps in monitoring various sales KPIs in order to aid sales teams in reaching sales goals by analyzing the sales performance. Deliver an awe inspiring pitch with this creative sales optimization best practices to close more deals sales kpi dashboard revenue diagrams pdf bundle. Topics like sales kpi dashboard can be discussed with this completely editable template. It is available for immediate download depending on the needs and requirements of the user.

Managed IT Services Pricing Model IT Server Downtime Issue And Support Dashboard Diagrams PDF
This slide is covering IT services downtime and support services dashboard. Deliver and pitch your topic in the best possible manner with this managed it services pricing model it server downtime issue and support dashboard diagrams pdf. Use them to share invaluable insights on issue, occurrence, any downtime and impress your audience. This template can be altered and modified as per your expectations. So, grab it now.
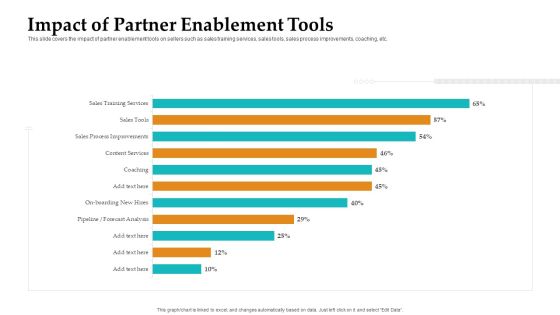
Sales Facilitation Partner Management Impact Of Partner Enablement Tools Diagrams PDF
This slide covers the impact of partner enablement tools on sellers such as sales training services, sales tools, sales process improvements, coaching, etc. Deliver and pitch your topic in the best possible manner with this sales facilitation partner management impact of partner enablement tools diagrams pdf. Use them to share invaluable insights on sales, training, process, service, coaching and impress your audience. This template can be altered and modified as per your expectations. So, grab it now.
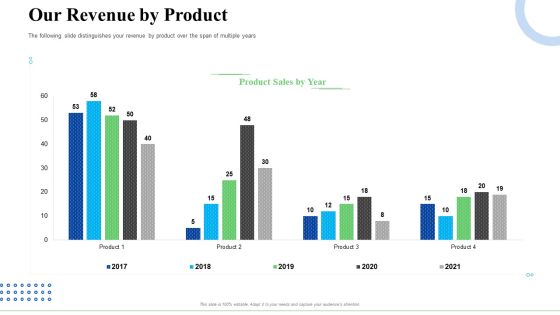
Strategic Plan For Business Expansion And Growth Our Revenue By Product Diagrams PDF
The following slide distinguishes your revenue by product over the span of multiple years. Deliver and pitch your topic in the best possible manner with this strategic plan for business expansion and growth our revenue by product diagrams pdf. Use them to share invaluable insights on our revenue by product and impress your audience. This template can be altered and modified as per your expectations. So, grab it now.

Pitch Deck For Procurement Deal Revenue Forecast Management Vs Consensus Diagrams PDF
The slide provides revenue comparison of management vs consensus. It provides the historical 2017-2021 and forecasted 2022-2026 revenue. Deliver an awe inspiring pitch with this creative pitch deck for procurement deal revenue forecast management vs consensus diagrams pdf bundle. Topics like revenue forecast management vs consensus can be discussed with this completely editable template. It is available for immediate download depending on the needs and requirements of the user.

Unified Business Consumer Marketing Strategy Most Relevant Advertising Channel Customers Diagrams PDF
This slide covers the most relevant advertising channel to the customers and how the target customer must be focused for the marketing Deliver and pitch your topic in the best possible manner with this unified business consumer marketing strategy most relevant advertising channel customers diagrams pdf. Use them to share invaluable insights on key insights, marketing to such customers, millennials and impress your audience. This template can be altered and modified as per your expectations. So, grab it now.
Inculcating Supplier Operation Improvement Plan Inventory Turnover Tracking Dashboard Diagrams PDF
This slide displays inventory turnover tracking dashboard. It includes information about achievable and target inventory, it also shows various reasons for product or package return. Deliver an awe inspiring pitch with this creative inculcating supplier operation improvement plan inventory turnover tracking dashboard diagrams pdf bundle. Topics like inventory turnover tracking dashboard can be discussed with this completely editable template. It is available for immediate download depending on the needs and requirements of the user.

Past Trends In Revenue Of XYZ Logistic Company Worldwide Diagrams PDF
This slide shows the past trends in revenue of XYZ Logistic Company worldwide. The graph shows a constant decline in sales since 2017.Deliver and pitch your topic in the best possible manner with this past trends in revenue of xyz logistic company worldwide diagrams pdf. Use them to share invaluable insights on past trends in revenue of xyz logistic company worldwide and impress your audience. This template can be altered and modified as per your expectations. So, grab it now.

Logistics Dashboard For XYZ Logistic Company Orders Ppt Infographic Template Diagrams PDF
The slide shows the logistic measurement dashboard for measuring order status, total orders, overdue shipments, global financial performance etc. Deliver and pitch your topic in the best possible manner with this logistics dashboard for xyz logistic company orders ppt infographic template diagrams pdf. Use them to share invaluable insights on global financial performance, orders, inventory and impress your audience. This template can be altered and modified as per your expectations. So, grab it now.
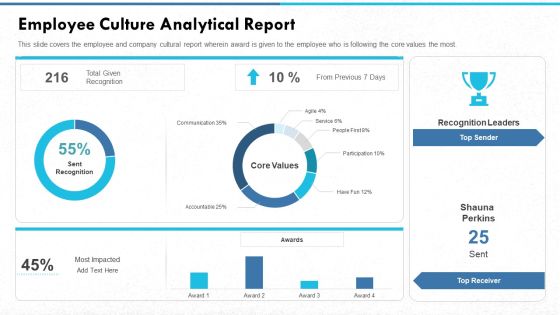
Managing Strong Company Culture In Business Employee Culture Analytical Report Diagrams PDF
This slide covers the employee and company cultural report wherein award is given to the employee who is following the core values the most. Deliver and pitch your topic in the best possible manner with this managing strong company culture in business employee culture analytical report diagrams pdf. Use them to share invaluable insights on sent recognition, core values, awards, top sender, top receiver and impress your audience. This template can be altered and modified as per your expectations. So, grab it now.
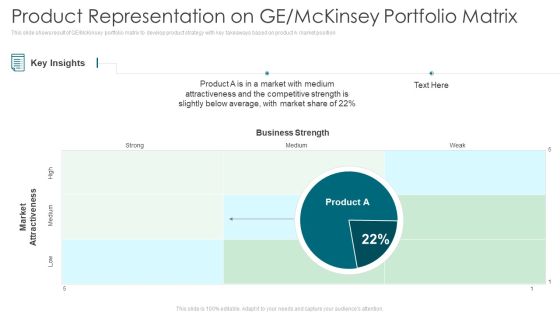
Environmental Assessment Product Representation On GE Mckinsey Portfolio Matrix Ppt Visual Aids Diagrams PDF
This slide shows result of GE or McKinsey portfolio matrix to develop product strategy with key takeaways based on product A market position. Deliver an awe inspiring pitch with this creative environmental assessment product representation on ge mckinsey portfolio matrix ppt visual aids diagrams pdf bundle. Topics like market share, business strength, market attractiveness can be discussed with this completely editable template. It is available for immediate download depending on the needs and requirements of the user.

Amalgamation Marketing Pitch Deck Challenges Faced By Our Business Due To Single Marketing Channel Diagrams PDF
This graph focuses on challenges faced by the business due to single channel approach such as missed opportunities, channel limitations, limited ROI, etc. Deliver and pitch your topic in the best possible manner with this amalgamation marketing pitch deck challenges faced by our business due to single marketing channel diagrams pdf. Use them to share invaluable insights on opportunities, limitation, marketing and impress your audience. This template can be altered and modified as per your expectations. So, grab it now.

Improvement In Employee Turnover In Technology Industry Dashboard Employee Attrition Rate Diagrams PDF
This slide shows the various factors related to the employees attrition rate growth in the company. Deliver and pitch your topic in the best possible manner with this improvement in employee turnover in technology industry dashboard employee attrition rate diagrams pdf. Use them to share invaluable insights on annual fluctuation, fluctuation report, workforce and impress your audience. This template can be altered and modified as per your expectations. So, grab it now.
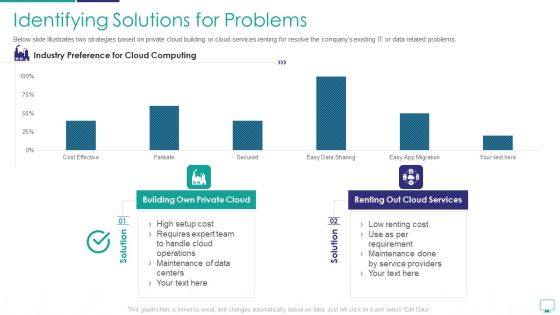
Mesh Computing Infrastructure Adoption Process Identifying Solutions For Problems Diagrams PDF
Below slide illustrates two strategies based on private cloud building or cloud services renting for resolve the companys existing IT or data related problems.Deliver an awe inspiring pitch with this creative mesh computing infrastructure adoption process identifying solutions for problems diagrams pdf bundle. Topics like identifying solutions for problems can be discussed with this completely editable template. It is available for immediate download depending on the needs and requirements of the user.
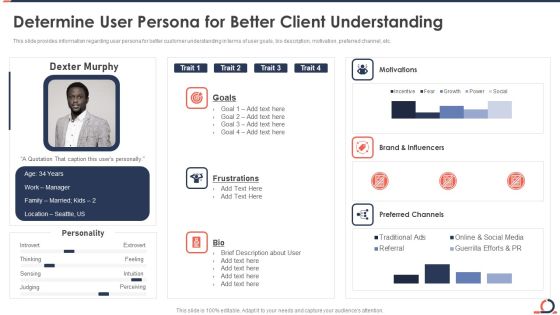
Determine User Persona For Better Client Understanding Developing Fixed Bid Projects Using Agile IT Diagrams PDF
This slide provides information regarding user persona for better customer understanding in terms of user goals, bio description, motivation, preferred channel, etc. Deliver an awe inspiring pitch with this creative determine user persona for better client understanding developing fixed bid projects using agile it diagrams pdf bundle. Topics like goals, frustrations, motivations, brand and influencers, preferred channels can be discussed with this completely editable template. It is available for immediate download depending on the needs and requirements of the user.
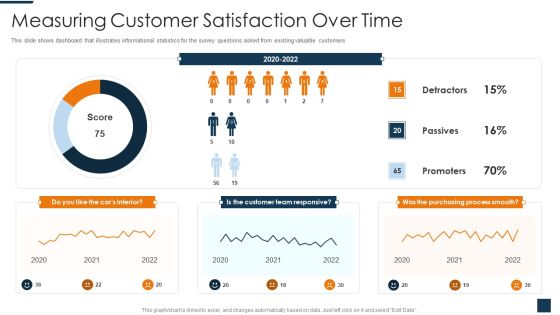
Go To Market Strategy For New Product Measuring Customer Satisfaction Over Time Diagrams PDF
This slide shows dashboard that illustrates informational statistics for the survey questions asked from existing valuable customers. Deliver an awe inspiring pitch with this creative go to market strategy for new product measuring customer satisfaction over time diagrams pdf bundle. Topics like detractors, passives, promoters can be discussed with this completely editable template. It is available for immediate download depending on the needs and requirements of the user.

Comprehensive Business Digitization Deck Driving Digital Transformation Through Artificial Intelligence Diagrams PDF
This graph shows the AIs benefits which enhances organizations products and processes and creates better decisions for the company. Deliver and pitch your topic in the best possible manner with this comprehensive business digitization deck driving digital transformation through artificial intelligence diagrams pdf. Use them to share invaluable insights on driving digital transformation through artificial intelligence and impress your audience. This template can be altered and modified as per your expectations. So, grab it now.
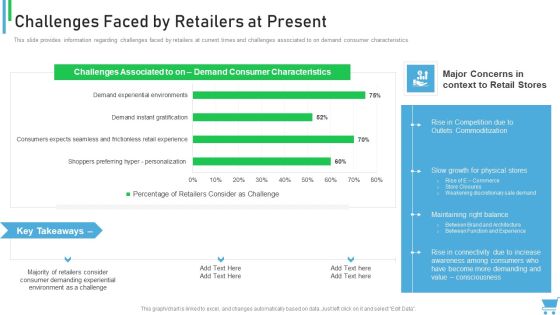
Experiential Retail Plan Challenges Faced By Retailers At Present Diagrams PDF
This slide provides information regarding challenges faced by retailers at current times and challenges associated to on demand consumer characteristics. Deliver and pitch your topic in the best possible manner with this experiential retail plan challenges faced by retailers at present diagrams pdf. Use them to share invaluable insights on commoditization, growth, maintaining, sale and impress your audience. This template can be altered and modified as per your expectations. So, grab it now.

How To Promote Business Using Youtube Marketing Current Sales Earned By The Company Diagrams PDF
This slide provides the glimpse about the current revenues and profit margin earned by the company for past 8 years. Deliver and pitch your topic in the best possible manner with this how to promote business using youtube marketing current sales earned by the company diagrams pdf. Use them to share invaluable insights on revenues, profit margin and impress your audience. This template can be altered and modified as per your expectations. So, grab it now.
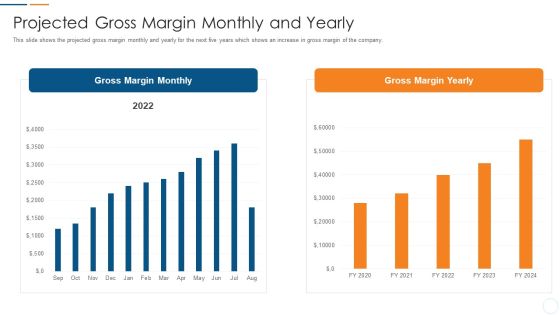
Organization Development Initiatives For Startups Projected Gross Margin Monthly And Yearly Diagrams PDF
This slide shows the projected gross margin monthly and yearly for the next five years which shows an increase in gross margin of the company. Deliver and pitch your topic in the best possible manner with this organization development initiatives for startups projected gross margin monthly and yearly diagrams pdf. Use them to share invaluable insights on projected gross margin monthly and yearly and impress your audience. This template can be altered and modified as per your expectations. So, grab it now.

Organization Development Initiatives For Startups Projected Profit And Loss Monthly And Yearly Diagrams PDF
This slide shows the projected profit and loss monthly and yearly graph for the years 2020 to 2024 which shows an increase in sales of the company. Deliver an awe inspiring pitch with this creative organization development initiatives for startups projected profit and loss monthly and yearly diagrams pdf bundle. Topics like projected profit and loss monthly and yearly can be discussed with this completely editable template. It is available for immediate download depending on the needs and requirements of the user.

Dashboard Related To Milk Production And Its Dairy Information Diagrams PDF
This slide shows the dashboard related to companys milk production details which includes lactating cows info, shipped milk or cow, metered milk or cow etc. Deliver and pitch your topic in the best possible manner with this dashboard related to milk production and its dairy information diagrams pdf. Use them to share invaluable insights on dashboard related to milk production and its dairy information and impress your audience. This template can be altered and modified as per your expectations. So, grab it now.
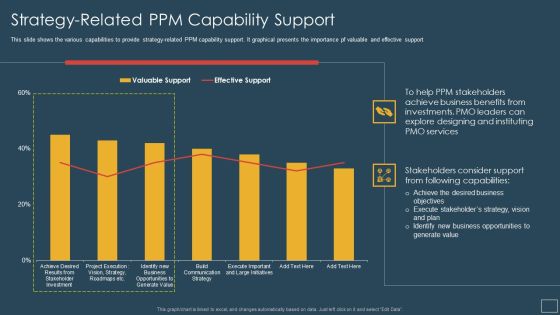
Responsibility Project Management Office Team Support Digital Company Strategy Related PPM Diagrams PDF
This slide shows the various capabilities to provide strategy related PPM capability support. It graphical presents the importance pf valuable and effective support. Deliver and pitch your topic in the best possible manner with this responsibility project management office team support digital company strategy related ppm diagrams pdf. Use them to share invaluable insights on desired business, strategy, business opportunities, value, plan and impress your audience. This template can be altered and modified as per your expectations. So, grab it now.

Improving Brand Recognition With Message And Differentiation Strategy Forecasting The Sales Decline Diagrams PDF
The following slide displays the sales data for the future as it displays a graphical representation of the historical and the forecasted data next four quarters Deliver and pitch your topic in the best possible manner with this improving brand recognition with message and differentiation strategy forecasting the sales decline diagrams pdf. Use them to share invaluable insights on forecasting the sales and impress your audience. This template can be altered and modified as per your expectations. So, grab it now.
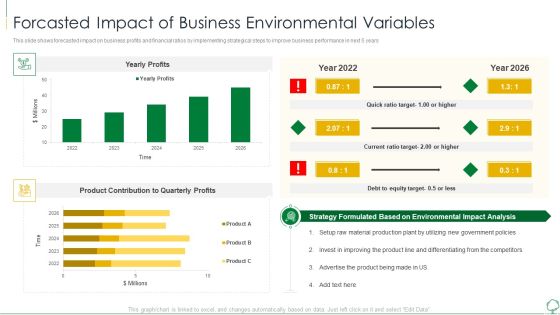
Environmental Examination Tools And Approaches Forcasted Impact Of Business Diagrams PDF
This slide shows forecasted impact on business profits and financial ratios by implementing strategical steps to improve business performance in next 5 years. Deliver an awe inspiring pitch with this creative environmental examination tools and approaches forcasted impact of business diagrams pdf bundle. Topics like product, quarterly profits, material, analysis can be discussed with this completely editable template. It is available for immediate download depending on the needs and requirements of the user.
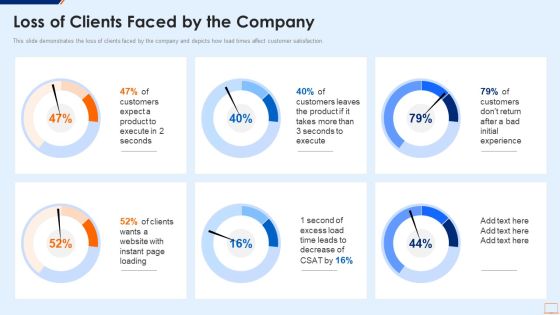
Extreme Programming Methodology IT Loss Of Clients Faced By The Company Diagrams PDF
This slide demonstrates the loss of clients faced by the company and depicts how load times affect customer satisfaction.Deliver an awe inspiring pitch with this creative extreme programming methodology it loss of clients faced by the company diagrams pdf bundle. Topics like customers expect, customers leaves the product, second of excess can be discussed with this completely editable template. It is available for immediate download depending on the needs and requirements of the user.

Implementation Plan For New Product Launch Addressing Product Life Cycle Stages Diagrams PDF
This slide shows product life cycle with stage specification and marketing strategies. Stages covered here are product introduction, growth, maturity and decline stage. Deliver an awe inspiring pitch with this creative implementation plan for new product launch addressing product life cycle stages diagrams pdf bundle. Topics like advertising, pricing, awareness, customer can be discussed with this completely editable template. It is available for immediate download depending on the needs and requirements of the user.

Execution Of ERP System To Enhance Business Effectiveness Current Real Time Diagrams PDF
This slide shows the current Real Time Data Accessibility status of the company in terms of accessible and not accessible.Deliver an awe inspiring pitch with this creative Execution of erp system to enhance business effectiveness current real time diagrams pdf bundle. Topics like integrated erp system, intelligence and proactive, terms of accessible can be discussed with this completely editable template. It is available for immediate download depending on the needs and requirements of the user.
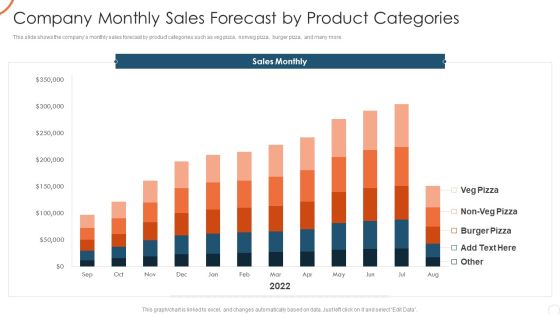
Corporate Strategy For Business Development Company Monthly Sales Forecast Diagrams PDF
This slide shows the companys monthly sales forecast by product categories such as veg pizza, nonveg pizza, burger pizza, and many more. Deliver an awe inspiring pitch with this creative corporate strategy for business development company monthly sales forecast diagrams pdf bundle. Topics like company monthly sales forecast by product categories can be discussed with this completely editable template. It is available for immediate download depending on the needs and requirements of the user.

Company Monthly Sales Forecast By Product Categories Start Up Master Plan Diagrams PDF
This slide shows the companys monthly sales forecast by product categories such as veg pizza, nonveg pizza, burger pizza, and many more.Deliver and pitch your topic in the best possible manner with this company monthly sales forecast by product categories start up master plan diagrams pdf Use them to share invaluable insights on company monthly sales forecast by product categories and impress your audience. This template can be altered and modified as per your expectations. So, grab it now.
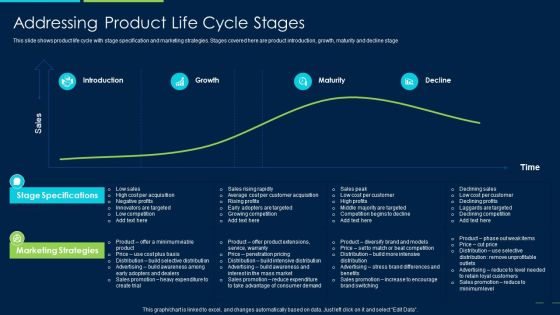
Marketing Strategy New Product Introduction Addressing Product Life Cycle Stages Diagrams PDF
This slide shows product life cycle with stage specification and marketing strategies. Stages covered here are product introduction, growth, maturity and decline stage Deliver an awe inspiring pitch with this creative marketing strategy new product introduction addressing product life cycle stages diagrams pdf bundle. Topics like addressing product life cycle stages can be discussed with this completely editable template. It is available for immediate download depending on the needs and requirements of the user.
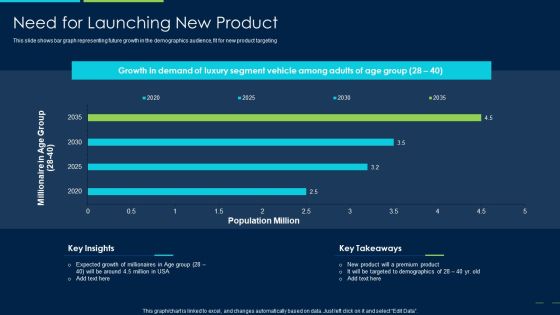
Marketing Strategy New Product Introduction Need For Launching New Product Diagrams PDF
This slide shows bar graph representing future growth in the demographics audience, fit for new product targeting Deliver an awe inspiring pitch with this creative marketing strategy new product introduction need for launching new product diagrams pdf bundle. Topics like need for launching new product can be discussed with this completely editable template. It is available for immediate download depending on the needs and requirements of the user.
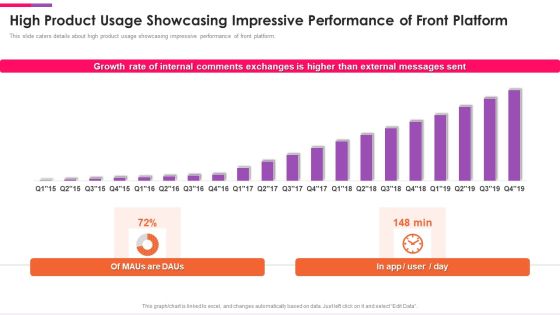
Front Series C Capital Raising Pitch Deck High Product Usage Showcasing Impressive Diagrams PDF
This slide caters details about high product usage showcasing impressive performance of front platform. Deliver an awe inspiring pitch with this creative front series c capital raising pitch deck high product usage showcasing impressive diagrams pdf bundle. Topics like high product usage showcasing impressive performance of front platform can be discussed with this completely editable template. It is available for immediate download depending on the needs and requirements of the user.
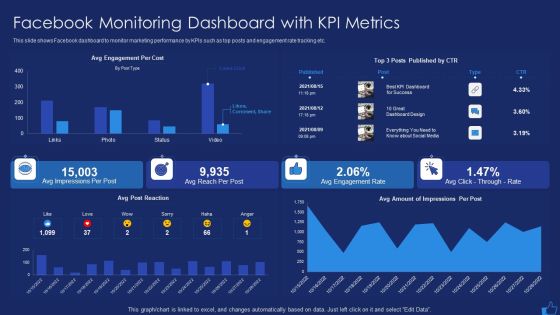
Facebook Advertising Plan For Demand Generation Facebook Monitoring Dashboard With KPI Metrics Diagrams PDF
This slide shows Facebook dashboard to monitor marketing performance by KPIs such as top posts and engagement rate tracking etc. Deliver an awe inspiring pitch with this creative facebook advertising plan for demand generation facebook monitoring dashboard with kpi metrics diagrams pdf bundle. Topics like facebook monitoring dashboard with kpi metrics can be discussed with this completely editable template. It is available for immediate download depending on the needs and requirements of the user.
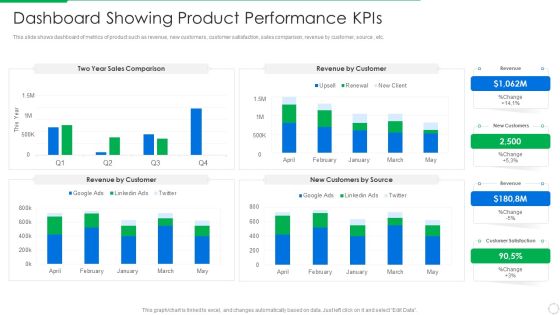
PLM Execution In Company Dashboard Showing Product Performance Kpis Diagrams PDF
This slide shows dashboard of metrics of product such as revenue, new customers, customer satisfaction, sales comparison, revenue by customer, source , etc. Deliver and pitch your topic in the best possible manner with this plm execution in company dashboard showing product performance kpis diagrams pdf . Use them to share invaluable insights on dashboard showing product performance kpis and impress your audience. This template can be altered and modified as per your expectations. So, grab it now.

Enhancing Hospital Software System Hospital Performance Dashboard To Improve Operations Diagrams PDF
This slide focuses on the hospital performance dashboard to improve operations which covers total patients, operational expenses, patient satisfaction, average waiting time, staff per department, etc. Deliver an awe inspiring pitch with this creative enhancing hospital software system hospital performance dashboard to improve operations diagrams pdf bundle. Topics like hospital performance dashboard to improve operations can be discussed with this completely editable template. It is available for immediate download depending on the needs and requirements of the user.

Master Plan For Opening Bistro Coffee Shop Break Even Analysis Diagrams PDF
This slide shows the coffee shop break even analysis which includes the graph and description. Deliver an awe inspiring pitch with this creative master plan for opening bistro coffee shop break even analysis diagrams pdf bundle. Topics like coffee shop break even analysis can be discussed with this completely editable template. It is available for immediate download depending on the needs and requirements of the user.

Master Plan For Opening Bistro Coffee Shop Business Dashboard Diagrams PDF
This slide shows the coffee shop business dashboard which includes profit by state, average sales by month, profit, sales by product type, etc. Deliver an awe inspiring pitch with this creative master plan for opening bistro coffee shop business dashboard diagrams pdf bundle. Topics like coffee shop business dashboard can be discussed with this completely editable template. It is available for immediate download depending on the needs and requirements of the user.

Examining Price Optimization Organization Impact On Customers Due To Poor Product Pricing Strategy Diagrams PDF
This slide covers the high customer churn rate in the company due to poor product pricing strategy involved within the organization.Deliver and pitch your topic in the best possible manner with this examining price optimization organization impact on customers due to poor product pricing strategy diagrams pdf. Use them to share invaluable insights on impact on customers due to poor product pricing strategy and impress your audience. This template can be altered and modified as per your expectations. So, grab it now.
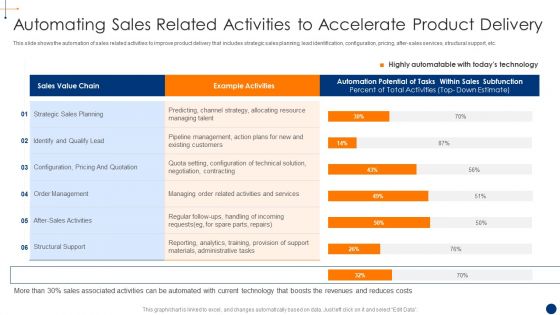
New Product Development Process Optimization Automating Sales Related Activities Diagrams PDF
This slide shows the automation of sales related activities to improve product delivery that includes strategic sales planning, lead identification, configuration, pricing, after sales services, structural support, etc. Deliver an awe inspiring pitch with this creative new product development process optimization automating sales related activities diagrams pdf bundle. Topics like automating sales related activities to accelerate product delivery can be discussed with this completely editable template. It is available for immediate download depending on the needs and requirements of the user.

B2B Customers Journey Playbook B2b Prospects Performance Measurement Dashboard Diagrams PDF
This slide provides information regarding B2B performance tracking dashboard to measure leads, MQL, SQL, customers, revenue goals, total media spend. Deliver an awe inspiring pitch with this creative b2b customers journey playbook b2b prospects performance measurement dashboard diagrams pdf bundle. Topics like b2b prospects performance measurement dashboard can be discussed with this completely editable template. It is available for immediate download depending on the needs and requirements of the user.

Responsibilities Project Management Office Implementing Digitalization Increase In Project Revenue Diagrams PDF
This slide shows the graphical presentation of increase in revenue and productivity of the project from Q1 2022 to Q4 2022, after shifting the PMO priorities Deliver and pitch your topic in the best possible manner with this responsibilities project management office implementing digitalization increase in project revenue diagrams pdf. Use them to share invaluable insights on increase in project revenue and productivity and impress your audience. This template can be altered and modified as per your expectations. So, grab it now.

Fiverr Capital Raising Pitch Deck Market Opportunity Of Fiverr Diagrams PDF
This slide provides details regarding the market opportunity of the company showing total addressable market, estimated US total freelance income and multiple service categories. Deliver an awe inspiring pitch with this creative fiverr capital raising pitch deck market opportunity of fiverr diagrams pdf bundle. Topics like fiverr has a large market opportunity, service categories can be discussed with this completely editable template. It is available for immediate download depending on the needs and requirements of the user.
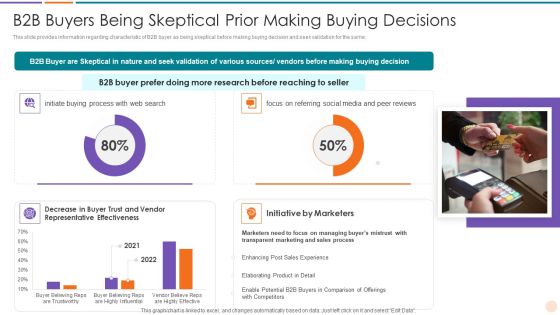
Improving Lead Generation B2B Buyers Being Skeptical Prior Making Buying Decisions Diagrams PDF
This slide provides information regarding characteristic of B2B buyer as being skeptical before making buying decision and seek validation for the same. Deliver and pitch your topic in the best possible manner with this improving lead generation b2b buyers being skeptical prior making buying decisions diagrams pdf. Use them to share invaluable insights on initiative by marketers, b2b buyer prefer, 2021 to 2022 and impress your audience. This template can be altered and modified as per your expectations. So, grab it now.
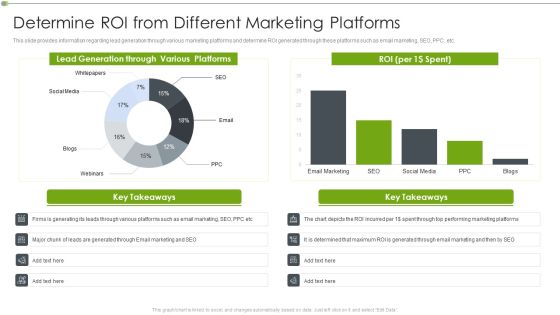
Ways To Retain Consumer Through Strategic Marketing Determine ROI From Different Marketing Platforms Diagrams PDF
This slide provides information regarding lead generation through various marketing platforms and determine ROI generated through these platforms such as email marketing, SEO, PPC, etc. Deliver an awe inspiring pitch with this creative ways to retain consumer through strategic marketing determine roi from different marketing platforms diagrams pdf bundle. Topics like determine roi from different marketing platforms can be discussed with this completely editable template. It is available for immediate download depending on the needs and requirements of the user.

Application Development Ios Vs Android Market Share From 2012Q1 2021Q1 Diagrams PDF
This slide represents the market shares of iOS and android from 2012Q1 to 2021Q1which shows that iOS had the more significant market share in 2021.Deliver an awe inspiring pitch with this creative Application Development Ios Vs Android Market Share From 2012Q1 2021Q1 Diagrams PDF bundle. Topics like Ios Vs Android Market Share From 2012Q1 To 2021Q1 can be discussed with this completely editable template. It is available for immediate download depending on the needs and requirements of the user.
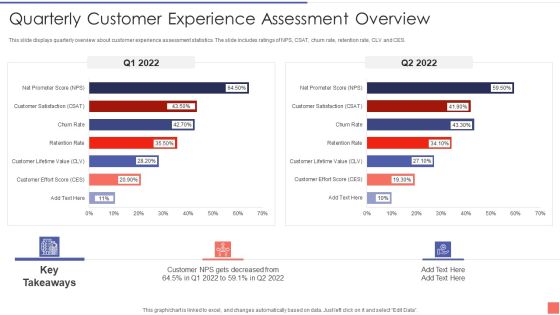
Providing Electronic Financial Services To Existing Consumers Quarterly Customer Experience Diagrams PDF
This slide displays quarterly overview about customer experience assessment statistics. The slide includes ratings of NPS, CSAT, churn rate, retention rate, CLV and CES. Deliver and pitch your topic in the best possible manner with this Providing Electronic Financial Services To Existing Consumers Quarterly Customer Experience Diagrams PDF. Use them to share invaluable insights on Quarterly Customer Experience Assessment Overview and impress your audience. This template can be altered and modified as per your expectations. So, grab it now.
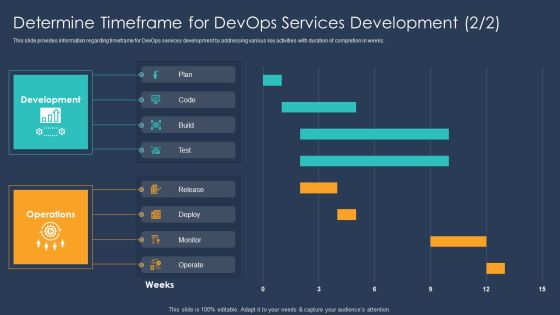
Devops Implementation And Advisory Proposal IT Determine Timeframe For Devops Services Diagrams PDF
This slide provides information regarding timeframe for DevOps services development by addressing various key activities with duration of completion in weeks. Deliver and pitch your topic in the best possible manner with this Devops Implementation And Advisory Proposal IT Determine Timeframe For Devops Services Diagrams PDF. Use them to share invaluable insights on Determine Timeframe For Devops Services Development and impress your audience. This template can be altered and modified as per your expectations. So, grab it now.

Innovation Procedure For Online Business Digital Transformation Change Management Diagrams PDF
Purpose of the following slide is to show the digital transformation change management dashboard as it highlights the percentage of digital transformation and the transformation one by priority Deliver and pitch your topic in the best possible manner with this Innovation Procedure For Online Business Digital Transformation Change Management Diagrams PDF Use them to share invaluable insights on Digital Transformation Change Management Dashboard and impress your audience. This template can be altered and modified as per your expectations. So, grab it now.
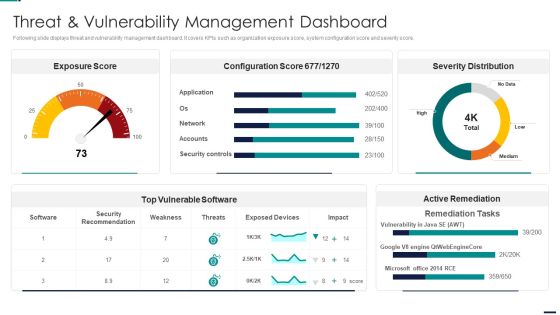
Risk Management Model For Data Security Threat And Vulnerability Management Dashboard Diagrams PDF
Following slide displays threat and vulnerability management dashboard. It covers KPIs such as organization exposure score, system configuration score and severity score. Deliver an awe inspiring pitch with this creative Risk Management Model For Data Security Threat And Vulnerability Management Dashboard Diagrams PDF bundle. Topics like Exposure Score, Configuration Score, Severity Distribution, Top Vulnerable Software, Active Remediation can be discussed with this completely editable template. It is available for immediate download depending on the needs and requirements of the user.
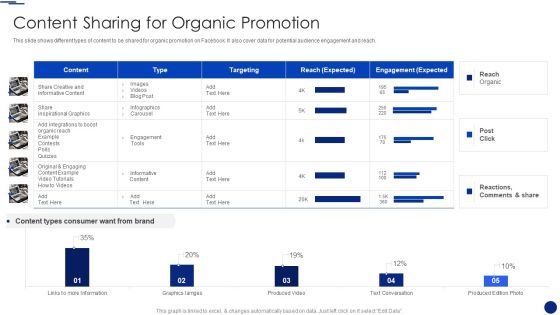
Social Media Marketing Through Facebook Content Sharing For Organic Promotion Diagrams PDF
This slide shows different types of content to be shared for organic promotion on Facebook. It also cover data for potential audience engagement and reach. Deliver and pitch your topic in the best possible manner with this Social Media Marketing Through Facebook Content Sharing For Organic Promotion Diagrams PDF. Use them to share invaluable insights on Content Sharing, Organic Promotion, Engagement and impress your audience. This template can be altered and modified as per your expectations. So, grab it now.

Information Technology Firm Report Example Companys Segment Financials And Revenue Split Diagrams PDF
The slide provides the companys revenue for last three years from three operating segments software for business customers, hardware products, and entertainment.Deliver and pitch your topic in the best possible manner with this Information Technology Firm Report Example Companys Segment Financials And Revenue Split Diagrams PDF Use them to share invaluable insights on Companys Segment, Financials Revenue, Split and impress your audience. This template can be altered and modified as per your expectations. So, grab it now.
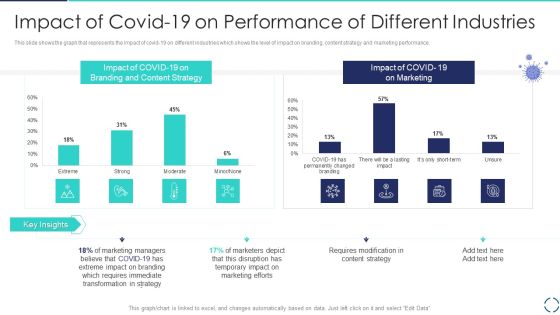
Optimizing E Business Promotion Plan Impact Of Covid 19 On Performance Of Different Industries Diagrams PDF
This slide shows the graph that represents the impact of covid 19 on different industries which shows the level of impact on branding, content strategy and marketing performance. Deliver an awe inspiring pitch with this creative Optimizing E Business Promotion Plan Impact Of Covid 19 On Performance Of Different Industries Diagrams PDF bundle. Topics like Strategy, Marketing, Branding can be discussed with this completely editable template. It is available for immediate download depending on the needs and requirements of the user.
Employees Performance Assessment And Appraisal Determine Employee Performance Tracker Dashboard Diagrams PDF
This slide provides information about employee performance tracker dashboard which covers details in context to employee training, etc.Deliver and pitch your topic in the best possible manner with this Employees Performance Assessment And Appraisal Determine Employee Performance Tracker Dashboard Diagrams PDF Use them to share invaluable insights on Needs Improvement, Current Quarterly, Outstanding and impress your audience. This template can be altered and modified as per your expectations. So, grab it now.

Employee Stress Management Methods Stress Management Dashboard With Wellness Diagrams PDF
This slide highlights the stress management dashboard which showcases the perceived stress scale, heart rate, blood pressure, sleep quality and employee wellness.Deliver an awe inspiring pitch with this creative Employee Stress Management Methods Stress Management Dashboard With Wellness Diagrams PDF bundle. Topics like Perceived Stress, Heart Variability, Blood Pressure can be discussed with this completely editable template. It is available for immediate download depending on the needs and requirements of the user.
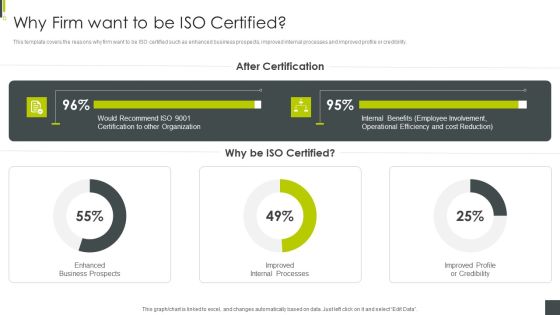
ISO 9001 Certification Procedure Why Firm Want To Be ISO Certified Diagrams PDF
This template covers the reasons why firm want to be ISO certified such as enhanced business prospects, improved internal processes and improved profile or credibility. Deliver an awe inspiring pitch with this creative ISO 9001 Certification Procedure Why Firm Want To Be ISO Certified Diagrams PDF bundle. Topics like Enhanced Business Prospects, Improved Internal Processes, Improved Profile Credibility can be discussed with this completely editable template. It is available for immediate download depending on the needs and requirements of the user.

Organization Stress Administration Practices Stress Management Dashboard With Wellness Diagrams PDF
This slide highlights the stress management dashboard which showcases the perceived stress scale, heart rate, blood pressure, sleep quality and employee wellness.Deliver an awe inspiring pitch with this creative Organization Stress Administration Practices Stress Management Dashboard With Wellness Diagrams PDF bundle. Topics like Perceived Stress, Heart Variability, Blood Pressure can be discussed with this completely editable template. It is available for immediate download depending on the needs and requirements of the user.
Enhanced Workforce Effectiveness Structure Determine Employee Performance Tracker Dashboard Diagrams PDF
This slide provides information about employee performance tracker dashboard which covers details in context to employee training, etc.Deliver an awe inspiring pitch with this creative Enhanced Workforce Effectiveness Structure Determine Employee Performance Tracker Dashboard Diagrams PDF bundle. Topics like Current Quarterly, Outstanding, Needs Improvement can be discussed with this completely editable template. It is available for immediate download depending on the needs and requirements of the user.

IT Security Risk Management Approach Introduction Determining The Priority Requirements Diagrams PDF
This slide demonstrates the priority requirements of companies while buying IoT products. Strong cybersecurity is the topmost priority of companies followed by reliability and compatibility. Deliver an awe inspiring pitch with this creative IT Security Risk Management Approach Introduction Determining The Priority Requirements Diagrams PDF bundle. Topics like Development Processes, Technology Environments, Purchasing Iot Products can be discussed with this completely editable template. It is available for immediate download depending on the needs and requirements of the user.

Proactive Method For 5G Deployment By Telecom Companies 5G Emerging As Network Of Opportunity Diagrams PDF
This slide provides details regarding 5G as next generation mobile technology and emerging as network of opportunity catering various need of users, telecom operators, etc. Deliver an awe inspiring pitch with this creative Proactive Method For 5G Deployment By Telecom Companies 5G Emerging As Network Of Opportunity Diagrams PDF bundle. Topics like Consistent Connectivity, Overall Enhancement, Across Geographical can be discussed with this completely editable template. It is available for immediate download depending on the needs and requirements of the user.
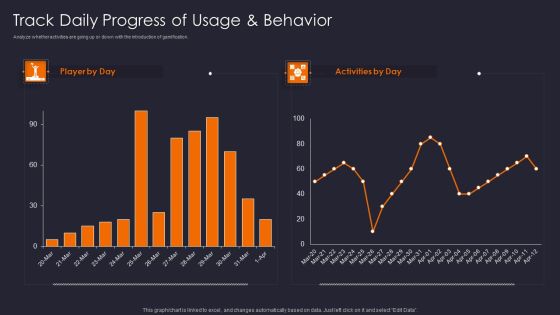
Implementing Gamification Marketing Plan To Increase Conversions Track Daily Progress Of Usage Diagrams PDF
Analyze whether activities are going up or down with the introduction of gamification.Deliver an awe inspiring pitch with this creative Implementing Gamification Marketing Plan To Increase Conversions Track Daily Progress Of Usage Diagrams PDF bundle. Topics like Track Daily, Progress Usage, Behavior can be discussed with this completely editable template. It is available for immediate download depending on the needs and requirements of the user.

Digital Asset Management In Visual World Why Digital Content Diagrams PDF
This slide covers introduction about digital media, how it has evolved till now and facts about social media content etc.Deliver and pitch your topic in the best possible manner with this Digital Asset Management In Visual World Why Digital Content Diagrams PDF Use them to share invaluable insights on Earliest Recorded, Paintings Of Lascaux, Although Distribution and impress your audience. This template can be altered and modified as per your expectations. So, grab it now.

Sales CRM Cloud Solutions Deployment CRM Implementation Dashboard With Customer Diagrams PDF
This slide showcases the dashboard for CRM which includes the revenue, marketing expenses, satisfaction rate, conversion funnel, tickets volume by priority, and expected sales this year.Deliver an awe inspiring pitch with this creative Sales CRM Cloud Solutions Deployment CRM Implementation Dashboard With Customer Diagrams PDF bundle. Topics like Conversion Funnel, Customer Satisfaction, Expected Sales can be discussed with this completely editable template. It is available for immediate download depending on the needs and requirements of the user.

How To Develop Branding And Storytelling With DAM Why Digital Content Diagrams PDF
This slide covers introduction about digital media, how it has evolved till now and facts about social media content etc. Deliver an awe inspiring pitch with this creative How To Develop Branding And Storytelling With DAM Why Digital Content Diagrams PDF bundle. Topics like Produced Digital, Printed And Distributed, Medium Of Communication can be discussed with this completely editable template. It is available for immediate download depending on the needs and requirements of the user.
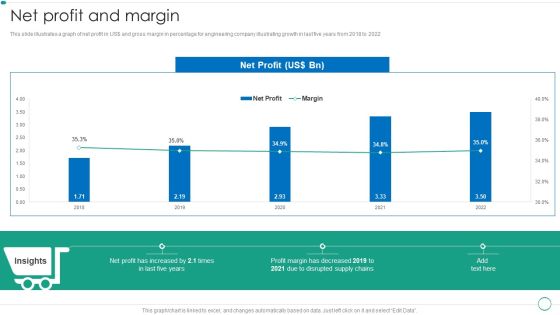
Real Estate Construction And Engineering Company Profile Net Profit And Margin Diagrams PDF
This slide illustrates a graph of net profit in US and gross margin in percentage for engineering company illustrating growth in last five years from 2018 to 2022.Deliver an awe inspiring pitch with this creative Real Estate Construction And Engineering Company Profile Net Profit And Margin Diagrams PDF bundle. Topics like Disrupted Supply, Profit Margin, Increased can be discussed with this completely editable template. It is available for immediate download depending on the needs and requirements of the user.

Current Situation Decrease In Year Over Year Revenue Generation Diagrams PDF
This slide covers revenue generation statistics of the firm over past three years. It also depicts that revenue recorded in FY21 was dollar2070 as compared to dollar4720 in FY19.Deliver an awe inspiring pitch with this creative Current Situation Decrease In Year Over Year Revenue Generation Diagrams PDF bundle. Topics like Revenue Generated, Gets Decreased, Key Takeaways can be discussed with this completely editable template. It is available for immediate download depending on the needs and requirements of the user.

Top Cyber Risks Faced By The Real Estate Company Diagrams PDF
The following slide exhibits four cyber risks which are faced by the real estate organization. It provides key information about the ransomware, phishing, web-based attack and email fraud attack. Deliver an awe inspiring pitch with this creative Top Cyber Risks Faced By The Real Estate Company Diagrams PDF bundle. Topics like Ransomware Business Compromise, Businesses Currently can be discussed with this completely editable template. It is available for immediate download depending on the needs and requirements of the user.

Computer Simulation Human Thinking Tracking Essential Virtual Agents Activities Dashboard Diagrams PDF
This slide provides information regarding virtual agents essential activities dashboard in terms of daily number of new conversation, unique users weekly conversations by channel, etc. Deliver an awe inspiring pitch with this creative Computer Simulation Human Thinking Tracking Essential Virtual Agents Activities Dashboard Diagrams PDF bundle. Topics like Unique Users, Weekly Conversations Channel, Weekly Conversations Topic can be discussed with this completely editable template. It is available for immediate download depending on the needs and requirements of the user.
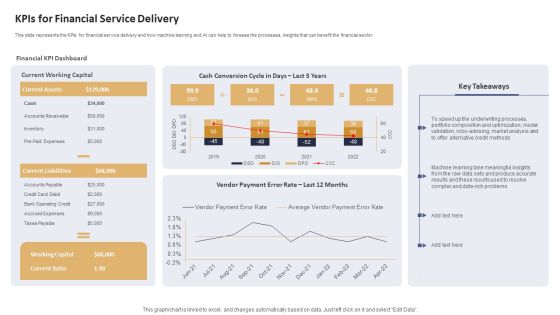
Data Processing Services Delivery Kpis For Financial Service Delivery Diagrams PDF
This slide represents the KPIs for financial service delivery and how machine learning and AI can help to foresee the processes, insights that can benefit the financial sector. Deliver an awe inspiring pitch with this creative Data Processing Services Delivery Kpis For Financial Service Delivery Diagrams PDF bundle. Topics like Financial KPI Dashboard, Current Working Capital, Cash Conversion can be discussed with this completely editable template. It is available for immediate download depending on the needs and requirements of the user.

Customer Relationship Management Post Implementation Impacts On Business Aspects Diagrams PDF
This slide covers major improvements after CRM software implementation. It includes major impact on areas such as customer retention, customer satisfaction, sales revenue, and upselling cross selling. Deliver and pitch your topic in the best possible manner with this Customer Relationship Management Post Implementation Impacts On Business Aspects Diagrams PDF. Use them to share invaluable insights on Regular Reminders, Customer Retention, Customer Interaction and impress your audience. This template can be altered and modified as per your expectations. So, grab it now.

Agile Sprint Technique In Software Advantages Of Agile Methodology Diagrams PDF
This slide depicts the advantages of agile methodology that include managing changing priorities, project visibility, IT alignment, delivery speed, team morale, increased productivity, and so on.Deliver and pitch your topic in the best possible manner with this Agile Sprint Technique In Software Advantages Of Agile Methodology Diagrams PDF. Use them to share invaluable insights on Software Maintainability, Managing Distributed, Engineering Discipline and impress your audience. This template can be altered and modified as per your expectations. So, grab it now.

Complete Online Marketing Audit Guide Findings Of Social Media Channels Audit Diagrams PDF
This slide highlights the social media audit which showcase the performance grade of presence with Facebook, Instagram, twitter and YouTube detailed audit results, Deliver an awe inspiring pitch with this creative Complete Online Marketing Audit Guide Findings Of Social Media Channels Audit Diagrams PDF bundle. Topics like Engagement Rate, Social Media Presence can be discussed with this completely editable template. It is available for immediate download depending on the needs and requirements of the user.

Complete Online Marketing Audit Guide Website Seo Audit With Page Load Speed Diagrams PDF
This slide highlights the SEO audit which showcases the page score, critical errors, warnings, crawled pages results, site health, hreflang audit and page load speed. Deliver an awe inspiring pitch with this creative Complete Online Marketing Audit Guide Website Seo Audit With Page Load Speed Diagrams PDF bundle. Topics like Website SEO Audit can be discussed with this completely editable template. It is available for immediate download depending on the needs and requirements of the user.

Metrics To Measure Business Performance Effective Rate Metrics By Customer And Offering Diagrams PDF
This slide covers effective rate metrics. It shows over year over comparison of effective rate per customer as well as effective rate per offering. Deliver and pitch your topic in the best possible manner with this Metrics To Measure Business Performance Effective Rate Metrics By Customer And Offering Diagrams PDF. Use them to share invaluable insights on Effective Rate, Per Customer, Per Offering and impress your audience. This template can be altered and modified as per your expectations. So, grab it now.

B2B Sales Techniques Playbook B2B Sales Representatives Performance Tracking Dashboard Diagrams PDF
This slide provides information regarding B2B sales representatives performance tracking dashboard to measure leads by region, revenue breakdown, top performers by leads, revenues, etc. Deliver and pitch your topic in the best possible manner with this B2B Sales Techniques Playbook B2B Sales Representatives Performance Tracking Dashboard Diagrams PDF. Use them to share invaluable insights on Combine Sales, Individual Performance, Achieved Highest and impress your audience. This template can be altered and modified as per your expectations. So, grab it now.

Dashboard For Big Data Management Ppt PowerPoint Presentation File Diagrams PDF
This slide represents the dashboards for big data deployment by covering details of visitors and return visitors, subscribers, top 3 articles by readers, avg duration, and pages per visit. Deliver an awe inspiring pitch with this creative Dashboard For Big Data Management Ppt PowerPoint Presentation File Diagrams PDF bundle. Topics like Dashboard, Big Data Management can be discussed with this completely editable template. It is available for immediate download depending on the needs and requirements of the user.
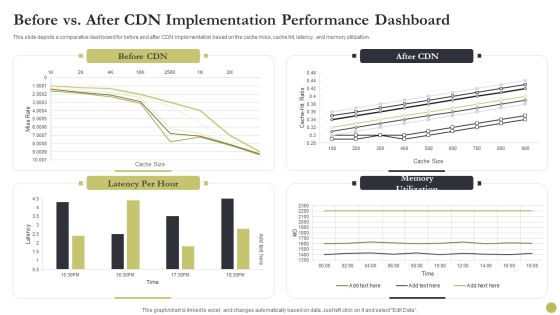
Content Delivery Network Edge Server Before Vs After CDN Implementation Performance Dashboard Diagrams PDF
This slide depicts a comparative dashboard for before and after CDN implementation based on the cache miss, cache hit, latency, and memory utilization. Deliver an awe inspiring pitch with this creative Content Delivery Network Edge Server Before Vs After CDN Implementation Performance Dashboard Diagrams PDF bundle. Topics like After Cdn Implementation, Performance Dashboard can be discussed with this completely editable template. It is available for immediate download depending on the needs and requirements of the user.
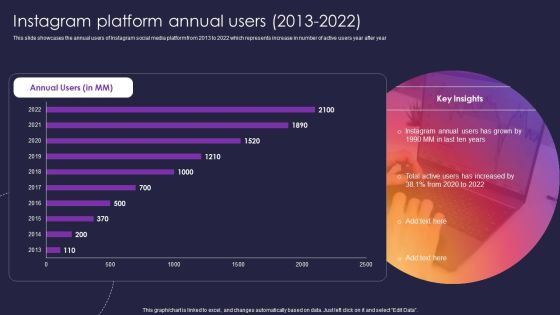
Instagram Company Details Instagram Platform Annual Users 2013 To 2022 Diagrams PDF
This slide showcases the annual users of Instagram social media platform from 2013 to 2022 which represents increase in number of active users year after year. Deliver and pitch your topic in the best possible manner with this Instagram Company Details Instagram Platform Annual Users 2013 To 2022 Diagrams PDF. Use them to share invaluable insights on Instagram Platform Annual Users and impress your audience. This template can be altered and modified as per your expectations. So, grab it now.

Analysis Of Average Wait Time At Retail Store Checkout Counters Retail Outlet Operations Diagrams PDF
The slide visually provides information regarding the average time customer spent at the checkout counter of retail store. It also provides details regarding waiting timings of competitors.Deliver an awe inspiring pitch with this creative Analysis Of Average Wait Time At Retail Store Checkout Counters Retail Outlet Operations Diagrams PDF bundle. Topics like Quarter Customers, Complaints Regarding, Behavior Increased can be discussed with this completely editable template. It is available for immediate download depending on the needs and requirements of the user.

Analysis Of Cleanliness At Retail Store Retail Outlet Operations Performance Evaluation Diagrams PDF
This slide illustrates the graph to showcase visitors responses towards the cleanliness of multiple store areas such as floor, display counters, try rooms etc.Deliver and pitch your topic in the best possible manner with this Analysis Of Cleanliness At Retail Store Retail Outlet Operations Performance Evaluation Diagrams PDF. Use them to share invaluable insights on Retail Store, Visitors Responded, Stores Floors and impress your audience. This template can be altered and modified as per your expectations. So, grab it now.
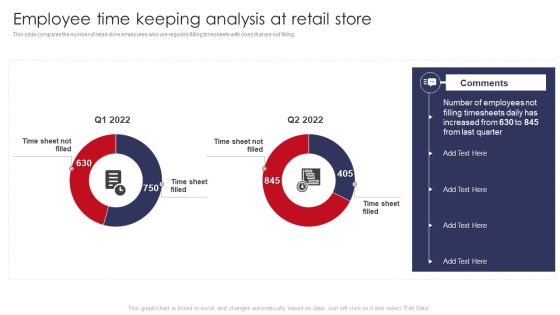
Employee Time Keeping Analysis At Retail Store Retail Outlet Operations Performance Evaluation Diagrams PDF
This slide compares the number of retail store employees who are regularly filling timesheets with ones that are not filling.Deliver an awe inspiring pitch with this creative Employee Time Keeping Analysis At Retail Store Retail Outlet Operations Performance Evaluation Diagrams PDF bundle. Topics like Filling Timesheets, Increased, Last Quarter can be discussed with this completely editable template. It is available for immediate download depending on the needs and requirements of the user.
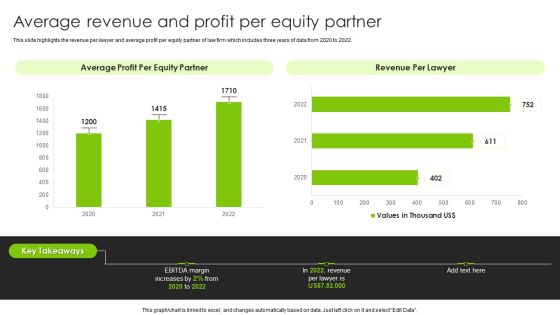
International Legal And Business Services Company Profile Average Revenue And Profit Per Equity Partner Diagrams PDF
This slide highlights the revenue per lawyer and average profit per equity partner of law firm which includes three years of data from 2020 to 2022. Deliver an awe inspiring pitch with this creative International Legal And Business Services Company Profile Average Revenue And Profit Per Equity Partner Diagrams PDF bundle. Topics like Revenue Per Lawyer, Average Profit, Equity Partner can be discussed with this completely editable template. It is available for immediate download depending on the needs and requirements of the user.
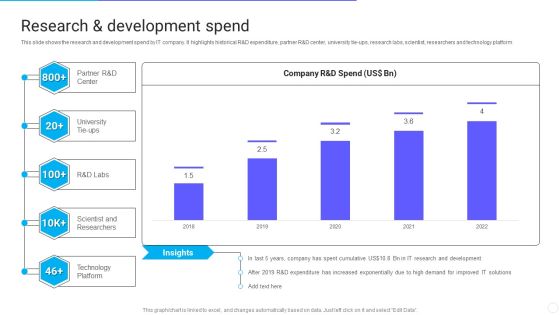
IT Application Services Company Outline Research And Development Spend Diagrams PDF
This slide shows the research and development spend by IT company. It highlights historical R and D expenditure, partner R and D center, university tie ups, research labs, scientist, researchers and technology platform. Deliver an awe inspiring pitch with this creative IT Application Services Company Outline Research And Development Spend Diagrams PDF bundle. Topics like Expenditure, Demand, Development can be discussed with this completely editable template. It is available for immediate download depending on the needs and requirements of the user.

Vendor Procurement Cycle And Expenses Management Dashboard Vendor Management Strategies Diagrams PDF
The following slide illustrates supplier procurement cycle and expenses management dashboard. It provides information about conracted, unlisted, top suppliers, spending, savings, procurement cycle time, etc.Deliver an awe inspiring pitch with this creative Vendor Procurement Cycle And Expenses Management Dashboard Vendor Management Strategies Diagrams PDF bundle. Topics like Contracted, Unlisted, Vendors Procurement can be discussed with this completely editable template. It is available for immediate download depending on the needs and requirements of the user.
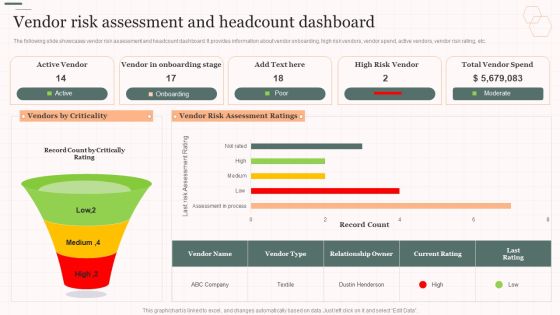
Vendor Risk Assessment And Headcount Dashboard Vendor Management Strategies Diagrams PDF
The following slide showcases vendor risk assessment and headcount dashboard. It provides information about vendor onboarding, high risk vendors, vendor spend, active vendors, vendor risk rating, etc. Deliver and pitch your topic in the best possible manner with this Vendor Risk Assessment And Headcount Dashboard Vendor Management Strategies Diagrams PDF. Use them to share invaluable insights on Assessment Ratings, Vendors Criticality, Vendor Onboarding and impress your audience. This template can be altered and modified as per your expectations. So, grab it now.

Strategic Management Consultancy Business Profile Employee Count And Breakdown Diagrams PDF
This slide represents the employee count for last five years from 2018 to 2022. It also includes employee split by geography and gender. Deliver an awe inspiring pitch with this creative Strategic Management Consultancy Business Profile Employee Count And Breakdown Diagrams PDF bundle. Topics like Employee Split By Gender, Employee Split By Geography, Employee Count can be discussed with this completely editable template. It is available for immediate download depending on the needs and requirements of the user.
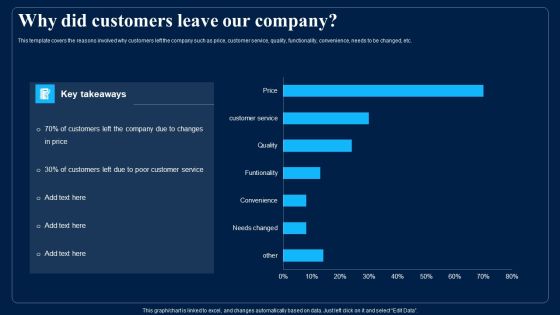
Identifying Optimum Pricing Methods For Business Why Did Customers Leave Our Company Diagrams PDF
This template covers the reasons involved why customers left the company such as price, customer service, quality, functionality, convenience, needs to be changed, etc. Deliver and pitch your topic in the best possible manner with this Identifying Optimum Pricing Methods For Business Why Did Customers Leave Our Company Diagrams PDF. Use them to share invaluable insights on Quality, Customer Service, Price and impress your audience. This template can be altered and modified as per your expectations. So, grab it now.

Organizational Change Management Process Flow Dashboard Ppt PowerPoint Presentation Diagram PDF
This slide covers Business change management lifecycle dashboard. It involves overall health, customer data, financials and operational efficiency. Pitch your topic with ease and precision using this Organizational Change Management Process Flow Dashboard Ppt PowerPoint Presentation Diagram PDF. This layout presents information on Financial Data, Operational Efficiency, Consumer Data. It is also available for immediate download and adjustment. So, changes can be made in the color, design, graphics or any other component to create a unique layout.
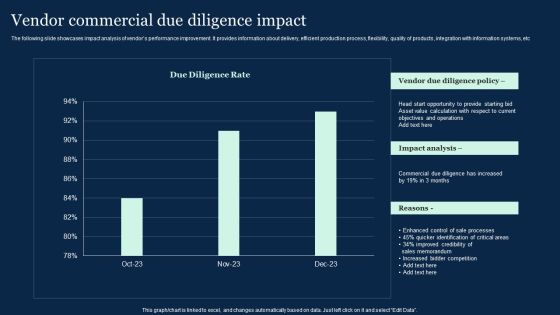
Vendor Commercial Due Diligence Impact Effective Vendor Management For Enhancing Diagrams PDF
The following slide showcases impact analysis of vendors performance improvement. It provides information about delivery, efficient production process, flexibility, quality of products, integration with information systems, etc. There are so many reasons you need a Vendor Commercial Due Diligence Impact Effective Vendor Management For Enhancing Diagrams PDF. The first reason is you can not spend time making everything from scratch, Thus, Slidegeeks has made presentation templates for you too. You can easily download these templates from our website easily.

Target Customer Analysis Evaluating Growth Rate Of Target Market Diagrams PDF
This slide showcases graph that can help organization to evaluate growth rate of target market. It can help company to identify potential and suitability of target market for expanding operations globally. There are so many reasons you need a Target Customer Analysis Evaluating Growth Rate Of Target Market Diagrams PDF. The first reason is you cant spend time making everything from scratch, Thus, Slidegeeks has made presentation templates for you too. You can easily download these templates from our website easily.

Boosting Customer Base Through Effective Dashboard Depicting Customer Service Insights Diagrams PDF
This slide shows the dashboard that depicts customer service insights which includes number of solved tickets, average resolution and response time, customer feedback, total visitors and chats. There are so many reasons you need a Boosting Customer Base Through Effective Dashboard Depicting Customer Service Insights Diagrams PDF. The first reason is you cant spend time making everything from scratch, Thus, Slidegeeks has made presentation templates for you too. You can easily download these templates from our website easily.
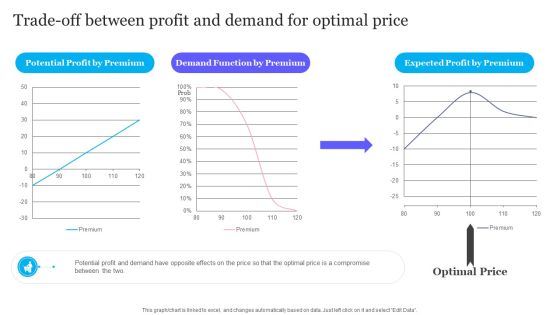
Trade Off Between Profit And Demand For Optimal Price Diagrams PDF
From laying roadmaps to briefing everything in detail, our templates are perfect for you. You can set the stage with your presentation slides. All you have to do is download these easy to edit and customizable templates. Trade Off Between Profit And Demand For Optimal Price Diagrams PDF will help you deliver an outstanding performance that everyone would remember and praise you for. Do download this presentation today.
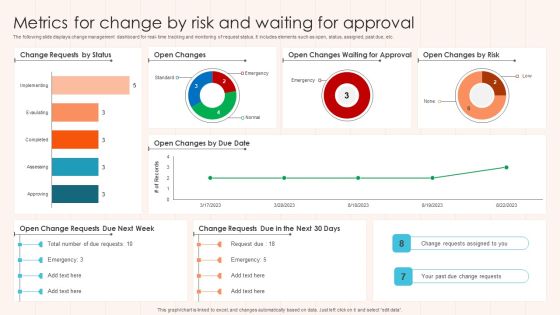
Metrics For Change By Risk And Waiting For Approval Diagrams PDF
The following slide displays change management dashboard for real- time tracking and monitoring of request status. It includes elements such as open, status, assigned, past due, etc. Pitch your topic with ease and precision using this Metrics For Change By Risk And Waiting For Approval Diagrams PDF This layout presents information on Approval, Risk, Status. It is also available for immediate download and adjustment. So, changes can be made in the color, design, graphics or any other component to create a unique layout.

Analyzing Impact Of Performance Marketing Campaigns Ppt PowerPoint Presentation Diagram Images PDF
This slide showcases impact of performance marketing campaigns which can help organization to evaluate the effectiveness of executed plan. Its key elements are website traffic and product sales There are so many reasons you need a Analyzing Impact Of Performance Marketing Campaigns Ppt PowerPoint Presentation Diagram Images PDF. The first reason is you cannot spend time making everything from scratch, Thus, Slidegeeks has made presentation templates for you too. You can easily download these templates from our website easily.

Best Time And Day To Post Content On Facebook Ppt PowerPoint Presentation Diagram Templates PDF
The following slide outlines optimal time and day of week when brands should publish content on Facebook page to reach and engage with maximum number of people. Posting content at right time can assist companies in increasing organic reach and customer engagement. Presenting this PowerPoint presentation, titled Best Time And Day To Post Content On Facebook Ppt PowerPoint Presentation Diagram Templates PDF, with topics curated by our researchers after extensive research. This editable presentation is available for immediate download and provides attractive features when used. Download now and captivate your audience. Presenting this Best Time And Day To Post Content On Facebook Ppt PowerPoint Presentation Diagram Templates PDF. Our researchers have carefully researched and created these slides with all aspects taken into consideration. This is a completely customizable Best Time And Day To Post Content On Facebook Ppt PowerPoint Presentation Diagram Templates PDF that is available for immediate downloading. Download now and make an impact on your audience. Highlight the attractive features available with our PPTs.

Cryptocurrency Mining Methods With Estimated Operations Cost Information PDF
This slide showcases methods of bitcoin mining that can help organization assess different process on the basis of investment cost recovery and average setup cost. Its four methods are cloud mining, CPU mining, GPU mining and ASIC mining Presenting Cryptocurrency Mining Methods With Estimated Operations Cost Information PDF to dispense important information. This template comprises four stages. It also presents valuable insights into the topics including Cloud Mining, Cpu Mining, Gpu Mining. This is a completely customizable PowerPoint theme that can be put to use immediately. So, download it and address the topic impactfully.

Computer Development And Generation Chart Powerpoint Slides
This PPT slide displays graphics of computer devices. Use this PPT design to display technology development and generation. This PowerPoint template can be customized as per requirements of business education or any other theme.

Essential Factors Before Making Funding Decision Ppt PowerPoint Presentation File Model PDF
Presenting Essential Factors Before Making Funding Decision Ppt PowerPoint Presentation File Model PDF to dispense important information. This template comprises one stages. It also presents valuable insights into the topics including Draw Financial Roadmap, Maintain Emergency Fund, Evaluate Risk Tolerance Limit, Consider Rebalancing Portfolio. This is a completely customizable PowerPoint theme that can be put to use immediately. So, download it and address the topic impactfully.
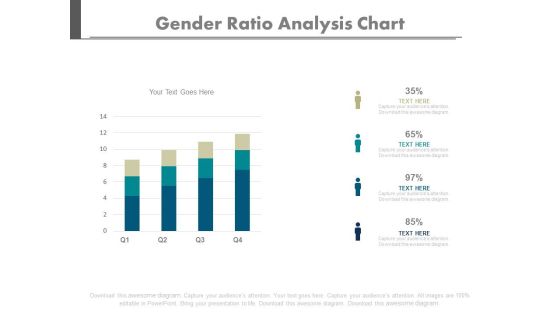
Four Bars Gender Population Ratio Chart Powerpoint Slides
Create dynamic presentations with our creative template of bar graph. This diagram may be used to present gender population. Download this template to leave permanent impression on your audience.
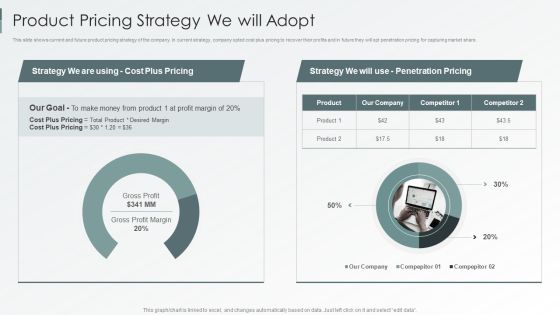
Enterprise Sustainability Performance Metrics Product Pricing Strategy We Will Adopt Brochure PDF
This slide shows current and future product pricing strategy of the company. In current strategy, company opted cost plus pricing to recover their profits and in future they will opt penetration pricing for capturing market share.Deliver and pitch your topic in the best possible manner with this Enterprise Sustainability Performance Metrics Product Pricing Strategy We Will Adopt Brochure PDF. Use them to share invaluable insights on Competitor, Desired Margin, Money Product and impress your audience. This template can be altered and modified as per your expectations. So, grab it now.

Deploying Online Marketing Key Statistics Associated With Digital Marketing Themes PDF
This slide represents digital marketing statistics that enable marketers to understand market, make marketing related decisions and respond to customer demand. It include SEO, social media, open rate, social selling etc. Boost your pitch with our creative Deploying Online Marketing Key Statistics Associated With Digital Marketing Themes PDF. Deliver an awe-inspiring pitch that will mesmerize everyone. Using these presentation templates you will surely catch everyones attention. You can browse the ppts collection on our website. We have researchers who are experts at creating the right content for the templates. So you dont have to invest time in any additional work. Just grab the template now and use them.
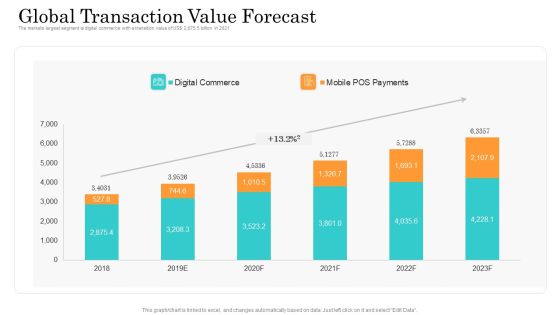
Online Payment Service Global Transaction Value Forecast Ppt Infographics Ideas PDF
The markets largest segment is digital commerce with a transition value of US dollar 2,875.5 billion in 2021. Deliver an awe-inspiring pitch with this creative online payment service global transaction value forecast ppt infographics ideas pdf bundle. Topics like global transaction value forecast can be discussed with this completely editable template. It is available for immediate download depending on the needs and requirements of the user.

Advancement Of Retail Store In Future Challenges Faced By Retailers At Present Pictures PDF
This slide provides information regarding challenges faced by retailers at current times and challenges associated to on demand consumer characteristics. Deliver an awe inspiring pitch with this creative advancement of retail store in future challenges faced by retailers at present pictures pdf bundle. Topics like maintaining, commoditization, awareness, e commerce can be discussed with this completely editable template. It is available for immediate download depending on the needs and requirements of the user.

Advance IT Service Delivery Kpis For Service Delivery Sales And Marketing Formats PDF
This slide describes how sales and marketing will be boost by incorporating AI which will further lead to business growth and profits. Deliver and pitch your topic in the best possible manner with this advance it service delivery kpis for service delivery sales and marketing formats pdf. Use them to share invaluable insights on dynamic and personalization, e commerce purchases, time and impress your audience. This template can be altered and modified as per your expectations. So, grab it now.
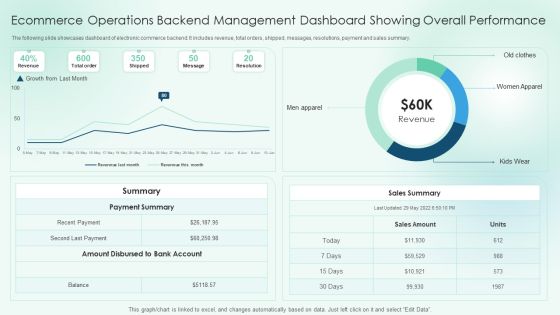
Ecommerce Operations Backend Management Dashboard Showing Overall Performance Slides PDF
The following slide showcases dashboard of electronic commerce backend. It includes revenue, total orders, shipped, messages, resolutions, payment and sales summary.Pitch your topic with ease and precision using this Ecommerce Operations Backend Management Dashboard Showing Overall Performance Slides PDF. This layout presents information on Payment Summary, Amount Disbursed, Sales Summary. It is also available for immediate download and adjustment. So, changes can be made in the color, design, graphics or any other component to create a unique layout.
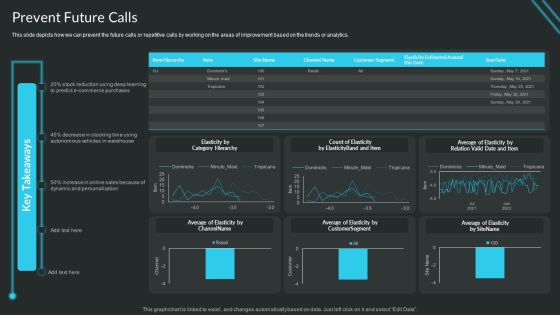
Proactive Consumer Solution And How To Perform It Prevent Future Calls Slide Rules PDF
This slide depicts how we can prevent the future calls or repetitive calls by working on the areas of improvement based on the trends or analytics.Deliver an awe inspiring pitch with this creative Proactive Consumer Solution And How To Perform It Prevent Future Calls Slide Rules PDF bundle. Topics like Commerce Purchases, Autonomous Vehicles, Dynamic Person can be discussed with this completely editable template. It is available for immediate download depending on the needs and requirements of the user.

Logistics Shipment Company Profile Client Distribution By Transportation Orders Demonstration PDF
The slide showcases the client distribution by transportation orders illustrating shipping orders distribution between US government, manufacturing companies, ecommerce services, medical deliveries, private packages, imports and exports. Deliver an awe inspiring pitch with this creative Logistics Shipment Company Profile Client Distribution By Transportation Orders Demonstration PDF bundle. Topics like Shipping Orders, Distribution 2022, Strategic Partnerships, E Commerce Services can be discussed with this completely editable template. It is available for immediate download depending on the needs and requirements of the user.

Expand Total Addressable Market Crm Salesforce Business Profile Clipart PDF
This slide highlights the salesforce total addressable market for sales, service, marketing and commerce, platform and data for financial year 2021 to 2025. Deliver and pitch your topic in the best possible manner with this Expand Total Addressable Market Crm Salesforce Business Profile Clipart PDF. Use them to share invaluable insights on Target, Addressable Market, Growth and impress your audience. This template can be altered and modified as per your expectations. So, grab it now.

Customer Review Snapshot On Apparel Business Ideas PDF
This slide showcases customer review snapshot of women apparel e commerce business. It further covers ratings distribution, pros, best uses and buyer description. Showcasing this set of slides titled Customer Review Snapshot On Apparel Business Ideas PDF. The topics addressed in these templates are Customer Review Snapshot, Apparel Business. All the content presented in this PPT design is completely editable. Download it and make adjustments in color, background, font etc. as per your unique business setting.

Ecommerce Landing Page Conversion Rate Optimization Statistics Sample PDF
This slide depicts conversion rates of e-commerce website visitors to customers based on industries. It includes sports, arts, automotive, apparel, healthcare, kitchen appliances, home accessories, pet care, etc. Showcasing this set of slides titled Ecommerce Landing Page Conversion Rate Optimization Statistics Sample PDF. The topics addressed in these templates are Conversion Rates, Artistic Products, Infant Products. All the content presented in this PPT design is completely editable. Download it and make adjustments in color, background, font etc. as per your unique business setting.
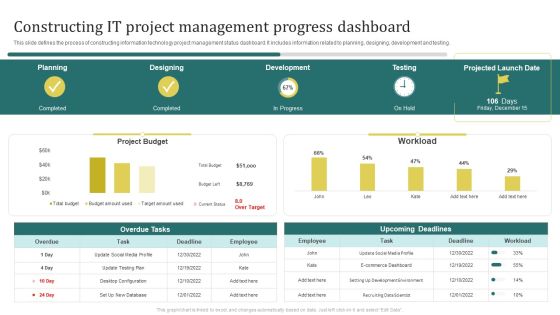
Constructing It Project Management Progress Dashboard Brochure PDF
This slide defines the process of constructing information technology project management status dashboard. It includes information related to planning, designing, development and testing.Pitch your topic with ease and precision using this Constructing It Project Management Progress Dashboard Brochure PDF. This layout presents information on E Commerce Dashboard, Development Environment, Recruiting Data Scientist. It is also available for immediate download and adjustment. So, changes can be made in the color, design, graphics or any other component to create a unique layout.

Actual And Forecasted Corporate Sales Comparison Brochure PDF
This slide shows the comparison of actual and forecasted sales for each quarter of e-commerce products. Actual sales are less then expected due to poor implementation of strategy. Showcasing this set of slides titled Actual And Forecasted Corporate Sales Comparison Brochure PDF. The topics addressed in these templates are Actual And Forecasted, Corporate Sales Comparison. All the content presented in this PPT design is completely editable. Download it and make adjustments in color, background, font etc. as per your unique business setting.
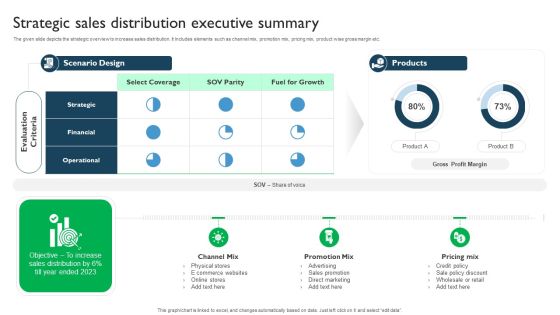
Strategic Sales Distribution Executive Summary Demonstration PDF
The given slide depicts the strategic overview to increase sales distribution. It Includes elements such as channel mix, promotion mix, pricing mix, product wise gross margin etc. Pitch your topic with ease and precision using this Strategic Sales Distribution Executive Summary Demonstration PDF. This layout presents information on E Commerce Websites, Sales Promotion, Advertising. It is also available for immediate download and adjustment. So, changes can be made in the color, design, graphics or any other component to create a unique layout.

Implementation Of An Effective Retail Center Advertising Plan Major Challenges Faced Shopping Formats PDF
This slide represents challenges faced by shopping centers such as decline in foot traffic and customer conversion rate. It includes details regarding e-commerce stores, personalization for products and services. There are so many reasons you need a Implementation Of An Effective Retail Center Advertising Plan Major Challenges Faced Shopping Formats PDF. The first reason is you cannot spend time making everything from scratch, Thus, Slidegeeks has made presentation templates for you too. You can easily download these templates from our website easily.
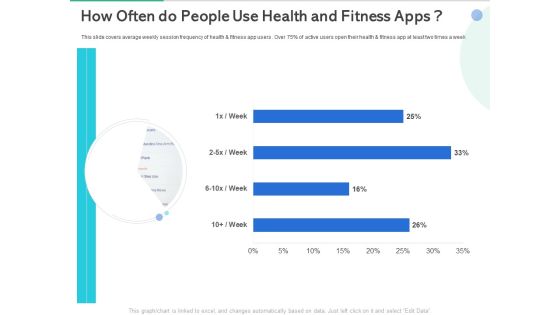
Market Overview Fitness Industry How Often Do People Use Health And Fitness Apps Diagrams PDF
This slide covers average weekly session frequency of health and fitness app users . Over 75 percent of active users open their health and fitness app at least two times a week. Deliver an awe-inspiring pitch with this creative market overview fitness industry how often do people use health and fitness apps diagrams pdf bundle. Topics like people use health and fitness apps can be discussed with this completely editable template. It is available for immediate download depending on the needs and requirements of the user.
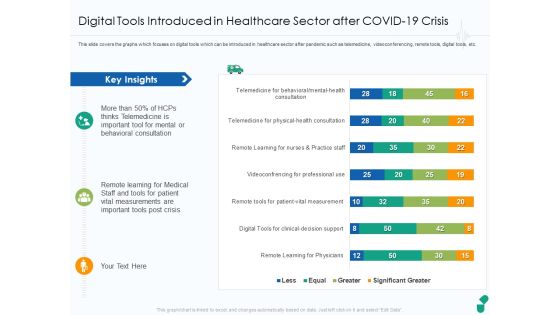
Digital Tools Introduced In Healthcare Sector After COVID 19 Crisis Ppt Outline Diagrams PDF
This slide covers the graphs which focuses on digital tools which can be introduced in healthcare sector after pandemic such as telemedicine, videoconferencing, remote tools, digital tools, etc. Deliver an awe-inspiring pitch with this creative digital tools introduced in healthcare sector after covid 19 crisis ppt outline diagrams pdf bundle. Topics like key insights, patient vital measurements, important tools post crisis, behavioral consultation can be discussed with this completely editable template. It is available for immediate download depending on the needs and requirements of the user.
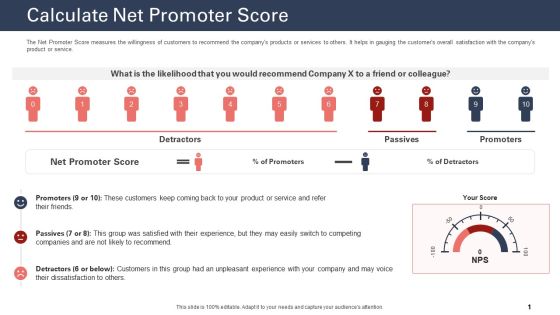
Techniques To Increase Customer Satisfaction Calculate Net Promoter Score Diagrams PDF
The Net Promoter Score measures the willingness of customers to recommend the companys products or services to others. It helps in gauging the customers overall satisfaction with the companys product or service. Deliver an awe inspiring pitch with this creative techniques to increase customer satisfaction calculate net promoter score diagrams pdf bundle. Topics like calculate net promoter score, product or service, net promoter score can be discussed with this completely editable template. It is available for immediate download depending on the needs and requirements of the user.
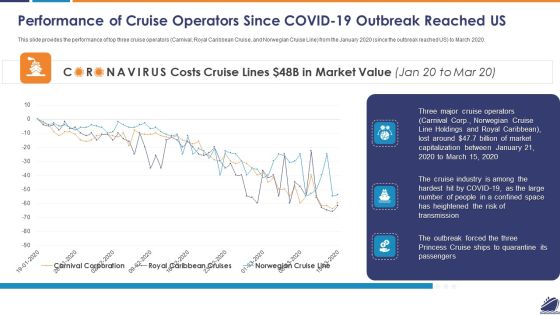
Performance Of Cruise Operators Since COVID 19 Outbreak Reached US Diagrams PDF
This slide provides the performance of top three cruise operators Carnival, Royal Caribbean Cruise, and Norwegian Cruise Line from the January 2020 since the outbreak reached US to March 2020. Deliver an awe inspiring pitch with this creative performance of cruise operators since covid 19 outbreak reached us diagrams pdf bundle. Topics like performance of cruise operators since covid 19 outbreak reached us can be discussed with this completely editable template. It is available for immediate download depending on the needs and requirements of the user.

Sales Department Strategies Increase Revenues Weekly Sales Performance Report Leads Diagrams PDF
The weekly sales reports helps in tracking companies and individuals sales performance and essential KPIs such as lead to opportunity ratio, lead conversion ratio, customer lifetime value. Deliver and pitch your topic in the best possible manner with this sales department strategies increase revenues weekly sales performance report leads diagrams pdf. Use them to share invaluable insights on lead to opportunity ratio, customer lifetime value and impress your audience. This template can be altered and modified as per your expectations. So, grab it now.
