AI PPT Maker
Templates
PPT Bundles
Design Services
Business PPTs
Business Plan
Management
Strategy
Introduction PPT
Roadmap
Self Introduction
Timelines
Process
Marketing
Agenda
Technology
Medical
Startup Business Plan
Cyber Security
Dashboards
SWOT
Proposals
Education
Pitch Deck
Digital Marketing
KPIs
Project Management
Product Management
Artificial Intelligence
Target Market
Communication
Supply Chain
Google Slides
Research Services
 One Pagers
All Categories
-
Home
- Customer Favorites
- Bank Icon
Bank Icon
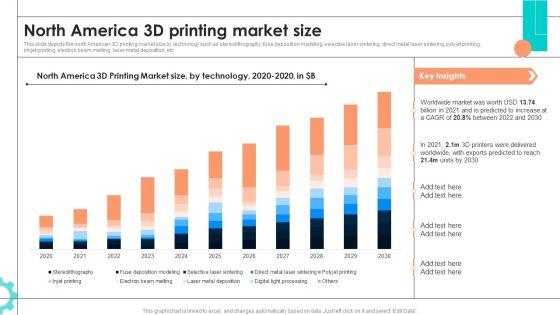
Intelligent Manufacturing North America 3D Printing Market Size Diagrams PDF
This slide depicts the north American 3D printing market size by technology such as stereolithography, fuse deposition modeling, selective laser sintering, direct metal laser sintering, polyjet printing, inkjet printing, electron beam melting, laser metal deposition, etc. Do you have an important presentation coming up Are you looking for something that will make your presentation stand out from the rest Look no further than Intelligent Manufacturing North America 3D Printing Market Size Diagrams PDF. With our professional designs, you can trust that your presentation will pop and make delivering it a smooth process. And with Slidegeeks, you can trust that your presentation will be unique and memorable. So why wait Grab Intelligent Manufacturing North America 3D Printing Market Size Diagrams PDF today and make your presentation stand out from the rest.

Competitive Analysis Of Major Players Existing Across Marketplace Diagrams PDF
This slide provides information regarding comparative analysis of potential players existing across marketplace. The points of differentiation include financial parameters, critical success factors such as product variety, customer services, email marketing, etc. Find highly impressive Competitive Analysis Of Major Players Existing Across Marketplace Diagrams PDF on Slidegeeks to deliver a meaningful presentation. You can save an ample amount of time using these presentation templates. No need to worry to prepare everything from scratch because Slidegeeks experts have already done a huge research and work for you. You need to download Competitive Analysis Of Major Players Existing Across Marketplace Diagrams PDF for your upcoming presentation. All the presentation templates are 100 percent editable and you can change the color and personalize the content accordingly. Download now
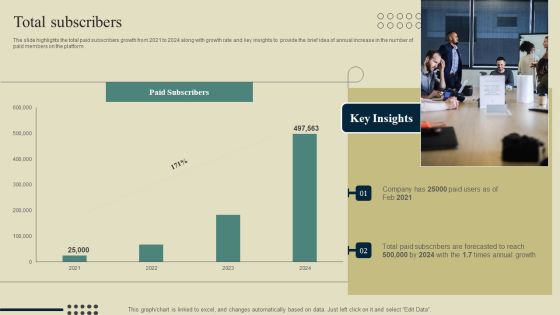
E Learning Platform Company Outline Total Subscribers Diagrams PDF
The slide highlights the total paid subscribers growth from 2021 to 2024 along with growth rate and key insights to provide the brief idea of annual increase in the number of paid members on the platform Do you have to make sure that everyone on your team knows about any specific topic I yes, then you should give E Learning Platform Company Outline Total Subscribers Diagrams PDF a try. Our experts have put a lot of knowledge and effort into creating this impeccable E Learning Platform Company Outline Total Subscribers Diagrams PDF. You can use this template for your upcoming presentations, as the slides are perfect to represent even the tiniest detail. You can download these templates from the Slidegeeks website and these are easy to edit. So grab these today.

Dashboard To Manage Marketing Campaigns Of Multiple Brands Diagrams PDF
This slide showcases dashboard that can help organization to manage the marketing campaigns in multi brand strategy. Its key elements are lead breakdown, total leads, key conversion metrics etc. Here you can discover an assortment of the finest PowerPoint and Google Slides templates. With these templates, you can create presentations for a variety of purposes while simultaneously providing your audience with an eye catching visual experience. Download Dashboard To Manage Marketing Campaigns Of Multiple Brands Diagrams PDF to deliver an impeccable presentation. These templates will make your job of preparing presentations much quicker, yet still, maintain a high level of quality. Slidegeeks has experienced researchers who prepare these templates and write high quality content for you. Later on, you can personalize the content by editing the Dashboard To Manage Marketing Campaigns Of Multiple Brands Diagrams PDF.

Business Buyers Have Higher Expectations As B2C Consumers Diagrams PDF
This slide provides information regarding characteristic of B2B buyer as having higher expectations as similar to B2C consumers while making buying decisions and expects firms response and interaction in real time. Crafting an eye-catching presentation has never been more straightforward. Let your presentation shine with this tasteful yet straightforward Business Buyers Have Higher Expectations As B2C Consumers Diagrams PDF template. It offers a minimalistic and classy look that is great for making a statement. The colors have been employed intelligently to add a bit of playfulness while still remaining professional. Construct the ideal Business Buyers Have Higher Expectations As B2C Consumers Diagrams PDF that effortlessly grabs the attention of your audience Begin now and be certain to wow your customers

Customer Relationship Management Tools Impact On Business Performance Diagrams PDF
Following slide displays impact of customer relationship management on business overall customer base. It includes key points such as customer services, customer satisfaction, customer retention, business sales, customer engagement, repetitive customers, etc. Crafting an eye-catching presentation has never been more straightforward. Let your presentation shine with this tasteful yet straightforward Customer Relationship Management Tools Impact On Business Performance Diagrams PDF template. It offers a minimalistic and classy look that is great for making a statement. The colors have been employed intelligently to add a bit of playfulness while still remaining professional. Construct the ideal Customer Relationship Management Tools Impact On Business Performance Diagrams PDF that effortlessly grabs the attention of your audience Begin now and be certain to wow your customers

Dashboard Related To Application Programming Interface Fastest Diagrams PDF
This slide covers the API Application Programming Interface dashboard which includes Uptime History, Run Count, Errors, Average Time taken etc. Deliver an awe-inspiring pitch with this creative dashboard related to application programming interface fastest diagrams pdf bundle. Topics like run count, average time, slowest time, fastest time, uptime can be discussed with this completely editable template. It is available for immediate download depending on the needs and requirements of the user.

Company Operational Overview With Segments And Revenue Split Diagrams PDF
This slide shows the brief outline of the company including Head Office, Industry Type, Key Business Strategy, Revenue Split by Segments and Geography, Per Share Price etc. Deliver an awe-inspiring pitch with this creative company operational overview with segments and revenue split diagrams pdf bundle. Topics like business overview, segment information, revenue split by geography can be discussed with this completely editable template. It is available for immediate download depending on the needs and requirements of the user.

Beauty And Personal Care Market Overview Diagrams PDF
This slide provides the glimpse about the beauty market overview which focuses on worldwide values, annual growth rate, and market shares.Deliver an awe-inspiring pitch with this creative beauty and personal care market overview diagrams pdf. bundle. Topics like cosmetics market worldwide market shares, compound annual growth rate of beauty and personal care can be discussed with this completely editable template. It is available for immediate download depending on the needs and requirements of the user.

Social Media Marketing Monitor Facebook Interactions With Insight Diagrams PDF
This slide shows Facebook insight dashboard to track marketing KPIs such as page likes, content reach and audience engagement on weekly basses Deliver an awe inspiring pitch with this creative social media marketing monitor facebook interactions with insight diagrams pdf bundle. Topics like monitor facebook interactions with insight can be discussed with this completely editable template. It is available for immediate download depending on the needs and requirements of the user.
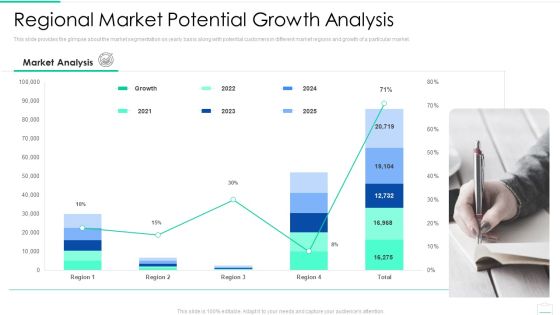
Market Area Analysis Regional Market Potential Growth Analysis Diagrams PDF
This slide provides the glimpse about the market segmentation on yearly basis along with potential customers in different market regions and growth of a particular market. Deliver and pitch your topic in the best possible manner with this market area analysis regional market potential growth analysis diagrams pdf. Use them to share invaluable insights on regional market potential growth analysis and impress your audience. This template can be altered and modified as per your expectations. So, grab it now.

Pension Planner Select A Retirement Plan Rate Diagrams PDF
This slide represents graphically the best retirement plan according to the salary, rate of return, deferral percentage, and total contribution by the employees. Deliver and pitch your topic in the best possible manner with this pension planner select a retirement plan rate diagrams pdf. Use them to share invaluable insights on select a retirement plan and impress your audience. This template can be altered and modified as per your expectations. So, grab it now.
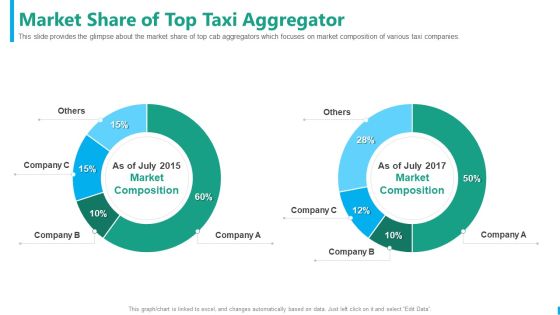
Taxi Aggregator Market Share Of Top Taxi Aggregator Diagrams PDF
This slide provides the glimpse about the market share of top cab aggregators which focuses on market composition of various taxi companies. Deliver and pitch your topic in the best possible manner with this taxi aggregator market share of top taxi aggregator diagrams pdf. Use them to share invaluable insights on market share of top taxi aggregator and impress your audience. This template can be altered and modified as per your expectations. So, grab it now.

Dashboards Related To The Zoo Financials And Operations Diagrams PDF
This slide shows the dashboard or KPI related to the ABC Zoo which includes the forecasted revenue, competitors details, visitors attractions, capital expenditure and many kore. Deliver and pitch your topic in the best possible manner with this dashboards related to the zoo financials and operations diagrams pdf. Use them to share invaluable insights on capital expenditure, revenue and impress your audience. This template can be altered and modified as per your expectations. So, grab it now.

Business Pricing Model Strategy 4 Competition Based Pricing Diagrams PDF
This slide covers the fourth strategy for competitive based pricing along with advantages and disadvantages of choosing this strategy. Deliver an awe inspiring pitch with this creative business pricing model strategy 4 competition based pricing diagrams pdf bundle. Topics like positioning strategies, competitive pricing, market, implement can be discussed with this completely editable template. It is available for immediate download depending on the needs and requirements of the user.

Corporate Profile IT Organization Companys Income Statement Financials Diagrams PDF
The slide provides the key financials revenue, operating income and margin, net income and margin from the companys income statement along with the basic details. Deliver an awe inspiring pitch with this creative corporate profile it organization companys income statement financials diagrams pdf bundle. Topics like revenue, operating income, operating margin, net income can be discussed with this completely editable template. It is available for immediate download depending on the needs and requirements of the user.

Estimated Recruitment Efficiency Status Of The Company Diagrams PDF
This slide shows the estimated Recruitment Efficiency Status of the company after following a structured compensation management process and using various Compensation Management Softwares in terms of efficient and inefficient. Deliver and pitch your topic in the best possible manner with this estimated recruitment efficiency status of the company diagrams pdf. Use them to share invaluable insights on inefficient, efficient and impress your audience. This template can be altered and modified as per your expectations. So, grab it now.
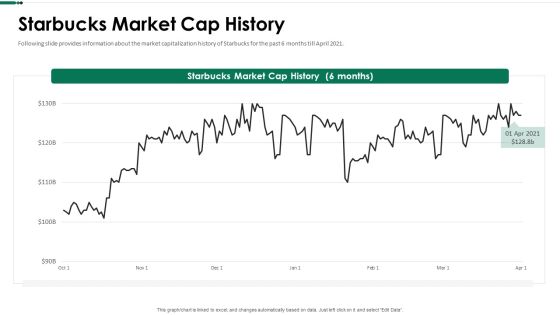
Starbucks Market Cap History Ppt Summary Diagrams PDF
Following slide provides information about the market capitalization history of Starbucks for the past 6 months till April 2021. Deliver an awe inspiring pitch with this creative starbucks market cap history ppt summary diagrams pdf bundle. Topics like starbucks market cap history can be discussed with this completely editable template. It is available for immediate download depending on the needs and requirements of the user.

Incident Management Dashboard With Injury Type Diagrams PDF
This shows the dashboard for visually presenting information regarding incident type, cause category, monthly trends and location of occurrence. Showcasing this set of slides titled incident management dashboard with injury type diagrams pdf. The topics addressed in these templates are incident management dashboard with injury type. All the content presented in this PPT design is completely editable. Download it and make adjustments in color, background, font etc. as per your unique business setting.

Statistical Analytics Report Showing Evolution Of Sales Industry Diagrams PDF
The following slide showcases a comprehensive analytical report highlighting the evolution of sales industry over the years. It provides information about sales cycle, state of the sales industry, etc. Showcasing this set of slides titled statistical analytics report showing evolution of sales industry diagrams pdf. The topics addressed in these templates are sales, technologies, system. All the content presented in this PPT design is completely editable. Download it and make adjustments in color, background, font etc. as per your unique business setting.
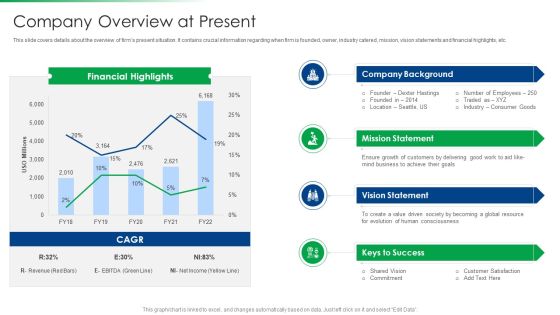
Strawman Project Action Plan Company Overview At Present Diagrams PDF
This slide covers details about the overview of firms present situation. It contains crucial information regarding when firm is founded, owner, industry catered, mission, vision statements and financial highlights, etc. Deliver an awe inspiring pitch with this creative strawman project action plan company overview at present diagrams pdf bundle. Topics like company background, mission statement, vision statement, keys to success can be discussed with this completely editable template. It is available for immediate download depending on the needs and requirements of the user.

Deliver Efficiency Innovation Impact Of Product Management Leadership Diagrams PDF
This slide focuses on the impact of product management leadership which includes roadmap for product improvement, engaging customers and partners, measuring performance, strategic alignment, etc. Deliver an awe inspiring pitch with this creative Deliver Efficiency Innovation Impact Of Product Management Leadership Diagrams PDF bundle. Topics like Raod Improvement, Enagaging Customers And Partners, Measuring Product Performance, Researching Market And Competition can be discussed with this completely editable template. It is available for immediate download depending on the needs and requirements of the user.
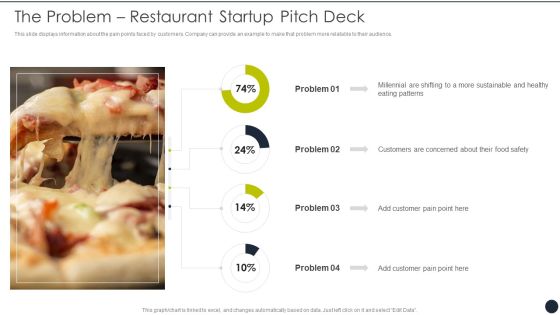
The Problem Restaurant Startup Pitch Deck Diagrams PDF
This slide displays information about the pain points faced by customers. Company can provide an example to make that problem more relatable to their audience. Deliver an awe inspiring pitch with this creative The Problem Restaurant Startup Pitch Deck Diagrams PDF bundle. Topics like Problem, Customers, Concerned About, Food Safety can be discussed with this completely editable template. It is available for immediate download depending on the needs and requirements of the user.

Canned Food Company Profile Employee Diversity Diagrams PDF
The slide highlights the employee diversity and total count for last five years. It showcases employee split by geography, employee split by diversity and number of employees in company Deliver an awe inspiring pitch with this creative Canned Food Company Profile Employee Diversity Diagrams PDF bundle. Topics like Employee Geography, Employee Diversity, Oceania can be discussed with this completely editable template. It is available for immediate download depending on the needs and requirements of the user.

Financial Solutions Company Profile Net Interest Income Diagrams PDF
The slide showcases the net interest income in graphical representation for period of five years. It presents the difference between the revenue generated from interest and the expenses paid as interest.Deliver and pitch your topic in the best possible manner with this Financial Solutions Company Profile Net Interest Income Diagrams PDF Use them to share invaluable insights on Net Interest Income and impress your audience. This template can be altered and modified as per your expectations. So, grab it now.

Insurance Services Firm Profile Business Expense Diagrams PDF
The slide showcases the combined expense, claim expense and operational expense of insurance company for last five financial years along with the key insights. Deliver an awe inspiring pitch with this creative Insurance Services Firm Profile Business Expense Diagrams PDF bundle. Topics like Claim Expense, Combined Expense, Operational Expense can be discussed with this completely editable template. It is available for immediate download depending on the needs and requirements of the user.

Food Company Overview Revenue By Category Diagrams PDF
The slide highlights the historical revenue for food products, beverage and dairy products revenue with CAGR. It showcases key insights for revenue describing growth trend for each category.Deliver and pitch your topic in the best possible manner with this Food Company Overview Revenue By Category Diagrams PDF Use them to share invaluable insights on Food Products, Beverages Revenue, Healthy Alternatives and impress your audience. This template can be altered and modified as per your expectations. So, grab it now.

Legal Advisory Company Description EBITDA Margin Diagrams PDF
This slide highlights the EBITDA, and EBITDA margin for law firm company illustrating growth trends for the year 2020, 2021 and 2022 along with key highlights.Deliver and pitch your topic in the best possible manner with this Legal Advisory Company Description EBITDA Margin Diagrams PDF. Use them to share invaluable insights on Margin Increases, EBITDA Recorded, Key Highlights and impress your audience. This template can be altered and modified as per your expectations. So, grab it now.
Online Customer Interaction Dashboard For Tracking Website Performance Diagrams PDF
This slide covers the KPI dashboard for analyzing the company website. It includes metrics such as conversions, conversion rate, sessions, stickiness, bounce rate, engagement, etc. Deliver an awe inspiring pitch with this creative Online Customer Interaction Dashboard For Tracking Website Performance Diagrams PDF bundle. Topics like Conversions Rate, Conversions, Engagement can be discussed with this completely editable template. It is available for immediate download depending on the needs and requirements of the user.

Education Dashboard With Absenteeism And Grade Details Metrics Diagrams PDF
This slide covers dashboard for tracking causes and rates of student absenteeism. It also include metrics such as average grades by subject and department. Pitch your topic with ease and precision using this Education Dashboard With Absenteeism And Grade Details Metrics Diagrams PDF. This layout presents information on Grade Department, English Proficiency, Medical Abs. It is also available for immediate download and adjustment. So, changes can be made in the color, design, graphics or any other component to create a unique layout.
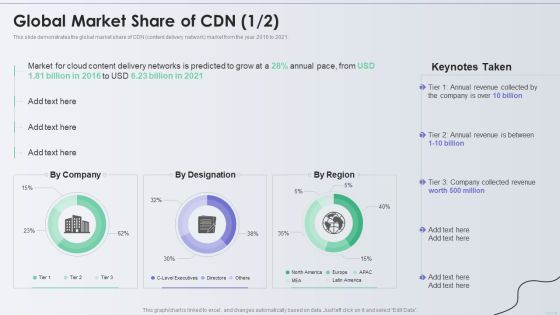
Distribution Network Global Market Share Of CDN Diagrams PDF
This slide demonstrates the global market share of CDN content delivery network market from the year 2016 to 2021. Deliver an awe inspiring pitch with this creative Distribution Network Global Market Share Of CDN Diagrams PDF bundle. Topics like Annual Revenue, Global Market Share can be discussed with this completely editable template. It is available for immediate download depending on the needs and requirements of the user.

Business Software Development Company Profile Financial Statements Diagrams PDF
The slide showcases income statement, balance sheet and cashflow statement of last five years to represent current financial position of organisation. Deliver an awe inspiring pitch with this creative Business Software Development Company Profile Financial Statements Diagrams PDF bundle. Topics like Income Statement, Balance Sheet, Cash Flow can be discussed with this completely editable template. It is available for immediate download depending on the needs and requirements of the user.

Clinical Services Company Profile Hospital Business Financials Diagrams PDF
The slide describes financial details for Hospital business vertical. It showcase revenue, gross profit, operating profit, EBIDTA and net profit along with margin. Deliver an awe inspiring pitch with this creative Clinical Services Company Profile Hospital Business Financials Diagrams PDF bundle. Topics like Hospital Business, Financials, Net Profit can be discussed with this completely editable template. It is available for immediate download depending on the needs and requirements of the user.
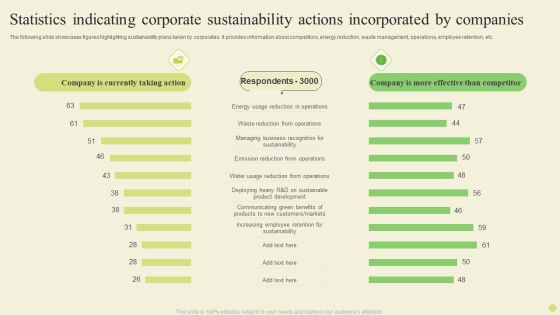
Statistics Indicating Corporate Sustainability Actions Incorporated By Companies Diagrams PDF
The following slide showcases figures highlighting sustainability plans taken by corporates. It provides information about competitors, energy reduction, waste management, operations, employee retention, etc.Pitch your topic with ease and precision using this Statistics Indicating Corporate Sustainability Actions Incorporated By Companies Diagrams PDF. This layout presents information on Energy Reduction, Emission Reduction, Increasing Employee. It is also available for immediate download and adjustment. So, changes can be made in the color, design, graphics or any other component to create a unique layout.
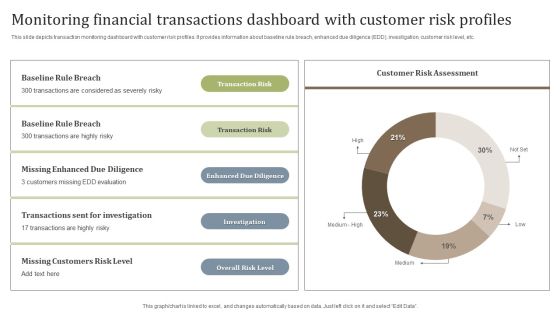
Monitoring Financial Transactions Dashboard With Customer Risk Profiles Diagrams PDF
This slide depicts transaction monitoring dashboard with customer risk profiles. It provides information about baseline rule breach, enhanced due diligence EDD, investigation, customer risk level, etc. Showcasing this set of slides titled Monitoring Financial Transactions Dashboard With Customer Risk Profiles Diagrams PDF. The topics addressed in these templates are Overall Risk Level, Investigation, Enhanced Due Diligence. All the content presented in this PPT design is completely editable. Download it and make adjustments in color, background, font etc. as per your unique business setting.
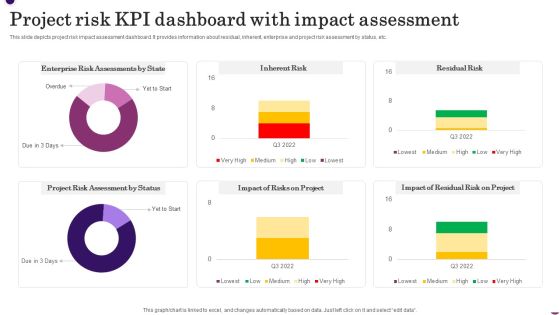
Project Risk KPI Dashboard With Impact Assessment Diagrams PDF
This slide depicts project risk impact assessment dashboard. It provides information about residual, inherent, enterprise and project risk assessment by status, etc. Showcasing this set of slides titled Project Risk KPI Dashboard With Impact Assessment Diagrams PDF. The topics addressed in these templates are Inherent Risk, Impact Of Risks On Project. All the content presented in this PPT design is completely editable. Download it and make adjustments in color, background, font etc. as per your unique business setting.
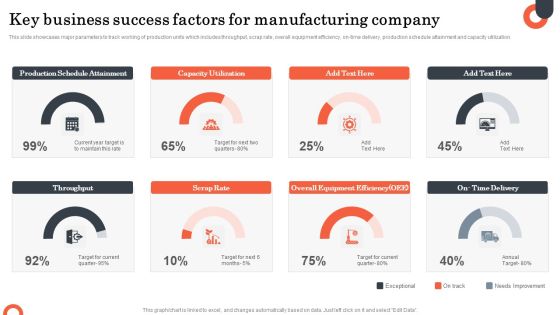
Key Business Success Factors For Manufacturing Company Diagrams PDF
This slide showcases major parameters to track working of production units which includes throughput, scrap rate, overall equipment efficiency, on-time delivery, production schedule attainment and capacity utilization. Showcasing this set of slides titled Key Business Success Factors For Manufacturing Company Diagrams PDF. The topics addressed in these templates are Production Schedule Attainment, Capacity Utilization, Scrap Rate. All the content presented in this PPT design is completely editable. Download it and make adjustments in color, background, font etc. as per your unique business setting.

Team Management Dashboard Indicating Contract Details Diagrams PDF
This slide illustrates team management dashboard indicating agreement details which contains annual value, suppliers, types, renewals, categories, etc. Showcasing this set of slides titled Team Management Dashboard Indicating Contract Details Diagrams PDF. The topics addressed in these templates are Suppliers, Agreements, Total Annual Value. All the content presented in this PPT design is completely editable. Download it and make adjustments in color, background, font etc. as per your unique business setting.

Project Prioritization Progress Scorecard With Assigned Employees Diagrams PDF
This slide covers report of multiple projects with assigned project manager. It also includes priority status, time frame, completion bar along with variances found. Pitch your topic with ease and precision using this Project Prioritization Progress Scorecard With Assigned Employees Diagrams PDF. This layout presents information on Project Prioritization, Progress Scorecard, Assigned Employees. It is also available for immediate download and adjustment. So, changes can be made in the color, design, graphics or any other component to create a unique layout.
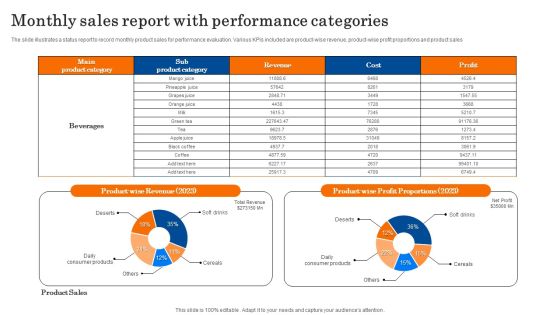
Monthly Sales Report With Performance Categories Diagrams PDF
The slide illustrates a status report to record monthly product sales for performance evaluation. Various KPIs included are product wise revenue, product-wise profit proportions and product sales. Showcasing this set of slides titled Monthly Sales Report With Performance Categories Diagrams PDF. The topics addressed in these templates are Revenue, Profit Proportions, Product Sales. All the content presented in this PPT design is completely editable. Download it and make adjustments in color, background, font etc. as per your unique business setting.
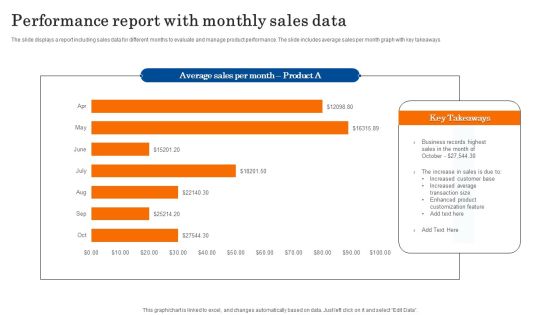
Performance Report With Monthly Sales Data Diagrams PDF
The slide displays a report including sales data for different months to evaluate and manage product performance. The slide includes average sales per month graph with key takeaways. Showcasing this set of slides titled Performance Report With Monthly Sales Data Diagrams PDF. The topics addressed in these templates are Business, Sales, Customization. All the content presented in this PPT design is completely editable. Download it and make adjustments in color, background, font etc. as per your unique business setting.

Dashboard For Assessing Project Progress Status Diagrams PDF
This slide exhibits a dashboard for monitoring project status. It includes ongoing projects, completed projects, sub-projects, ongoing delayed project status, and survey status. Showcasing this set of slides titled Dashboard For Assessing Project Progress Status Diagrams PDF. The topics addressed in these templates are Completed Projects, Completed Sub Projects, Area Wise Survey. All the content presented in this PPT design is completely editable. Download it and make adjustments in color, background, font etc. as per your unique business setting.
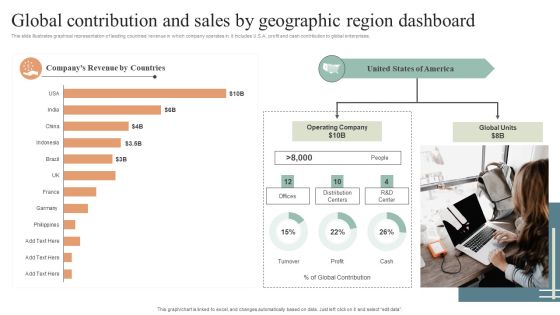
Global Contribution And Sales By Geographic Region Dashboard Diagrams PDF
This slide illustrates graphical representation of leading countries revenue in which company operates in. it includes U.S.A. profit and cash contribution to global enterprises. Pitch your topic with ease and precision using this Global Contribution And Sales By Geographic Region Dashboard Diagrams PDF. This layout presents information on Global Contribution, Sales By Geographic, Region Dashboard. It is also available for immediate download and adjustment. So, changes can be made in the color, design, graphics or any other component to create a unique layout.
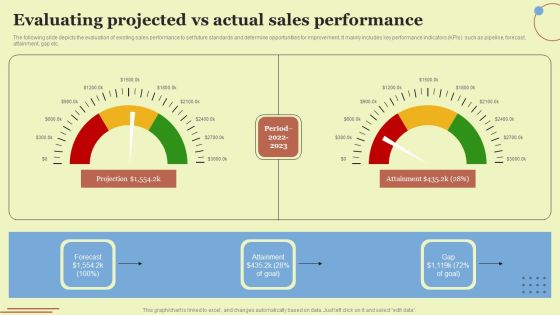
Evaluating Projected Vs Actual Sales Performance Diagrams PDF
The following slide depicts the evaluation of existing sales performance to set future standards and determine opportunities for improvement. It mainly includes key performance indicators KPIs such as pipeline, forecast, attainment, gap etc. There are so many reasons you need a Evaluating Projected Vs Actual Sales Performance Diagrams PDF. The first reason is you can not spend time making everything from scratch, Thus, Slidegeeks has made presentation templates for you too. You can easily download these templates from our website easily.

Call Center Kpis Dashboard With Ticket Status Diagrams PDF
This slide covers contact center metrics dashboard with ticket status. It involves data such as tickets created by channels, tickets by type and customer satisfaction score. Showcasing this set of slides titled Call Center Kpis Dashboard With Ticket Status Diagrams PDF. The topics addressed in these templates are Status, Minutes, Call. All the content presented in this PPT design is completely editable. Download it and make adjustments in color, background, font etc. as per your unique business setting.

Area Chart Effective Planning For Monetary Strategy Execution Ideas PDF
Are you searching for a Area Chart Effective Planning For Monetary Strategy Execution Ideas PDF that is uncluttered, straightforward, and original Its easy to edit, and you can change the colors to suit your personal or business branding. For a presentation that expresses how much effort you have put in, this template is ideal With all of its features, including tables, diagrams, statistics, and lists, its perfect for a business plan presentation. Make your ideas more appealing with these professional slides. Download Area Chart Effective Planning For Monetary Strategy Execution Ideas PDF from Slidegeeks today.
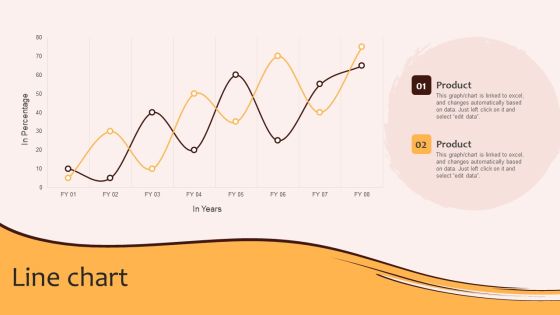
Line Chart Digital Marketing Plan For Restaurant Business Template PDF
Are you searching for a Line Chart Digital Marketing Plan For Restaurant Business Template PDF that is uncluttered, straightforward, and original Its easy to edit, and you can change the colors to suit your personal or business branding. For a presentation that expresses how much effort you have put in, this template is ideal With all of its features, including tables, diagrams, statistics, and lists, its perfect for a business plan presentation. Make your ideas more appealing with these professional slides. Download Line Chart Digital Marketing Plan For Restaurant Business Template PDF from Slidegeeks today.

Capital Expenditure Related To The Zoo And Theme Park Ppt File Clipart PDF
This slide shows the various types of capital expenditure done by the Zoo corporation which includes Animal care expenses, park operations, administration and marketing, fundraising and memberships, etc. Deliver an awe-inspiring pitch with this creative capital expenditure related to the zoo and theme park ppt file clipart pdf. bundle. Topics like capital expenditure related to the zoo and theme park can be discussed with this completely editable template. It is available for immediate download depending on the needs and requirements of the user.

Capital Expenditure Related To The Zoo And Theme Park Designs PDF
This slide shows the various types of capital expenditure done by the Zoo corporation which includes Animal care expenses, park operations, administration and marketing, fundraising and memberships, etc. Deliver an awe inspiring pitch with this creative capital expenditure related to the zoo and theme park designs pdf bundle. Topics like capital expenditure related to the zoo and theme park can be discussed with this completely editable template. It is available for immediate download depending on the needs and requirements of the user.
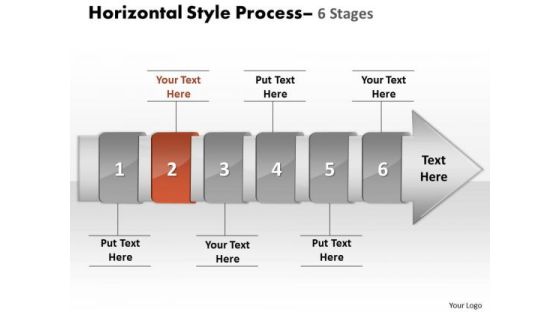
Ppt Theme Horizontal Flow Of 6 Stage Spider Diagram PowerPoint Template 3 Design
We present our PPT Theme horizontal flow of 6 stage spider diagram power point template 3 designs. Use our Arrows PowerPoint Templates because, the goal also clearly etched in your mind. Use our Shapes PowerPoint Templates because, Business 3D Circular Puzzle: - Your business and plans for its growth consist of processes that are highly co-related. Use our Finance PowerPoint Templates because; illustrate your plans on using the many social media modes available to inform society at large of the benefits of your product. Use our Business PowerPoint Templates because, Our PowerPoint templates give this step by step process to achieve the aim. Use our Process and Flows PowerPoint Templates because; illustrate your chain of ideas focusing on that aspect or resource in order to enhance the quality of your product. Use these PowerPoint slides for presentations relating to accent, advertisement, arrow, badge, banner, business, button, collection, color, decoration, design, direction, element, financial, flow, graph, horizontal, instruction, isolated, label, manual, message, process, sale, set, shape, steps, symbol, template. The prominent colors used in the PowerPoint template are Red, Gray, and Black
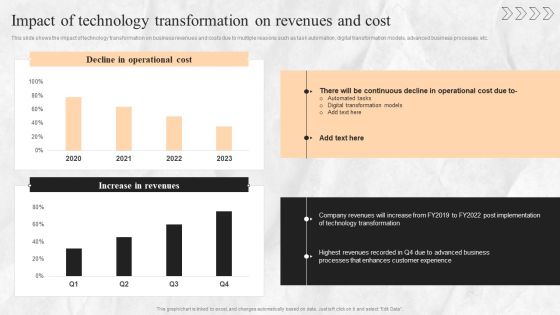
Digital Transition Plan For Managing Business Impact Of Technology Transformation On Revenues And Cost Slides PDF
This slide shows the impact of technology transformation on business revenues and costs due to multiple reasons such as task automation, digital transformation models, advanced business processes, etc. Make sure to capture your audiences attention in your business displays with our gratis customizable Digital Transition Plan For Managing Business Impact Of Technology Transformation On Revenues And Cost Slides PDF. These are great for business strategies, office conferences, capital raising or task suggestions. If you desire to acquire more customers for your tech business and ensure they stay satisfied, create your own sales presentation with these plain slides.
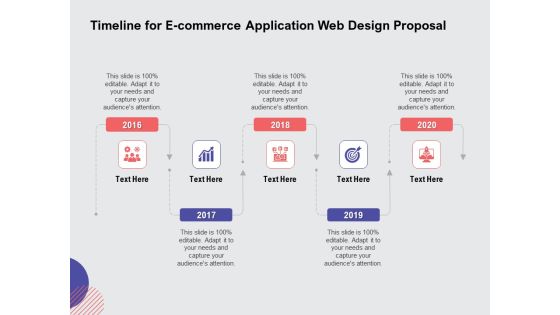
Web Design Services Ecommerce Busines Timeline For E Commerce Application Web Design Proposal Themes PDF
Presenting this set of slides with name web design services ecommerce busines timeline for e commerce application web design proposal themes pdf. This is a five stage process. The stages in this process are timeline, 2016 to 2020. This is a completely editable PowerPoint presentation and is available for immediate download. Download now and impress your audience.

Applications Of Openais Gpt Models In E Commerce Sector Chat Generative Pre Trained Transformer Themes PDF
This purpose of this slide is to explain how integration of ChatGPT in e-commerce sites can help them improve and grow more. The applications are product recommendation systems, text generation, order tracking, virtual styling and outfitting, etc.There are so many reasons you need a Applications Of Openais Gpt Models In E Commerce Sector Chat Generative Pre Trained Transformer Themes PDF. The first reason is you can not spend time making everything from scratch, Thus, Slidegeeks has made presentation templates for you too. You can easily download these templates from our website easily.
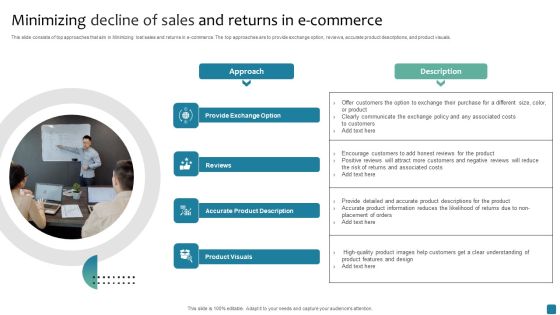
Minimizing Decline Of Sales And Returns In E Commerce Themes PDF
This slide consists of top approaches that aim in Minimizing lost sales and returns in e-commerce. The top approaches are to provide exchange option, reviews, accurate product descriptions, and product visuals. Persuade your audience using this Minimizing Decline Of Sales And Returns In E Commerce Themes PDF. This PPT design covers four stages, thus making it a great tool to use. It also caters to a variety of topics including Provide Exchange Option, Reviews, Accurate Product Description. Download this PPT design now to present a convincing pitch that not only emphasizes the topic but also showcases your presentation skills.
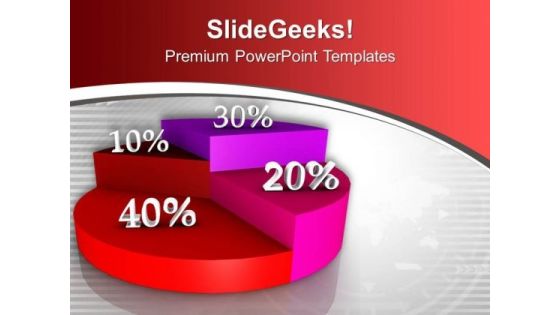
Circular Chart Represents Statistical Diagram PowerPoint Templates Ppt Backgrounds For Slides 0313
We present our Circular Chart Represents Statistical Diagram PowerPoint Templates PPT Backgrounds For Slides 0313.Use our Marketing PowerPoint Templates because Our PowerPoint Templates and Slides are truly out of this world. Even the MIB duo has been keeping tabs on our team. Use our Business PowerPoint Templates because Our PowerPoint Templates and Slides will help you be quick off the draw. Just enter your specific text and see your points hit home. Download our Shapes PowerPoint Templates because Our PowerPoint Templates and Slides will effectively help you save your valuable time. They are readymade to fit into any presentation structure. Download and present our Finance PowerPoint Templates because Our PowerPoint Templates and Slides team portray an attitude of elegance. Personify this quality by using them regularly. Download and present our Signs PowerPoint Templates because Our PowerPoint Templates and Slides are effectively colour coded to prioritise your plans They automatically highlight the sequence of events you desire.Use these PowerPoint slides for presentations relating to Pie chart, finance, business, shapes, signs, marketing. The prominent colors used in the PowerPoint template are Red, Pink, White.
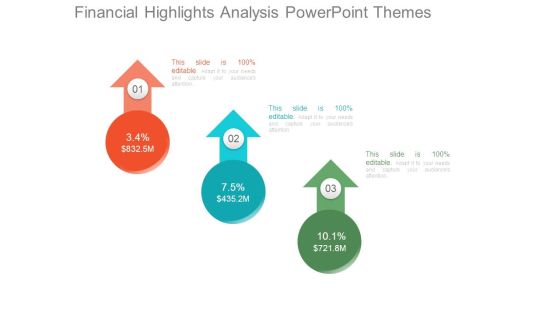
Financial Highlights Analysis Powerpoint Themes
This is a financial highlights analysis powerpoint themes. This is a three stage process. The stages in this process are business, marketing, finance, strategy, arrow.
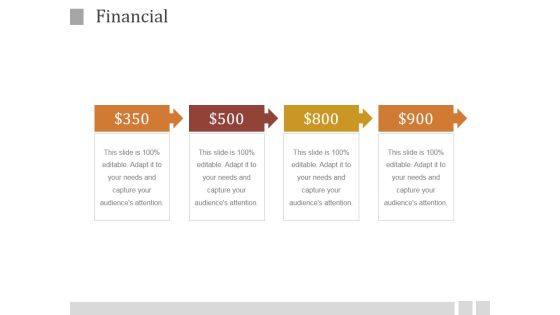
Financial Ppt PowerPoint Presentation Themes
This is a financial ppt powerpoint presentation themes. This is a four stage process. The stages in this process are finance, process, arrows, marketing, strategy, success.
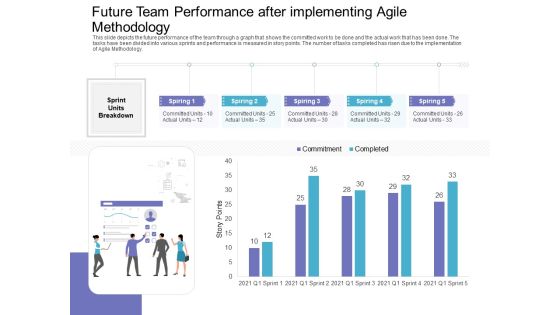
Future Team Performance After Implementing Agile Methodology Diagrams PDF
This slide depicts the future performance of the team through a graph that shows the committed work to be done and the actual work that has been done. The tasks have been divided into various sprints and performance is measured in story points. The number of tasks completed has risen due to the implementation of Agile Methodology. Deliver and pitch your topic in the best possible manner with this future team performance after implementing agile methodology diagrams pdf. Use them to share invaluable insights on future team performance after implementing agile methodology and impress your audience. This template can be altered and modified as per your expectations. So, grab it now.

Buyers Conversion Rate Of The Company Diagrams PDF
This slide shows a graph of the percentage of actual buyers that make purchase form the site once they visit the site. The rate has considerably gone down since 2020 due to reasons such as poor user interface, limited product categories, long waiting time, complex billing options etc. Deliver an awe-inspiring pitch with this creative buyers conversion rate of the company diagrams pdf. bundle. Topics like buyers conversion rate, 2016 to 2021 can be discussed with this completely editable template. It is available for immediate download depending on the needs and requirements of the user.

Covid19 Impact On Consumers Behavior Towards Restaurants Diagrams PDF
Mentioned slide displays informational statistics of coronavirus impact on consumer behavior towards restaurant visits. Here the graph indicates that 32 percentage customers said that they will reduce the frequency of eating at restaurants. Deliver an awe inspiring pitch with this creative covid19 impact on consumers behavior towards restaurants diagrams pdf bundle. Topics like covid 19 impact on consumers behavior towards restaurants can be discussed with this completely editable template. It is available for immediate download depending on the needs and requirements of the user.
