AI PPT Maker
Templates
PPT Bundles
Design Services
Business PPTs
Business Plan
Management
Strategy
Introduction PPT
Roadmap
Self Introduction
Timelines
Process
Marketing
Agenda
Technology
Medical
Startup Business Plan
Cyber Security
Dashboards
SWOT
Proposals
Education
Pitch Deck
Digital Marketing
KPIs
Project Management
Product Management
Artificial Intelligence
Target Market
Communication
Supply Chain
Google Slides
Research Services
 One Pagers
All Categories
-
Home
- Customer Favorites
- Bank Icon
Bank Icon

Stock Photo Business Strategy Review Do Calculated Saving Images
Draft It Out On Our stock photo business strategy review do calculated saving stock photo images Powerpoint Templates. Give The Final Touches With Your Ideas. Get A Bakers Dozen With Our finance Powerpoint Templates. Receive That Little Bit More Than Expected.
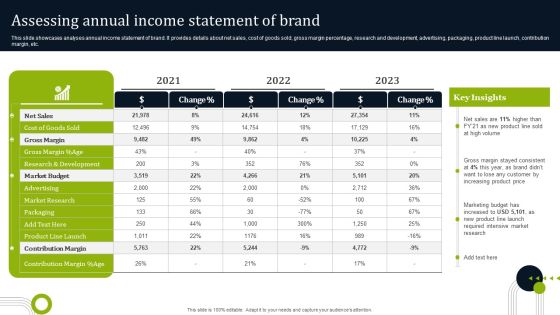
Introducing New Commodities Through Product Line Extension Assessing Annual Income Statement Diagrams PDF
This slide showcases analyses annual income statement of brand. It provides details about net sales, cost of goods sold, gross margin percentage, research and development, advertising, packaging, product line launch, contribution margin, etc. Slidegeeks is here to make your presentations a breeze with Introducing New Commodities Through Product Line Extension Assessing Annual Income Statement Diagrams PDF With our easy-to-use and customizable templates, you can focus on delivering your ideas rather than worrying about formatting. With a variety of designs to choose from, you are sure to find one that suits your needs. And with animations and unique photos, illustrations, and fonts, you can make your presentation pop. So whether you are giving a sales pitch or presenting to the board, make sure to check out Slidegeeks first.

Direct Response Marketing Guide Ultimate Success Dashboard To Track Progress Diagrams PDF
This slide provides an overview of the dashboard depicting the status of the digital marketing campaign with the help of performance metrics. The dashboard includes ad spend, return on ad spend, purchase rate and cost per order. Are you in need of a template that can accommodate all of your creative concepts This one is crafted professionally and can be altered to fit any style. Use it with Google Slides or PowerPoint. Include striking photographs, symbols, depictions, and other visuals. Fill, move around, or remove text boxes as desired. Test out color palettes and font mixtures. Edit and save your work, or work with colleagues. Download Direct Response Marketing Guide Ultimate Success Dashboard To Track Progress Diagrams PDF and observe how to make your presentation outstanding. Give an impeccable presentation to your group and make your presentation unforgettable.

Impact Of Customer Churn Prevention Strategies On Business Performance Ppt PowerPoint Presentation Diagram Images PDF
Mentioned slide outlines the impact of implementing attrition rate prevention techniques on organizational performance. The graph is covering information about monthly recurring revenue MRR, customer lifetime value CLV, and customer acquisition cost CAC along with key intakes. The Impact Of Customer Churn Prevention Strategies On Business Performance Ppt PowerPoint Presentation Diagram Images PDF is a compilation of the most recent design trends as a series of slides. It is suitable for any subject or industry presentation, containing attractive visuals and photo spots for businesses to clearly express their messages. This template contains a variety of slides for the user to input data, such as structures to contrast two elements, bullet points, and slides for written information. Slidegeeks is prepared to create an impression.

KPI Dashboard Highlighting Result Of Marketing Campaign Ppt PowerPoint Presentation Diagram Lists PDF
The following slide showcases a comprehensive key performance indicator KPI dashboard which can be used to showcase the outcome of marketing campaign. The major metrics covered in the slide are brand mentions, customer lifetime value CLV, customer acquisition cost CAC, net promoter score NPS, etc. Are you in need of a template that can accommodate all of your creative concepts This one is crafted professionally and can be altered to fit any style. Use it with Google Slides or PowerPoint. Include striking photographs, symbols, depictions, and other visuals. Fill, move around, or remove text boxes as desired. Test out color palettes and font mixtures. Edit and save your work, or work with colleagues. Download KPI Dashboard Highlighting Result Of Marketing Campaign Ppt PowerPoint Presentation Diagram Lists PDF and observe how to make your presentation outstanding. Give an impeccable presentation to your group and make your presentation unforgettable.

Advertising Programs Management Techniques Social Media Advertisement Campaign Dashboard Diagrams PDF
This slide showcases a dashboard depicting key metrics tracked for social media advertising campaigns. The metrics covered are spent this month, conversion, cost per conversion, sessions, etc. This modern and well arranged Advertising Programs Management Techniques Social Media Advertisement Campaign Dashboard Diagrams PDF provides lots of creative possibilities. It is very simple to customize and edit with the Powerpoint Software. Just drag and drop your pictures into the shapes. All facets of this template can be edited with Powerpoint no extra software is necessary. Add your own material, put your images in the places assigned for them, adjust the colors, and then you can show your slides to the world, with an animated slide included.

Marketing Campaign Dashboard For B2B Marketers Ppt PowerPoint Presentation File Diagrams PDF
The following slide showcases key performance indicator KPI dashboard that can assist managers to evaluate digital marketing campaign performance. The key metrics mentioned in the slide are click-through-rate CTR, conversion rate, cost per click CPC, etc. Present like a pro with Marketing Campaign Dashboard For B2B Marketers Ppt PowerPoint Presentation File Diagrams PDF Create beautiful presentations together with your team, using our easy to use presentation slides. Share your ideas in real time and make changes on the fly by downloading our templates. So whether you are in the office, on the go, or in a remote location, you can stay in sync with your team and present your ideas with confidence. With Slidegeeks presentation got a whole lot easier. Grab these presentations today.

Entity Relationship Diagram For Event Resource Planning Ppt Layouts Demonstration PDF
This slide highlights entity relationship diagram for event resourcing planning which helps determine information system requirements through event planning program. It provides information regarding event, function, system and event. Presenting Entity Relationship Diagram For Event Resource Planning Ppt Layouts Demonstration PDF to dispense important information. This template comprises one stages. It also presents valuable insights into the topics including Event, Function, Information Material, Organization Unit. This is a completely customizable PowerPoint theme that can be put to use immediately. So, download it and address the topic impactfully.

Clustered Column Line Ppt PowerPoint Presentation Slides Themes
This is a clustered column line ppt powerpoint presentation slides themes. This is a four stage process. The stages in this process are business, marketing, strategy, planning, finance.
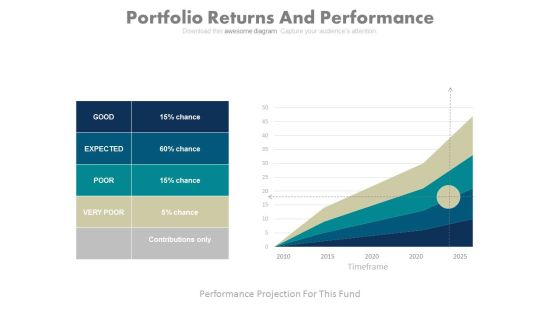
Portfolio Returns And Performance Chart Ppt Slides
This is a portfolio returns and performance chart ppt slides. This is a five stage process. The stages in this process are business, finance, marketing.
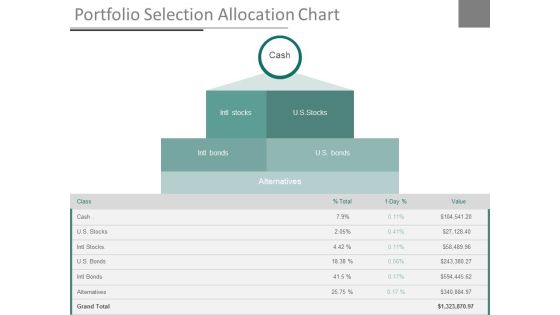
Portfolio Selection Allocation Chart Ppt Slides
This is a portfolio selection allocation chart ppt slides. This is a one stage process. The stages in this process are business, finance, marketing.

Customer Service Benchmarking Chart Ppt Slides
This is a customer service benchmarking chart ppt slides. This is a eight stage process. The stages in this process are finance, business, marketing.
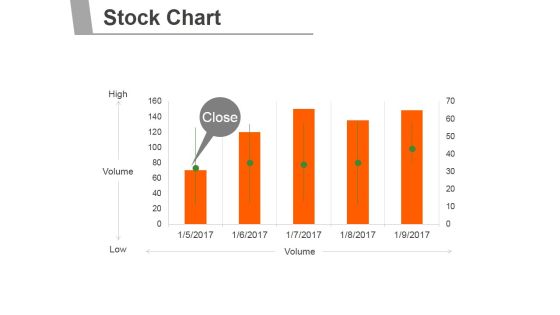
Stock Chart Ppt PowerPoint Presentation Design Templates
This is a stock chart ppt powerpoint presentation design templates. This is a five stage process. The stages in this process are business, marketing, finance, planning, management.

Area Chart Ppt PowerPoint Presentation Images
This is a area chart ppt powerpoint presentation images. This is a two stage process. The stages in this process are business, strategy, marketing, analysis, finance.

Bar Chart Ppt PowerPoint Presentation Layouts
This is a bar chart ppt powerpoint presentation layouts. This is a four stage process. The stages in this process are business, strategy, marketing, analysis, finance.

Donut Pie Chart Ppt PowerPoint Presentation Show
This is a donut pie chart ppt powerpoint presentation show. This is a seven stage process. The stages in this process are business, strategy, analysis, marketing, finance, donut.

Donut Chart Ppt PowerPoint Presentation Summary
This is a donut chart ppt powerpoint presentation summary. This is a six stage process. The stages in this process are business, marketing, finance, process, planning.
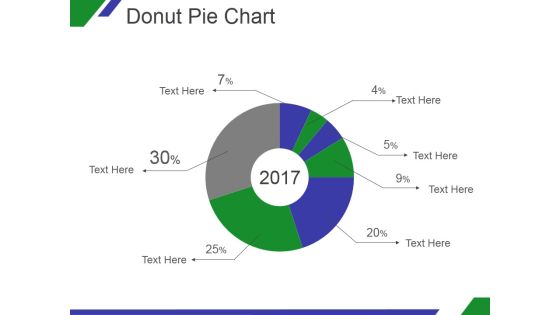
Donut Pie Chart Ppt PowerPoint Presentation Styles
This is a donut pie chart ppt powerpoint presentation styles. This is a seven stage process. The stages in this process are year, donut, finance, planning.

Pie Chart Ppt PowerPoint Presentation Information
This is a pie chart ppt powerpoint presentation information. This is a four stage process. The stages in this process are pie, finance, business, growth, process.

Area Chart Ppt PowerPoint Presentation Summary Graphics
This is a area chart ppt powerpoint presentation summary graphics. This is a two stage process. The stages in this process are business, strategy, marketing, analysis, finance, growth.

Area Chart Ppt PowerPoint Presentation Show Portfolio
This is a area chart ppt powerpoint presentation show portfolio. This is a two stage process. The stages in this process are business, product, finance, growth, management.

Pie Chart Ppt PowerPoint Presentation Layouts Shapes
This is a pie chart ppt powerpoint presentation layouts shapes. This is a four stage process. The stages in this process are pie, finance, percentage, business, marketing.

Area Chart Ppt PowerPoint Presentation Pictures Visuals
This is a area chart ppt powerpoint presentation pictures visuals. This is a two stage process. The stages in this process are product, business, finance, marketing.

Area Chart Ppt PowerPoint Presentation Professional Deck
This is a area chart ppt powerpoint presentation professional deck. This is a two stage process. The stages in this process are business, marketing, growth, finance, management.

Bar Chart Ppt PowerPoint Presentation File Skills
This is a bar chart ppt powerpoint presentation file skills. This is a nine stage process. The stages in this process are business, marketing, growth, finance, management.

Pie Chart Ppt PowerPoint Presentation Infographics Aids
This is a pie chart ppt powerpoint presentation infographics aids. This is a three stage process. The stages in this process are business, finance, management, strategy, planning.

Area Chart Ppt PowerPoint Presentation Professional Display
This is a area chart ppt powerpoint presentation professional display. This is a two stage process. The stages in this process are business, finance, growth, strategy, marketing, analysis.
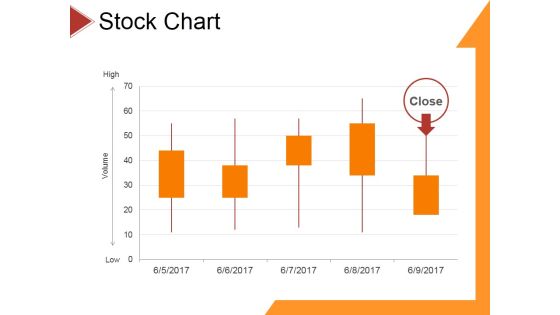
Stock Chart Ppt PowerPoint Presentation File Ideas
This is a stock chart ppt powerpoint presentation file ideas. This is a five stage process. The stages in this process are business, strategy, analysis, pretention, finance.

Stock Chart Ppt PowerPoint Presentation Portfolio Infographics
This is a stock chart ppt powerpoint presentation portfolio infographics. This is a five stage process. The stages in this process are high, volume, low, finance, business.

Area Chart Ppt PowerPoint Presentation Slides Inspiration
This is a area chart ppt powerpoint presentation slides inspiration. This is a two stage process. The stages in this process are business, marketing, finance, growth, management.

Column Chart Ppt PowerPoint Presentation Show Shapes
This is a column chart ppt powerpoint presentation show shapes. This is a two stage process. The stages in this process are sales, product, business, management, finance.
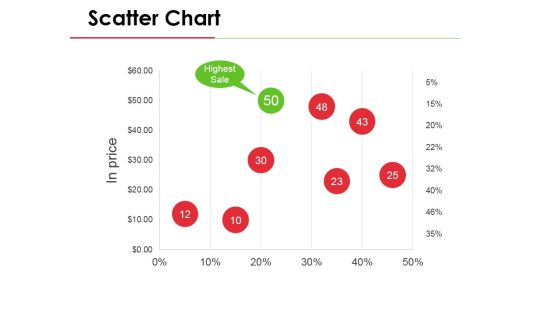
Scatter Chart Ppt PowerPoint Presentation Model Deck
This is a scatter chart ppt powerpoint presentation model deck. This is a eight stage process. The stages in this process are business, marketing, finance, management, strategy.

Bar Chart Ppt PowerPoint Presentation Slides Shapes
This is a bar chart ppt powerpoint presentation slides shapes. This is a seven stage process. The stages in this process are bar graph, finance, marketing, strategy, analysis.

Doughnut Chart Ppt PowerPoint Presentation Styles Backgrounds
This is a doughnut chart ppt powerpoint presentation styles backgrounds. This is a three stage process. The stages in this process are percentage, finance, business, marketing, strategy.
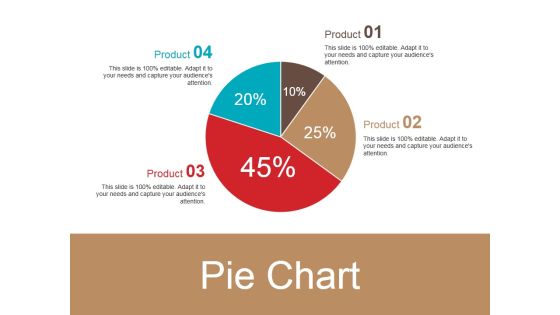
Pie Chart Ppt PowerPoint Presentation Ideas Slideshow
This is a pie chart ppt powerpoint presentation ideas slideshow. This is a four stage process. The stages in this process are pie, process, percentage, finance, business.
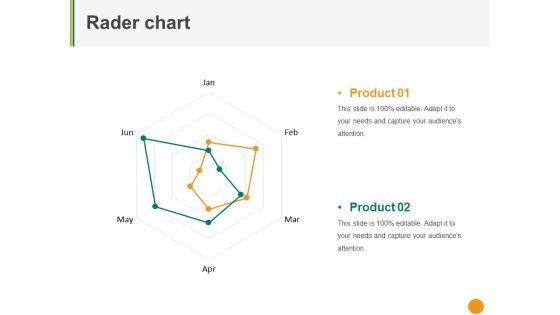
Rader Chart Ppt PowerPoint Presentation Professional Pictures
This is a rader chart ppt powerpoint presentation professional pictures. This is a two stage process. The stages in this process are product, finance, business, marketing.

Bar Chart Ppt PowerPoint Presentation Summary Pictures
This is a bar chart ppt powerpoint presentation summary pictures. This is a four stage process. The stages in this process are product, unit count, finance, percentage, business.
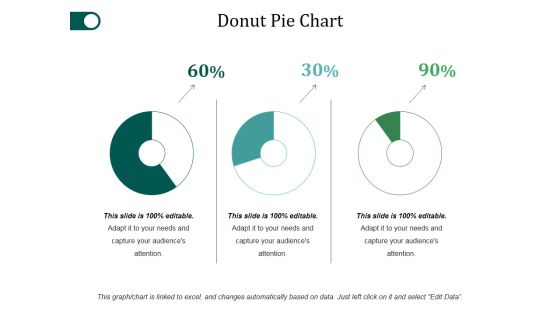
Donut Pie Chart Ppt PowerPoint Presentation Examples
This is a donut pie chart ppt powerpoint presentation examples. This is a three stage process. The stages in this process are percentage, finance, donut, business.

Bubble Chart Ppt PowerPoint Presentation Outline Smartart
This is a bubble chart ppt powerpoint presentation outline smartart. This is a two stage process. The stages in this process are analysis, finance, business, marketing, strategy.

Line Chart Ppt PowerPoint Presentation Portfolio Inspiration
This is a line chart ppt powerpoint presentation portfolio inspiration. This is a two stage process. The stages in this process are business, marketing, strategy, planning, finance.
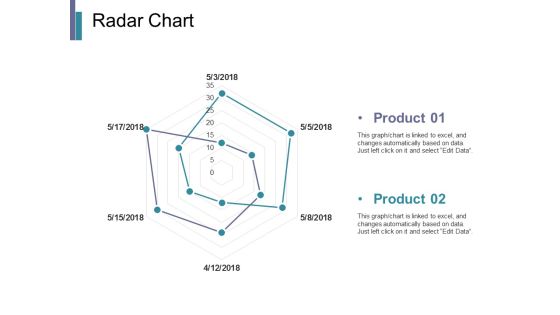
Radar Chart Ppt PowerPoint Presentation Infographics Pictures
This is a radar chart ppt powerpoint presentation infographics pictures. This is a two stage process. The stages in this process are business, marketing, strategy, planning, finance.

Bubble Chart Ppt PowerPoint Presentation Portfolio Show
This is a bubble chart ppt powerpoint presentation portfolio show. This is a two stage process. The stages in this process are business, marketing, strategy, planning, finance.

Retail Outlet Revenue Growth Chart Mockup PDF
This slide shows the revenue growth line chart of a retail store which includes passing footfall, customers per day, percentage of customer who purchased, revenue per day and revenue per year. Pitch your topic with ease and precision using this retail outlet revenue growth chart mockup pdf This layout presents information on Retail outlet revenue growth chart It is also available for immediate download and adjustment. So, changes can be made in the color, design, graphics or any other component to create a unique layout.
Investor Pitch Deck Initial Coin Offering Financing 30 60 90 Days Plan Ppt Infographic Template Diagrams PDF
This is a investor pitch deck initial coin offering financing 30 60 90 days plan ppt infographic template diagrams pdf template with various stages. Focus and dispense information on three stages using this creative set, that comes with editable features. It contains large content boxes to add your information on topics like 30 60 90 days plan. You can also showcase facts, figures, and other relevant content using this PPT layout. Grab it now.

Business Bar Graph For Finance PowerPoint Templates Ppt Backgrounds For Slides 0413
We present our Business Bar Graph For Finance PowerPoint Templates PPT Backgrounds For Slides 0413.Download our Competition PowerPoint Templates because You can Bait your audience with our PowerPoint Templates and Slides. They will bite the hook of your ideas in large numbers. Download our Leadership PowerPoint Templates because These PowerPoint Templates and Slides will give the updraft to your ideas. See them soar to great heights with ease. Present our Finance PowerPoint Templates because Our PowerPoint Templates and Slides will steer your racing mind. Hit the right buttons and spur on your audience. Present our Arrows PowerPoint Templates because You can Channelise the thoughts of your team with our PowerPoint Templates and Slides. Urge them to focus on the goals you have set. Present our Success PowerPoint Templates because Our PowerPoint Templates and Slides help you meet the demand of the Market. Just browse and pick the slides that appeal to your intuitive senses.Use these PowerPoint slides for presentations relating to Growth & progress bar chart, leadership, competition, finance, arrows, success. The prominent colors used in the PowerPoint template are Green, Yellow, Red.

Brand Awareness Plan Ineffective Product Marketing Impact On Customer Retention Diagrams PDF
This slide shows graphical presentation of impact of ineffective marketing on customer retention rate. Additionally, it provides the impact and reason behind the decline in retention rate. Retrieve professionally designed Brand Awareness Plan Ineffective Product Marketing Impact On Customer Retention Diagrams PDF to effectively convey your message and captivate your listeners. Save time by selecting pre-made slideshows that are appropriate for various topics, from business to educational purposes. These themes come in many different styles, from creative to corporate, and all of them are easily adjustable and can be edited quickly. Access them as PowerPoint templates or as Google Slides themes. You dont have to go on a hunt for the perfect presentation because Slidegeeks got you covered from everywhere.

Strategic Guide To Perform Marketing Digital Marketing Metrics Dashboard To Track Diagrams PDF
This slide presents a dashboard to measure and track performance of digital marketing activities using various metrics. It highlights element such as leads, users, users to leads, leads to MQLs, MQLs to SQLs, SQLs to opportunities, social events and social interactions. Retrieve professionally designed Strategic Guide To Perform Marketing Digital Marketing Metrics Dashboard To Track Diagrams PDF to effectively convey your message and captivate your listeners. Save time by selecting pre-made slideshows that are appropriate for various topics, from business to educational purposes. These themes come in many different styles, from creative to corporate, and all of them are easily adjustable and can be edited quickly. Access them as PowerPoint templates or as Google Slides themes. You dont have to go on a hunt for the perfect presentation because Slidegeeks got you covered from everywhere.

Digital Marketing Strategy Dashboard To Track Social Media Marketing Campaign Metrics Diagrams PDF
This slide showcases dashboard that can help organization to track the metrics of social media marketing campaign. Its key components are followers, post reach, page impressions, visitors, avg engagement and lifetime views. Retrieve professionally designed Digital Marketing Strategy Dashboard To Track Social Media Marketing Campaign Metrics Diagrams PDF to effectively convey your message and captivate your listeners. Save time by selecting pre-made slideshows that are appropriate for various topics, from business to educational purposes. These themes come in many different styles, from creative to corporate, and all of them are easily adjustable and can be edited quickly. Access them as PowerPoint templates or as Google Slides themes. You dont have to go on a hunt for the perfect presentation because Slidegeeks got you covered from everywhere.

Creating Employee Value Proposition Key Components Of Employee Value Proposition Diagrams PDF
The following slide highlighting five key areas to focus while creating an employee value proposition. It includes key elements such as compensation, benefits, environment, career development and culture. Retrieve professionally designed Creating Employee Value Proposition Key Components Of Employee Value Proposition Diagrams PDF to effectively convey your message and captivate your listeners. Save time by selecting pre-made slideshows that are appropriate for various topics, from business to educational purposes. These themes come in many different styles, from creative to corporate, and all of them are easily adjustable and can be edited quickly. Access them as PowerPoint templates or as Google Slides themes. You dont have to go on a hunt for the perfect presentation because Slidegeeks got you covered from everywhere.

Adjusting Financial Strategies And Planning Tracking The Cashflow Improvements With Cash Management Diagrams PDF
This slide showcases the KPIs that would help our business organization to track the improvements in the new cash management process. It includes quick ratio, cash balance, current ratio, days inventory outstanding, etc. Retrieve professionally designed Adjusting Financial Strategies And Planning Tracking The Cashflow Improvements With Cash Management Diagrams PDF to effectively convey your message and captivate your listeners. Save time by selecting pre made slideshows that are appropriate for various topics, from business to educational purposes. These themes come in many different styles, from creative to corporate, and all of them are easily adjustable and can be edited quickly. Access them as PowerPoint templates or as Google Slides themes. You do not have to go on a hunt for the perfect presentation because Slidegeeks got you covered from everywhere.

Cost Of Implementing Blockchain And Distributed Ledger Technology Introduction PDF
Following slide showcases cost of blockchain technology implementation ,which are spent on multiple phases such as consulting, designing, development, quality assurance etc. All these costs are to be incurred in order to successfully implement blockchain technology. Persuade your audience using this Cost Of Implementing Blockchain And Distributed Ledger Technology Introduction PDF. This PPT design covers one stages, thus making it a great tool to use. It also caters to a variety of topics including Consulting, Designing, Development. Download this PPT design now to present a convincing pitch that not only emphasizes the topic but also showcases your presentation skills.
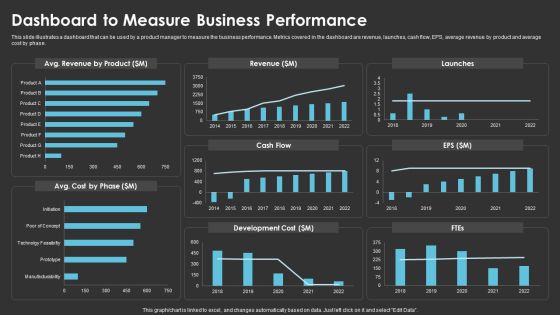
Method To Introduce New Product Offerings In The Industry Dashboard To Measure Business Performance Pictures PDF
This slide illustrates a dashboard that can be used by a product manager to measure the business performance. Metrics covered in the dashboard are revenue, launches, cash flow, EPS, average revenue by product and average cost by phase. Deliver and pitch your topic in the best possible manner with this Method To Introduce New Product Offerings In The Industry Dashboard To Measure Business Performance Pictures PDF. Use them to share invaluable insights on Revenue, Cash Flow, Development Cost and impress your audience. This template can be altered and modified as per your expectations. So, grab it now.

Project Controlling Dashboard Indicating Stages And Deliverables Ppt Styles Guide PDF
This slide shows dashboard for controlling multiple phases and deliverables of project. It provides information such as total revenue, cost, margin, task by status, risk, planned end date, owner, etc. Pitch your topic with ease and precision using this Project Controlling Dashboard Indicating Stages And Deliverables Ppt Styles Guide PDF. This layout presents information on Total Revenue, Total Margin, Total Cost. It is also available for immediate download and adjustment. So, changes can be made in the color, design, graphics or any other component to create a unique layout.
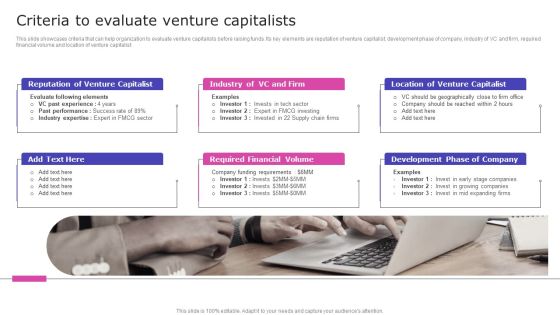
Strategic Fund Acquisition Plan For Business Opertions Expansion Criteria To Evaluate Venture Capitalists Information PDF
This slide showcases criteria that can help organization to evaluate venture capitalists before raising funds. Its key elements are reputation of venture capitalist, development phase of company, industry of VC and firm, required financial volume and location of venture capitalist. Find highly impressive Strategic Fund Acquisition Plan For Business Opertions Expansion Criteria To Evaluate Venture Capitalists Information PDF on Slidegeeks to deliver a meaningful presentation. You can save an ample amount of time using these presentation templates. No need to worry to prepare everything from scratch because Slidegeeks experts have already done a huge research and work for you. You need to download Strategic Fund Acquisition Plan For Business Opertions Expansion Criteria To Evaluate Venture Capitalists Information PDF for your upcoming presentation. All the presentation templates are 100 percent editable and you can change the color and personalize the content accordingly. Download now.

Company Product Sales Forecast Chart Guidelines PDF
This slide shows the Product sales forecast table with Product names along with price per unit and total units sold for the current as well as the projected period till the year 2023 Deliver an awe inspiring pitch with this creative company product sales forecast chart guidelines pdf bundle. Topics like company product sales forecast chart can be discussed with this completely editable template. It is available for immediate download depending on the needs and requirements of the user.

Yearly Selling Forecasts Revenue Chart Summary PDF
This slide covers projections for yearly revenue generation from product sales. It includes forecasted revenue for different years and a graph depicting the projected sales revenue growth. Showcasing this set of slides titled Yearly Selling Forecasts Revenue Chart Summary PDF. The topics addressed in these templates are Project Sales Revenue, Forecasts Revenue Chart. All the content presented in this PPT design is completely editable. Download it and make adjustments in color, background, font etc. as per your unique business setting.
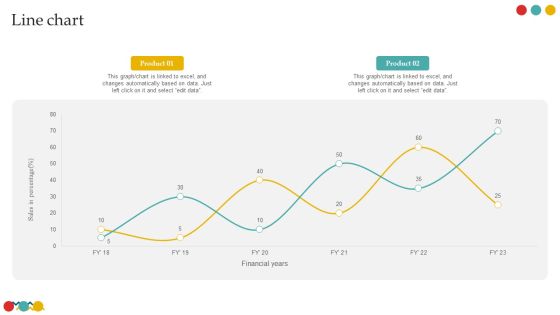
Line Chart Successful Rebranding Guide Designs PDF
Create an editable Line Chart Successful Rebranding Guide Designs PDF that communicates your idea and engages your audience. Whether you are presenting a business or an educational presentation, pre-designed presentation templates help save time. Line Chart Successful Rebranding Guide Designs PDF is highly customizable and very easy to edit, covering many different styles from creative to business presentations. Slidegeeks has creative team members who have crafted amazing templates. So, go and get them without any delay.

Quarterly Revenue Growth Linear Chart Elements PDF
This slide depicts the quarterly revenue generated to check the financial health of the business. It includes parts such as quarters and growth percent Showcasing this set of slides titled Quarterly Revenue Growth Linear Chart Elements PDF. The topics addressed in these templates are Observations, Growth Chart, Production. All the content presented in this PPT design is completely editable. Download it and make adjustments in color, background, font etc. as per your unique business setting.

Mind Map Chart Business Marketing Theme Ppt Plan Template Download PowerPoint Templates
We present our mind map chart business marketing theme ppt plan template download PowerPoint templates.Download our Technology PowerPoint Templates because Timeline crunches are a fact of life. Meet all deadlines using our PowerPoint Templates and Slides. Present our Competition PowerPoint Templates because It will let you Set new benchmarks with our PowerPoint Templates and Slides. They will keep your prospects well above par. Download our Boxes PowerPoint Templates because You can Give birth to your ideas with our PowerPoint Templates and Slides. See them grow big and strong in record time. Present our Process and Flows PowerPoint Templates because our PowerPoint Templates and Slides are the string of your bow. Fire of your ideas and conquer the podium. Download and present our Business PowerPoint Templates because Our PowerPoint Templates and Slides provide you with a vast range of viable options. Select the appropriate ones and just fill in your text. Use these PowerPoint slides for presentations relating to Chart, flow, organization, flowchart, box, vector, chain, information, 3d, network, isolated, program, business, blank, plan, concept, arrow, sign, teamwork, symbol, organisation, diagram, circle, graphic, process, workflow, technology, shape, management, graph, connection, solution, design, colorful, empty, procedure, connect, organize, background, work, structure, block. The prominent colors used in the PowerPoint template are Blue, White, Gray.

Organizational Operation Expenses Chart With Revenue Microsoft PDF
This slide covers the areas in which the organization has done the expenditure for the growth of the business. The areas includes marketing sales, R D and general and administration.Pitch your topic with ease and precision using this Organizational Operation Expenses Chart With Revenue Microsoft PDF. This layout presents information on Cost Revenue, Research Development, General Administrative. It is also available for immediate download and adjustment. So, changes can be made in the color, design, graphics or any other component to create a unique layout.
