Automated Dashboard

Email Based Permission Marketing Campaign Tracking Dashboard Portrait PDF
The following slide showcases email based permission marketing program tracking dashboard to help marketers make relevant decisions. It provides information about total subscribers, unsubscribes, source, form, etc. Do you have to make sure that everyone on your team knows about any specific topic I yes, then you should give Email Based Permission Marketing Campaign Tracking Dashboard Portrait PDF a try. Our experts have put a lot of knowledge and effort into creating this impeccable Email Based Permission Marketing Campaign Tracking Dashboard Portrait PDF. You can use this template for your upcoming presentations, as the slides are perfect to represent even the tiniest detail. You can download these templates from the Slidegeeks website and these are easy to edit. So grab these today.
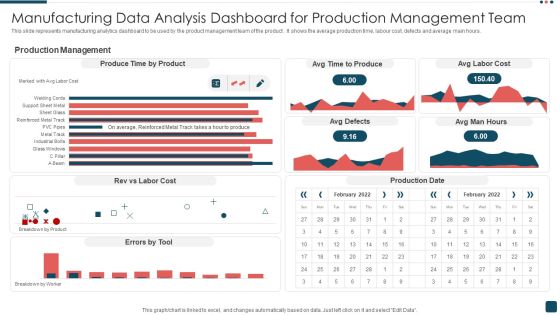
Manufacturing Data Analysis Dashboard For Production Management Team Summary PDF
This slide represents manufacturing analytics dashboard to be used by the product management team of the product . It shows the average production time, labour cost, defects and average main hours. Pitch your topic with ease and precision using this Manufacturing Data Analysis Dashboard For Production Management Team Summary PDF. This layout presents information on Production Management, Product, Cost. It is also available for immediate download and adjustment. So, changes can be made in the color, design, graphics or any other component to create a unique layout.

Product Manufacturing Data Analytics Kpis Dashboard Guidelines PDF
This slide represents the data analytics dashboard for production manufacturing and management. It includes details related to KPIs such as rework quantity, labor cost, performance, overall equipment effectiveness etc. Showcasing this set of slides titled Product Manufacturing Data Analytics Kpis Dashboard Guidelines PDF. The topics addressed in these templates are Quantity, Rework Quantity, Manufacturing Cost, Labor Cot. All the content presented in this PPT design is completely editable. Download it and make adjustments in color, background, font etc. as per your unique business setting.

Optimizing Online Stores Email Campaign Performance KPI Dashboard Graphics PDF
This slide covers dashboard providing an insight related to how subscribers and resonating with email marketing campaign. It key performance metrics such as sessions from email, sessions from email by campaign, sessions by email by date etc. Crafting an eye-catching presentation has never been more straightforward. Let your presentation shine with this tasteful yet straightforward Optimizing Online Stores Email Campaign Performance KPI Dashboard Graphics PDF template. It offers a minimalistic and classy look that is great for making a statement. The colors have been employed intelligently to add a bit of playfulness while still remaining professional. Construct the ideal Optimizing Online Stores Email Campaign Performance KPI Dashboard Graphics PDF that effortlessly grabs the attention of your audience Begin now and be certain to wow your customers.

Dashboard For Email Communication Kpis Metrics Topics PDF
This slide showcases email communication KPIs and dashboard that can help to keep track of performance of email marketing campaign. Its key elements are number of campaign, total recipients, average open percent and average click percent. Showcasing this set of slides titled Dashboard For Email Communication Kpis Metrics Topics PDF. The topics addressed in these templates are Number Campaigns, Total Recipients, Engagement Distribution. All the content presented in this PPT design is completely editable. Download it and make adjustments in color, background, font etc. as per your unique business setting.
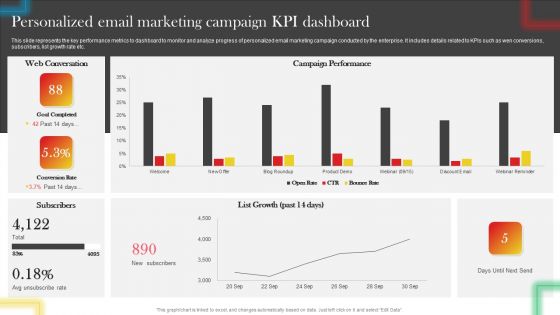
Personalized Email Marketing Campaign KPI Dashboard Inspiration PDF
This slide represents the key performance metrics to dashboard to monitor and analyze progress of personalized email marketing campaign conducted by the enterprise. It includes details related to KPIs such as wen conversions, subscribers, list growth rate etc. If your project calls for a presentation, then Slidegeeks is your go-to partner because we have professionally designed, easy-to-edit templates that are perfect for any presentation. After downloading, you can easily edit Personalized Email Marketing Campaign KPI Dashboard Inspiration PDF and make the changes accordingly. You can rearrange slides or fill them with different images. Check out all the handy templates
Transforming Business With AI Digital Media Tracking Dashboard Summary PDF
This slide covers the digital marketing dashboard along with the lead breakdown, google analytics traffic, and social media channels. Do you have to make sure that everyone on your team knows about any specific topic I yes, then you should give Transforming Business With AI Digital Media Tracking Dashboard Summary PDF a try. Our experts have put a lot of knowledge and effort into creating this impeccable Transforming Business With AI Digital Media Tracking Dashboard Summary PDF. You can use this template for your upcoming presentations, as the slides are perfect to represent even the tiniest detail. You can download these templates from the Slidegeeks website and these are easy to edit. So grab these today.

Email Marketing Digital Promotion Success Evaluation Dashboard Sample PDF
The slide demonstrates a dashboard to evaluate the success of marketing campaign for updating the strategies. Various KPIs included are average open rate per month, average click-through rate per month, average revenue on email per month, etc. Pitch your topic with ease and precision using this Email Marketing Digital Promotion Success Evaluation Dashboard Sample PDF. This layout presents information on Open Rate Per Month, Order Placed Per Month. It is also available for immediate download and adjustment. So, changes can be made in the color, design, graphics or any other component to create a unique layout.
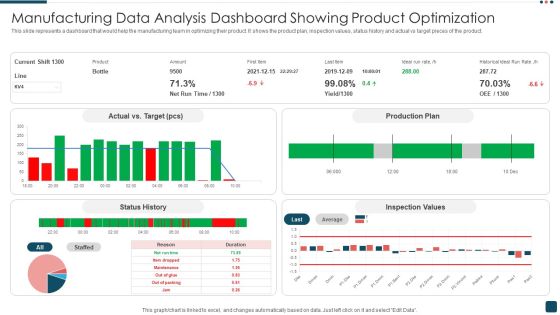
Manufacturing Data Analysis Dashboard Showing Product Optimization Structure PDF
This slide represents a dashboard that would help the manufacturing team in optimizing their product. It shows the product plan, inspection values, status history and actual vs target pieces of the product. Pitch your topic with ease and precision using this Manufacturing Data Analysis Dashboard Showing Product Optimization Structure PDF. This layout presents information on Target, Production Plan, Inspection Values. It is also available for immediate download and adjustment. So, changes can be made in the color, design, graphics or any other component to create a unique layout.
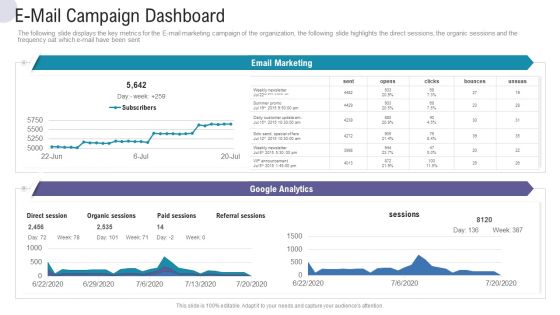
E-Mail Campaign Dashboard Commercial Activities Marketing Tools Mockup PDF
The following slide displays the key metrics for the E mail marketing campaign of the organization, the following slide highlights the direct sessions, the organic sessions and the frequency oat which e mail have been sent. Deliver and pitch your topic in the best possible manner with this e mail campaign dashboard commercial activities marketing tools mockup pdf. Use them to share invaluable insights on e mail campaign dashboard and impress your audience. This template can be altered and modified as per your expectations. So, grab it now.
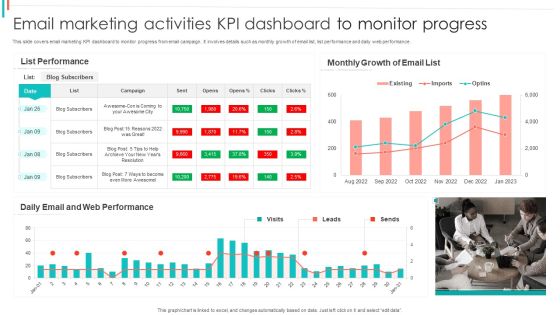
Email Marketing Activities KPI Dashboard To Monitor Progress Pictures PDF
This slide covers email marketing KPI dashboard to monitor progress from email campaign. It involves details such as monthly growth of email list, list performance and daily web performance.Showcasing this set of slides titled Email Marketing Activities KPI Dashboard To Monitor Progress Pictures PDF. The topics addressed in these templates are List Performance, Monthly Growth, Web Performance. All the content presented in this PPT design is completely editable. Download it and make adjustments in color, background, font etc. as per your unique business setting.

Email Marketing KPI Dashboard With Bounce Rate Demonstration PDF
The following slide showcases KPI dashboard which allows marketers to track the email marketing campaign performance. Information covered in this slide is related to total subscribers, types of email sent, open, clicks, bounces and unsubscribed etc. Showcasing this set of slides titled Email Marketing KPI Dashboard With Bounce Rate Demonstration PDF. The topics addressed in these templates are Organic, Paid, Information. All the content presented in this PPT design is completely editable. Download it and make adjustments in color, background, font etc. as per your unique business setting

Email Marketing Campaign Performance Dashboard Analysis Information PDF
This slide allows to track the performance of different email marketing campaigns and provides insights to improve business strategy. It includes monthly open and clicks rate, campaign investment returns, unsubscribed ratio, etc. Showcasing this set of slides titled Email Marketing Campaign Performance Dashboard Analysis Information PDF. The topics addressed in these templates are Performance Dashboard Analysis, Email Marketing Campaign. All the content presented in this PPT design is completely editable. Download it and make adjustments in color, background, font etc. as per your unique business setting.

TCM For Technical Analysis Dashboard Indicating Intervention Time Background PDF
This Slide shows technology change management dashboard indicating Change and Release Management which can be referred by It managers for effective handling of technical change. It includes information about operational, unassigned, overhead, hold, conflicts and rejected change. Showcasing this set of slides titled TCM For Technical Analysis Dashboard Indicating Intervention Time Background PDF. The topics addressed in these templates are Operational Change, Unassigned Changes, Change Overhead. All the content presented in this PPT design is completely editable. Download it and make adjustments in color, background, font etc. as per your unique business setting.

Consumer Partition Dashboard For Email Campaigns Infographics PDF
The following slide depicts a dashboard which can be used by marketers for sending targeted mails to customers and enhance customer retention. The key performing indicators are number of customers, average value or orders, number of orders, top ten percent customers etc. Showcasing this set of slides titled Consumer Partition Dashboard For Email Campaigns Infographics PDF. The topics addressed in these templates are Average Life Time Value, Average Value Of Orders, Returns, Average Number Of Orders. All the content presented in this PPT design is completely editable. Download it and make adjustments in color, background, font etc. as per your unique business setting.
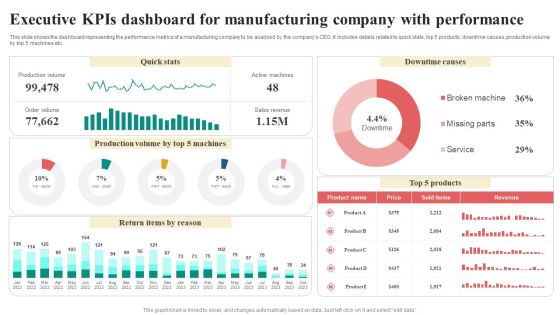
Executive Kpis Dashboard For Manufacturing Company With Performance Infographics PDF
This slide shows the dashboard representing the performance metrics of a manufacturing company to be analyzed by the companys CEO. It includes details related to quick stats, top 5 products, downtime causes, production volume by top 5 machines etc. Showcasing this set of slides titled Executive Kpis Dashboard For Manufacturing Company With Performance Infographics PDF. The topics addressed in these templates are Return Items By Reason, Quick Stats, Downtime Causes, Revenue. All the content presented in this PPT design is completely editable. Download it and make adjustments in color, background, font etc. as per your unique business setting.

Customer Goods Production Manufacturing Company Dashboard With Downtime Pictures PDF
This slide showcases the manufacturing company dashboard which showcases downtime causes top 5 products with price with sold items and revenue, it also includes production volume by top machines. This Customer Goods Production Manufacturing Company Dashboard With Downtime Pictures PDF is perfect for any presentation, be it in front of clients or colleagues. It is a versatile and stylish solution for organizing your meetings. The Customer Goods Production Manufacturing Company Dashboard With Downtime Pictures PDF features a modern design for your presentation meetings. The adjustable and customizable slides provide unlimited possibilities for acing up your presentation. Slidegeeks has done all the homework before launching the product for you. So, dont wait, grab the presentation templates today.
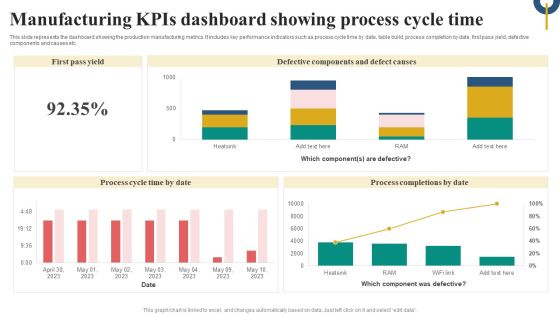
Manufacturing Kpis Dashboard Showing Process Cycle Time Microsoft PDF
This slide represents the dashboard showing the production manufacturing metrics. It includes key performance indicators such as process cycle time by date, table build, process completion by date, first pass yield, defective components and causes etc. Pitch your topic with ease and precision using this Manufacturing Kpis Dashboard Showing Process Cycle Time Microsoft PDF. This layout presents information on Defective Components Defect Causes, Process Cycle, Time By Date, Process Completions By Date. It is also available for immediate download and adjustment. So, changes can be made in the color, design, graphics or any other component to create a unique layout.
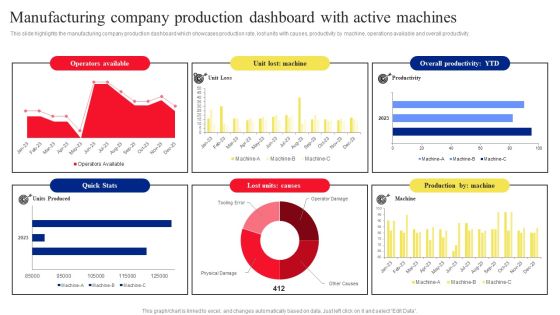
Manufacturing Company Production Dashboard With Active Machines Microsoft PDF
This slide highlights the manufacturing company production dashboard which showcases production rate, lost units with causes, productivity by machine, operations available and overall productivity. The Manufacturing Company Production Dashboard With Active Machines Microsoft PDF is a compilation of the most recent design trends as a series of slides. It is suitable for any subject or industry presentation, containing attractive visuals and photo spots for businesses to clearly express their messages. This template contains a variety of slides for the user to input data, such as structures to contrast two elements, bullet points, and slides for written information. Slidegeeks is prepared to create an impression.

Dashboard For RPA Implementation For Healthcare Management Slides PDF
This slide provides a detailed information about performance of RPA bots on various processes of organization. It includes time saved by bots, money saved by process, total hours saved, total bot run time etc. Formulating a presentation can take up a lot of effort and time, so the content and message should always be the primary focus. The visuals of the PowerPoint can enhance the presenters message, so our Dashboard For RPA Implementation For Healthcare Management Slides PDF was created to help save time. Instead of worrying about the design, the presenter can concentrate on the message while our designers work on creating the ideal templates for whatever situation is needed. Slidegeeks has experts for everything from amazing designs to valuable content, we have put everything into Dashboard For RPA Implementation For Healthcare Management Slides PDF.

Big Data In Health Industry Dashboard In Industry Summary PDF
The slide depicts patient KPI dashboard for healthcare which can be used to improve service levels as well as treatment across departments. It include metrics such as bed occupancy rate, patient turnover, satisfaction rate, missed and cancelled appointment rate. Showcasing this set of slides titled Big Data In Health Industry Dashboard In Industry Summary PDF. The topics addressed in these templates are Geriatrics, Gynecology, Internal Medicine. All the content presented in this PPT design is completely editable. Download it and make adjustments in color, background, font etc. as per your unique business setting.

AI In US Healthcare Market Dashboard Brochure PDF
This slide illustrates facts and figures related to use of artificial intelligence in healthcare. It includes North America share in global market, US share in the region, etc. Pitch your topic with ease and precision using this AI In US Healthcare Market Dashboard Brochure PDF. This layout presents information on Driving Factors, AI Growth, Market Dashboard. It is also available for immediate download and adjustment. So, changes can be made in the color, design, graphics or any other component to create a unique layout.

Safety Kpis Dashboard For Manufacturing Company Slides PDF
This slide shows the metrics dashboard representing the safety metrics for the manufacturing company. It includes details related to incidents per employee, total number of incidents in the company, incidents accumulated total etc.. Pitch your topic with ease and precision using this Safety Kpis Dashboard For Manufacturing Company Slides PDF. This layout presents information on Incidents Per Employee, Safety Incident Reported, Incidence Avoidance Quiz Score. It is also available for immediate download and adjustment. So, changes can be made in the color, design, graphics or any other component to create a unique layout.
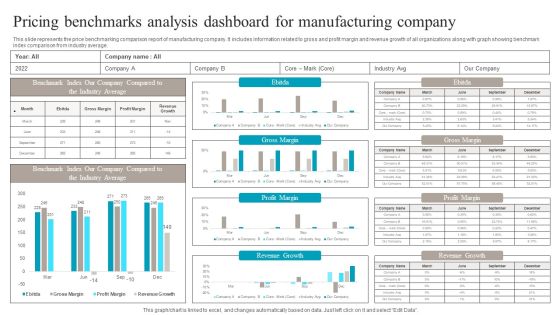
Pricing Benchmarks Analysis Dashboard For Manufacturing Company Structure PDF
This slide represents the price benchmarking comparison report of manufacturing company. It includes information related to gross and profit margin and revenue growth of all organizations along with graph showing benchmark index comparison from industry average. Pitch your topic with ease and precision using this Pricing Benchmarks Analysis Dashboard For Manufacturing Company Structure PDF. This layout presents information on Pricing Benchmarks Analysis, Dashboard For Manufacturing Company. It is also available for immediate download and adjustment. So, changes can be made in the color, design, graphics or any other component to create a unique layout.

Dashboard To Measure Performance Of RPA Implementation Mockup PDF
This slide represents the critical performance indicators of RPA, such as time and money saved by different processes and the efficiency of the HR department in routine tasks. Deliver and pitch your topic in the best possible manner with this Dashboard To Measure Performance Of RPA Implementation Mockup PDF. Use them to share invaluable insights on Credit Analysis, Department And Process and impress your audience. This template can be altered and modified as per your expectations. So, grab it now.

Manufactured Products Sales Performance Monitoring Dashboard Information PDF
This slide shows the dashboard the data related to the sales performance of the products manufactured by the organization in order to effectively measure and monitor the performance of the sales team. It shows details related to revenue generated and units sold etc.Pitch your topic with ease and precision using this Manufactured Products Sales Performance Monitoring Dashboard Information PDF. This layout presents information on Monthly Revenue, Manufactured Products, Sales Performance Monitoring. It is also available for immediate download and adjustment. So, changes can be made in the color, design, graphics or any other component to create a unique layout.
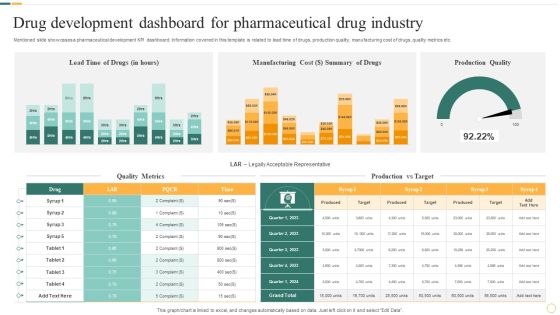
Drug Development Dashboard For Pharmaceutical Drug Industry Portrait PDF
Mentioned slide showcases a pharmaceutical development KPI dashboard. Information covered in this template is related to lead time of drugs, production quality, manufacturing cost of drugs, quality metrics etc. Showcasing this set of slides titled Drug Development Dashboard For Pharmaceutical Drug Industry Portrait PDF. The topics addressed in these templates are Manufacturing Cost, Summary Of Drugs, Production Quality. All the content presented in this PPT design is completely editable. Download it and make adjustments in color, background, font etc. as per your unique business setting.

Smart Manufacturing Dashboard To Track Production Quality Rules PDF
This slide represents smart manufacturing dashboard. It covers production volume, downtime causes, top product sold item, sales revenue, active machinery etc.Boost your pitch with our creative Smart Manufacturing Dashboard To Track Production Quality Rules PDF. Deliver an awe-inspiring pitch that will mesmerize everyone. Using these presentation templates you will surely catch everyones attention. You can browse the ppts collection on our website. We have researchers who are experts at creating the right content for the templates. So you do not have to invest time in any additional work. Just grab the template now and use them.
Manufacturing Company Stock Level Performance Monitoring Dashboard Icons PDF
This slide shows the dashboard for monitoring the inventory level of the manufacturing organization. It shows details related to total stock units, total stock value, capacity and positions of stock, inventory turnover, slow moving stock etc.Showcasing this set of slides titled Manufacturing Company Stock Level Performance Monitoring Dashboard Icons PDF. The topics addressed in these templates are Stock Positions, Stock Volume, Moving Stock. All the content presented in this PPT design is completely editable. Download it and make adjustments in color, background, font etc. as per your unique business setting.

Optimizing Production Process Smart Manufacturing Dashboard For Inventory Template PDF
This slide represents smart manufacturing dashboard for inventory management. It includes inventory carrying cost, inventory turnover, inventory to sales ratio etc. Slidegeeks is here to make your presentations a breeze with Optimizing Production Process Smart Manufacturing Dashboard For Inventory Template PDF With our easy-to-use and customizable templates, you can focus on delivering your ideas rather than worrying about formatting. With a variety of designs to choose from, youre sure to find one that suits your needs. And with animations and unique photos, illustrations, and fonts, you can make your presentation pop. So whether youre giving a sales pitch or presenting to the board, make sure to check out Slidegeeks first.
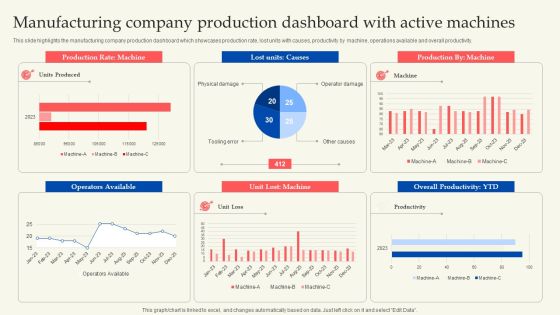
Manufacturing Company Production Dashboard With Active Machines Template PDF
This slide highlights the manufacturing company production dashboard which showcases production rate, lost units with causes, productivity by machine, operations available and overall productivity. Take your projects to the next level with our ultimate collection of Manufacturing Company Production Dashboard With Active Machines Template PDF. Slidegeeks has designed a range of layouts that are perfect for representing task or activity duration, keeping track of all your deadlines at a glance. Tailor these designs to your exact needs and give them a truly corporate look with your own brand colors they will make your projects stand out from the rest.
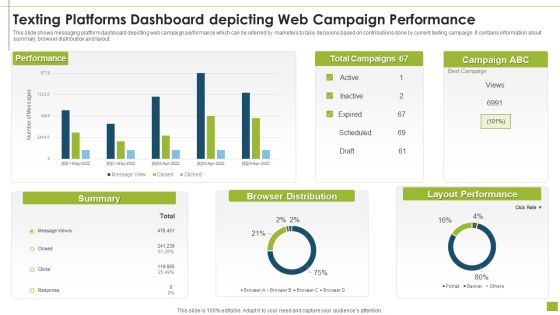
Texting Platforms Dashboard Depicting Web Campaign Performance Pictures PDF
This slide shows messaging platform dashboard depicting web campaign performance which can be referred by marketers to take decisions based on contributions done by current texting campaign. It contains information about summary, browser distribution and layout.Pitch your topic with ease and precision using this texting platforms dashboard depicting web campaign performance pictures pdf This layout presents information on browser distribution, layout performance, summary It is also available for immediate download and adjustment. So, changes can be made in the color, design, graphics or any other component to create a unique layout.

Auto Insurance Policies Claims Management Dashboard Infographics PDF
This slide illustrates graphical representation of data that helps the insurer company manages the car insurance policy claims. It includes no. of claims, percentage of claims, claims by usage, claims by type of vehicle etc. Pitch your topic with ease and precision using this Auto Insurance Policies Claims Management Dashboard Infographics PDF. This layout presents information on Percentage Claims, Claims Usage, Claims Type Vehicle. It is also available for immediate download and adjustment. So, changes can be made in the color, design, graphics or any other component to create a unique layout.
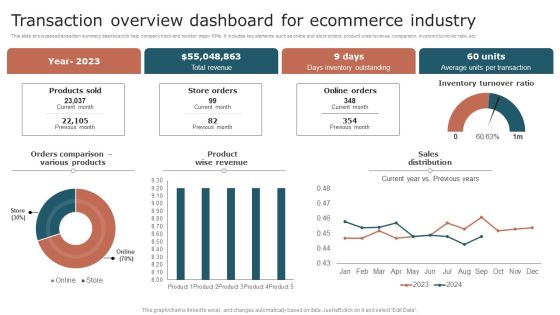
Transaction Overview Dashboard For Ecommerce Industry Summary PDF
This slide showcases transaction summary dashboard to help company track and monitor major KPIs. It includes key elements such as online and store orders, product wise revenue, comparison, inventory turnover ratio, etc. Pitch your topic with ease and precision using this Transaction Overview Dashboard For Ecommerce Industry Summary PDF. This layout presents information on Revenue, Inventory Outstanding, Transaction. It is also available for immediate download and adjustment. So, changes can be made in the color, design, graphics or any other component to create a unique layout.

Share Market Portfolio Dashboard Of Various Industries Graphics PDF
Following slide outlines a comprehensive stock market dashboard of various industries such as investment banking and services, banking services etc. This slide provides information about names of different stocks, total percent of allocation in various sectors, market value of each company, watchlist etc. Showcasing this set of slides titled Share Market Portfolio Dashboard Of Various Industries Graphics PDF. The topics addressed in these templates are Portfolio By Industry, Watchlist, Various Industries. All the content presented in this PPT design is completely editable. Download it and make adjustments in color, background, font etc. as per your unique business setting.

Dashboard To Track Performance Of Buyer Marketing Campaign Infographics PDF
This slide depicts a Dashboard which can be used to track performance of shopper marketing campaign on digital platforms. The key performance indicators include Website leads, Current service users, Lead conversion rate, Lead satisfaction rate etc. Pitch your topic with ease and precision using this Dashboard To Track Performance Of Buyer Marketing Campaign Infographics PDF. This layout presents information on Social Media Campaign, Social Media Engagement, Current Service Users. It is also available for immediate download and adjustment. So, changes can be made in the color, design, graphics or any other component to create a unique layout.

Dashboard Of Industry Project Personnel Planning With Proportion Professional PDF
The following slide highlights the dashboard of industry project manpower planning with proportion illustrating current manpower and vacancy, vacancy by domain, age proportion, gender proportion, discipline proportion, qualification proportion and residential status. Pitch your topic with ease and precision using this Dashboard Of Industry Project Personnel Planning With Proportion Professional PDF. This layout presents information on Current Manpower And Vacancy, Gender Proportion, Qualification Proportion. It is also available for immediate download and adjustment. So, changes can be made in the color, design, graphics or any other component to create a unique layout.

Continuous Process Improvement KPI Dashboard For IT Industry Clipart PDF
Following slide depicts the IT industry KPI dashboard which will assist in generating more of profit by improving strategic plan according to changing environment with clients preferences .The KPI mentioned in a slide are such as risk analysis, outstanding task , upcoming task, budget analysis, etc. Pitch your topic with ease and precision using this Continuous Process Improvement KPI Dashboard For IT Industry Clipart PDF. This layout presents information on Overall Progress, Risk Analysis, Budget Analysis. It is also available for immediate download and adjustment. So, changes can be made in the color, design, graphics or any other component to create a unique layout.
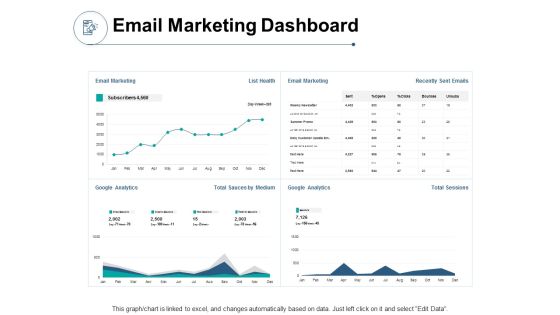
Email Marketing Dashboard Ppt PowerPoint Presentation Styles Design Inspiration
Presenting this set of slides with name email marketing dashboard ppt powerpoint presentation styles design inspiration. The topics discussed in these slides are finance, marketing, management, investment, analysis. This is a completely editable PowerPoint presentation and is available for immediate download. Download now and impress your audience.

Email Marketing Dashboard Ppt PowerPoint Presentation Infographic Template Diagrams
Presenting this set of slides with name email marketing dashboard ppt powerpoint presentation infographic template diagrams. The topics discussed in these slides are finance, marketing, management, investment, analysis. This is a completely editable PowerPoint presentation and is available for immediate download. Download now and impress your audience.

Improving Client Experience Email Marketing Dashboard Rate Clipart PDF
Deliver and pitch your topic in the best possible manner with this improving client experience email marketing dashboard rate clipart pdf. Use them to share invaluable insights on campaign, sales, conversions and impress your audience. This template can be altered and modified as per your expectations. So, grab it now.
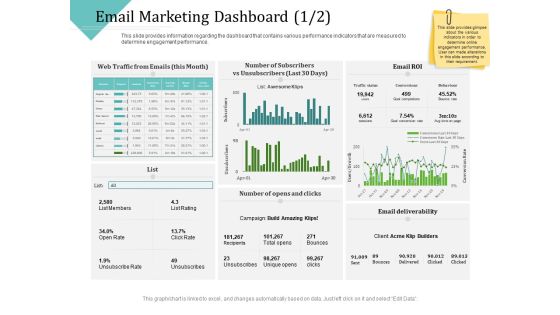
Improving Client Experience Email Marketing Dashboard Click Demonstration PDF
Deliver and pitch your topic in the best possible manner with this improving client experience email marketing dashboard click demonstration pdf. Use them to share invaluable insights on campaign, traffic status, social, organic, paid search and impress your audience. This template can be altered and modified as per your expectations. So, grab it now.
Overall Marketing Dashboard Showcasing Market Performance Icons PDF
This slide showcases mass marketing dashboard which helps marketers in assessing there business performance. It provides information regarding net promoter score, inbound leads, sales per platform etc. Showcasing this set of slides titled Overall Marketing Dashboard Showcasing Market Performance Icons PDF. The topics addressed in these templates are Standard Customers, Market Share Growth Rate, Customer Locations . All the content presented in this PPT design is completely editable. Download it and make adjustments in color, background, font etc. as per your unique business setting.

Dashboard Showing Monitoring Campaign Of Marketing Ppt Infographics PDF
This slide represents dashboard showcasing campaign report. It includes recipients, email clients, open rate, spam complaints etc that enable organization in analyzing progress of marketing campaign to develop more effective strategies. Showcasing this set of slides titled Dashboard Showing Monitoring Campaign Of Marketing Ppt Infographics PDF. The topics addressed in these templates are Recipients, Open Rate, Spam Complaints, Shares. All the content presented in this PPT design is completely editable. Download it and make adjustments in color, background, font etc. as per your unique business setting.

Setting Recruitment Targets Based On Diversity Dashboard Information PDF
This slide covers the diversity dashboard which organizations can use to set recruitment targets. Key elements of the dashboard are current designated number of female employees, minority groups, people with disability, and LGBT community and expected number in coming year. The Setting Recruitment Targets Based On Diversity Dashboard Information PDF is a compilation of the most recent design trends as a series of slides. It is suitable for any subject or industry presentation, containing attractive visuals and photo spots for businesses to clearly express their messages. This template contains a variety of slides for the user to input data, such as structures to contrast two elements, bullet points, and slides for written information. Slidegeeks is prepared to create an impression.
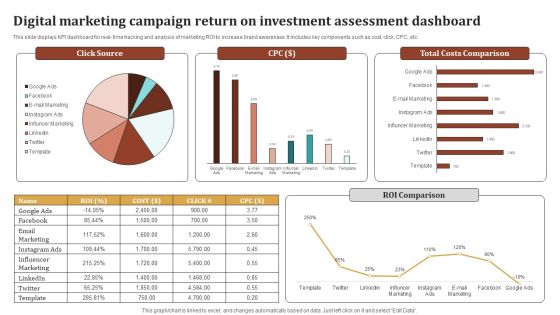
Digital Marketing Campaign Return On Investment Assessment Dashboard Ideas PDF
This slide displays KPI dashboard for real- time tracking and analysis of marketing ROI to increase brand awareness. It includes key components such as cost, click, CPC, etc. Showcasing this set of slides titled Digital Marketing Campaign Return On Investment Assessment Dashboard Ideas PDF. The topics addressed in these templates are Influencer Marketing, Email Marketing, Total Costs Comparison, Roi Comparison. All the content presented in this PPT design is completely editable. Download it and make adjustments in color, background, font etc. as per your unique business setting.

Online Marketing Activities KPI Dashboard To Improve Sales Ideas PDF
This slide covers online marketing dashboard to improve sales. It involves details such as web performance, conversion funnel, revenue this month, traffic sources and number of followers on social media.Pitch your topic with ease and precision using this Online Marketing Activities KPI Dashboard To Improve Sales Ideas PDF. This layout presents information on Email Performance, Web Performance, Cost Conversion. It is also available for immediate download and adjustment. So, changes can be made in the color, design, graphics or any other component to create a unique layout.
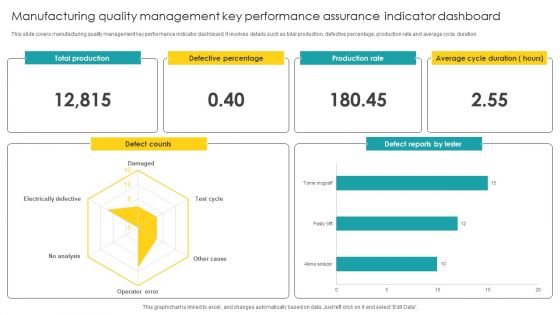
Manufacturing Quality Management Key Performance Assurance Indicator Dashboard Microsoft PDF
Pitch your topic with ease and precision using this Manufacturing Quality Management Key Performance Assurance Indicator Dashboard Microsoft PDF. This layout presents information on Quality Management, Key Performance Assurance. It is also available for immediate download and adjustment. So, changes can be made in the color, design, graphics or any other component to create a unique layout.

Organization IT Service Desk Administration Performance Dashboard Infographics PDF
This slide represents the dashboard showing the performance of the service desk management team of the organization. It shows details related to benchmark achieved, customer satisfaction, contracts by type and manufacturer, incidents by category, computer by status, service level management etc. Showcasing this set of slides titled Organization IT Service Desk Administration Performance Dashboard Infographics PDF. The topics addressed in these templates are Service, Management, Manufacturer. All the content presented in this PPT design is completely editable. Download it and make adjustments in color, background, font etc. as per your unique business setting.

Dashboard Depicting Resource Planning Management With Departments Designs PDF
This slide focuses on the dashboard that depicts the resourcing plan which includes capacity, scheduled, unscheduled, time off and overtime hours with name of the resource, department such as creative, design, technical, etc. with capacity, scheduled and billable percentage, etc. Showcasing this set of slides titled Dashboard Depicting Resource Planning Management With Departments Designs PDF. The topics addressed in these templates are Resource, Design, Technical. All the content presented in this PPT design is completely editable. Download it and make adjustments in color, background, font etc. as per your unique business setting.
KPI Dashboard For Tracking Supply Chain Costs Inspiration PDF
This slide represents the KPI dashboard to track the multiple cost associated with supply chain in food manufacturing industry. It includes information regarding cash to cash cycle in days, carry cost of inventory along with details of net sales. Deliver an awe inspiring pitch with this creative KPI Dashboard For Tracking Supply Chain Costs Inspiration PDF bundle. Topics like Supply Chain Costs, Average Cash, Service can be discussed with this completely editable template. It is available for immediate download depending on the needs and requirements of the user.

Freelance Content Marketing Dashboard With Metrics Demonstration PDF
The following slide highlights the freelance content marketing dashboard with metrics illustrating most visited content, monthly total visit, average content score. It depicts key metrics which includes content reach, unique visits, organic ranking, number of shares, rating, session time and repeat visitors. Showcasing this set of slides titled Freelance Content Marketing Dashboard With Metrics Demonstration PDF. The topics addressed in these templates are Organic Ranking, Manufacturing, Average Content Score. All the content presented in this PPT design is completely editable. Download it and make adjustments in color, background, font etc. as per your unique business setting.

Performance KPI Dashboard Highlighting Boosting Brand Image Sample PDF
The following slide depicts a performance based dashboard to be used by brand managers to track the efficiency of marketing activities across platforms which has led to an increase in overall brand awareness. The key performing indicators are total website visits, user session, website mention, shares etc. Showcasing this set of slides titled Performance KPI Dashboard Highlighting Boosting Brand Image Sample PDF. The topics addressed in these templates are Social Media, Backlinks, Mentions Tags. All the content presented in this PPT design is completely editable. Download it and make adjustments in color, background, font etc. as per your unique business setting.

Share Market Dashboard Highlighting Price Moving Average Trend Themes PDF
Following slide outlines stock market dashboard of an industry. The various metrics highlighted in the slide are stock codes, previous day price of stock, percent of price change, maximum and lowest price of stock, moving average trend etc. Pitch your topic with ease and precision using this Share Market Dashboard Highlighting Price Moving Average Trend Themes PDF. This layout presents information on Moving Average, Stock Price, Performing Stocks. It is also available for immediate download and adjustment. So, changes can be made in the color, design, graphics or any other component to create a unique layout.

Hoshin Kanri Pitch Deck Lean Production Process Dashboard Guidelines PDF
This template covers lean manufacturing process dashboard including key performance indicators such as lead production, utilization of machines , OEE and AMO for different processes Deliver and pitch your topic in the best possible manner with this hoshin kanri pitch deck lean production process dashboard guidelines pdf Use them to share invaluable insights on utilization of machines, combined oee of machines, production lead time distribution and impress your audience. This template can be altered and modified as per your expectations. So, grab it now.
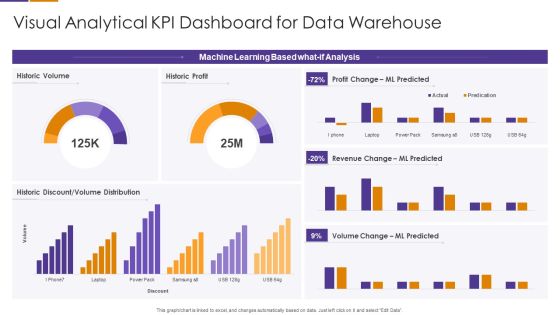
Visual Analytical KPI Dashboard For Data Warehouse Template PDF
Pitch your topic with ease and precision using this Visual Analytical KPI Dashboard For Data Warehouse Template PDF This layout presents information on Machine Learning Based, Volume Change, Revenue Change It is also available for immediate download and adjustment. So, changes can be made in the color, design, graphics or any other component to create a unique layout.
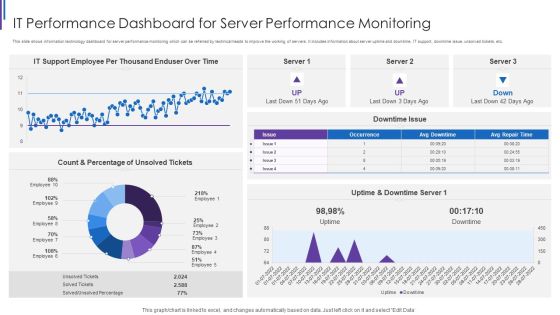
IT Performance Dashboard For Server Performance Monitoring Portrait PDF
This slide shows information technology dashboard for server performance monitoring which can be referred by technical heads to improve the working of servers. It includes information about server uptime and downtime, IT support, downtime issue, unsolved tickets, etc. Showcasing this set of slides titled IT Performance Dashboard For Server Performance Monitoring Portrait PDF. The topics addressed in these templates are IT Support Employee, Per Thousand Enduser, Uptime And Downtime, Count And Percentage. All the content presented in this PPT design is completely editable. Download it and make adjustments in color, background, font etc. as per your unique business setting.

KPI Dashboard For Measuring Information Technology Business Performance Designs PDF
This slide shows KPI dashboard for measuring information technology business performance which can be referred by technical organizations to analyze their annual performance. It includes information about monthly recurring revenue, customer acquisition cost, signups and paying customers, visitors and signups, runway, etc. Showcasing this set of slides titled KPI Dashboard For Measuring Information Technology Business Performance Designs PDF. The topics addressed in these templates are Signups And Paying, Customers Monthly Growth, Visitors And Signups, Monthly Average Revenue. All the content presented in this PPT design is completely editable. Download it and make adjustments in color, background, font etc. as per your unique business setting.

Call Center Metrics Dashboard With Customer Satisfaction Score Ideas PDF
Mentioned slide outlines a comprehensive call center KPI dashboard which can be used for those customers who are seeking technical support. It provides detailed information about metrics such as ticket status, ticket by channels and type, overall customer satisfaction score, etc. Showcasing this set of slides titled Call Center Metrics Dashboard With Customer Satisfaction Score Ideas PDF. The topics addressed in these templates are Customer Satisfaction, Score Ticket Status, Satisfaction Score. All the content presented in this PPT design is completely editable. Download it and make adjustments in color, background, font etc. as per your unique business setting.

Performance Measuring Dashboard For Diversity And Inclusion Program Template PDF
This slide depicts the performance measuring dashboard for diversity and inclusion program providing information regarding the employee engagement, workforce by disability type, unconscious biases complaints etc. The Performance Measuring Dashboard For Diversity And Inclusion Program Template PDF is a compilation of the most recent design trends as a series of slides. It is suitable for any subject or industry presentation, containing attractive visuals and photo spots for businesses to clearly express their messages. This template contains a variety of slides for the user to input data, such as structures to contrast two elements, bullet points, and slides for written information. Slidegeeks is prepared to create an impression.
Social Media Performance Tracking And Monitoring Dashboard Graphics PDF
The following slide showcases a dashboard to track and measure social media platforms performance. It includes key elements such as website traffic, social media referral rate, site revenue, social media site revenue, etc. The Social Media Performance Tracking And Monitoring Dashboard Graphics PDF is a compilation of the most recent design trends as a series of slides. It is suitable for any subject or industry presentation, containing attractive visuals and photo spots for businesses to clearly express their messages. This template contains a variety of slides for the user to input data, such as structures to contrast two elements, bullet points, and slides for written information. Slidegeeks is prepared to create an impression.
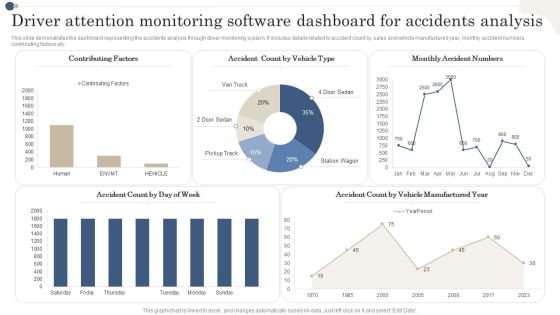
Driver Attention Monitoring Software Dashboard For Accidents Analysis Diagrams PDF
This slide demonstrates the dashboard representing the accidents analysis through driver monitoring system. It includes details related to accident count by sales and vehicle manufactured year, monthly accident numbers, contributing factors etc. Showcasing this set of slides titled Driver Attention Monitoring Software Dashboard For Accidents Analysis Diagrams PDF. The topics addressed in these templates are Contributing Factors,Vehicle Type, Monthly Accident Numbers. All the content presented in this PPT design is completely editable. Download it and make adjustments in color, background, font etc. as per your unique business setting.

Production Metric Dashboard For Equipment Performance Measurement Slides PDF
This slide represents lean manufacturing dashboard for performance measurement. It covers equipment status timeline, downtime etc Want to ace your presentation in front of a live audience Our Production Metric Dashboard For Equipment Performance Measurement Slides PDF can help you do that by engaging all the users towards you. Slidegeeks experts have put their efforts and expertise into creating these impeccable powerpoint presentations so that you can communicate your ideas clearly. Moreover, all the templates are customizable, and easy to edit and downloadable. Use these for both personal and commercial use.

Dashboard For Business To Business Market Division Inspiration PDF
This slide illustrates the market segmentation dashboard for B2B which can benefit them to improve the focus and boost the revenue of the organization. It includes the Division according to industries and company size. Showcasing this set of slides titled Dashboard For Business To Business Market Division Inspiration PDF. The topics addressed in these templates are Industries, Service, Automobiles. All the content presented in this PPT design is completely editable. Download it and make adjustments in color, background, font etc. as per your unique business setting.
Monthly Comparison Dashboard For Lead Tracking Sample PDF
This slide showcases dashboard that can help organization to compare the leads converted in different months and make changes in sales and marketing campaigns . Its key components lead generated by country, by industry type and lead sources by month. Showcasing this set of slides titled Monthly Comparison Dashboard For Lead Tracking Sample PDF. The topics addressed in these templates are Leads Received, Industry Type, Lead Generated. All the content presented in this PPT design is completely editable. Download it and make adjustments in color, background, font etc. as per your unique business setting.
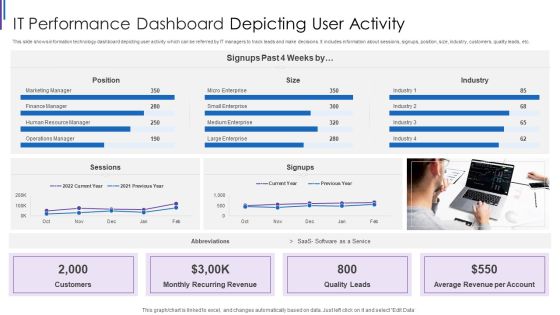
IT Performance Dashboard Depicting User Activity Inspiration PDF
This slide shows information technology dashboard depicting user activity which can be referred by IT managers to track leads and make decisions. It includes information about sessions, signups, position, size, industry, customers, quality leads, etc. Pitch your topic with ease and precision using this IT Performance Dashboard Depicting User Activity Inspiration PDF. This layout presents information on Monthly Recurring Revenue, Average Revenue Per, Account Quality Leads, Customers Position Sessions. It is also available for immediate download and adjustment. So, changes can be made in the color, design, graphics or any other component to create a unique layout.
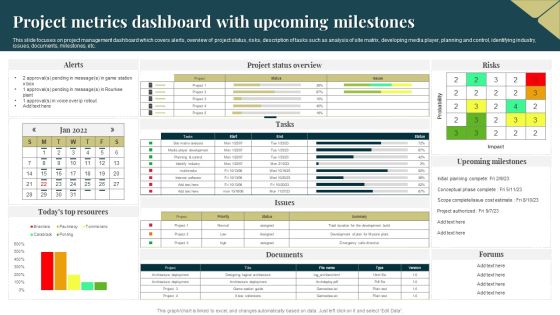
Project Metrics Dashboard With Upcoming Milestones Demonstration PDF
This slide focuses on project management dashboard which covers alerts, overview of project status, risks, description of tasks such as analysis of site matrix, developing media player, planning and control, identifying industry, issues, documents, milestones, etc. Pitch your topic with ease and precision using this Project Metrics Dashboard With Upcoming Milestones Demonstration PDF. This layout presents information on Probability, Project, Risks. It is also available for immediate download and adjustment. So, changes can be made in the color, design, graphics or any other component to create a unique layout.
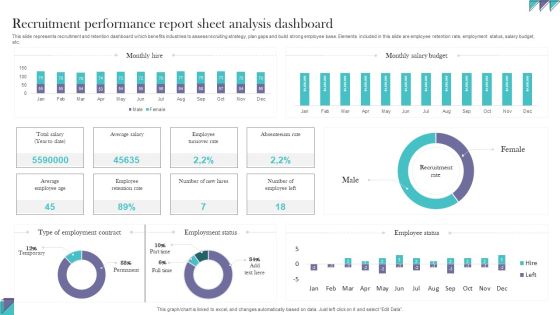
Recruitment Performance Report Sheet Analysis Dashboard Information PDF
This slide represents recruitment and retention dashboard which benefits industries to assess recruiting strategy, plan gaps and build strong employee base. Elements included in this slide are employee retention rate, employment status, salary budget, etc. Pitch your topic with ease and precision using this Recruitment Performance Report Sheet Analysis Dashboard Information PDF. This layout presents information onRecruitment Performance, Report Sheet Analysis. It is also available for immediate download and adjustment. So, changes can be made in the color, design, graphics or any other component to create a unique layout.

Dashboard For Measuring And Assessing Communication Tactics Information PDF
This slide represents dashboard to assess and gauge internal communication approaches which benefits industries in assessing strategy, plan gaps and build efficient employee engagement. Elements included in this slide are engagement score, employee satisfaction rate, communication tools and strategies, etc. Showcasing this set of slides titled Dashboard For Measuring And Assessing Communication Tactics Information PDF. The topics addressed in these templates are Employee Engagement, Employee Response Rate, Communication Effectiveness. All the content presented in this PPT design is completely editable. Download it and make adjustments in color, background, font etc. as per your unique business setting.

KPI Dashboard To Measure Performance Of Saas Company Introduction PDF
This slide provides an overview of the SaaS metrics dashboard. The company can track the overall progress of their business model by tracking metrics such as quality leads, ARPA, signups past 4 weeks, net MRR churn rate, new business MRR, etc. Pitch your topic with ease and precision using this KPI Dashboard To Measure Performance Of Saas Company Introduction PDF. This layout presents information on Industry, Position, Customers, Quality Leads. It is also available for immediate download and adjustment. So, changes can be made in the color, design, graphics or any other component to create a unique layout.
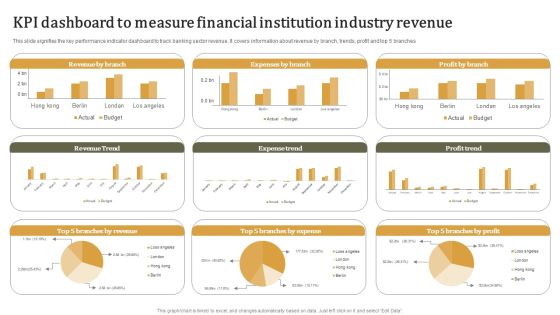
KPI Dashboard To Measure Financial Institution Industry Revenue Summary PDF
Pitch your topic with ease and precision using this KPI Dashboard To Measure Financial Institution Industry Revenue Summary PDF. This layout presents information on Measure Financial, Institution Industry . It is also available for immediate download and adjustment. So, changes can be made in the color, design, graphics or any other component to create a unique layout.
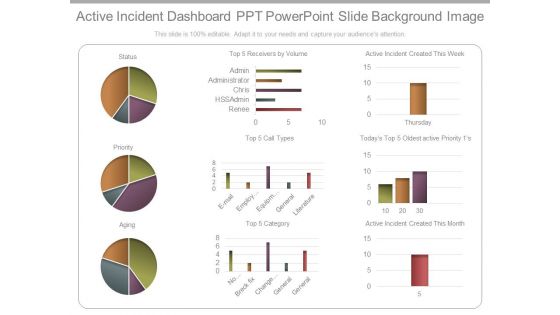
Active Incident Dashboard Ppt Powerpoint Slide Background Image
This is a active incident dashboard ppt powerpoint slide background image. This is a three stage process. The stages in this process are status, priority, aging, receivers by volume, renee, hssadmin, chris, administrator, admin, category, email, employee setup, equipment, general, literature, no category, breck fix, change management, general, active incident created this week, oldest active priority, active incident created this month, thursday.

Business Operations Assessment Business Management Dashboard Ppt Infographic Template PDF
Deliver an awe-inspiring pitch with this creative business operations assessment business management dashboard ppt infographic template pdf bundle. Topics like adverts, out costs, products, operations, manufacturing, revenue can be discussed with this completely editable template. It is available for immediate download depending on the needs and requirements of the user.

Customer Relationship Management Dashboard CRM Process Strategy Ideas PDF
Deliver an awe inspiring pitch with this creative customer relationship management dashboard crm process strategy ideas pdf bundle. Topics like customer service management, demand management, order fulfillment, manufacturing flow management can be discussed with this completely editable template. It is available for immediate download depending on the needs and requirements of the user.

Commodity Category Analysis Product Management KPI Dashboard Inspiration PDF
Deliver an awe inspiring pitch with this creative commodity category analysis product management kpi dashboard inspiration pdf bundle. Topics like key market drivers, industry growth trend, product preference can be discussed with this completely editable template. It is available for immediate download depending on the needs and requirements of the user.
Tracking Energy Consumption KPI Dashboard Average Ppt Gallery Slides PDF
Deliver and pitch your topic in the best possible manner with this tracking energy consumption kpi dashboard average ppt gallery slides pdf. Use them to share invaluable insights on industry, service, transport, sales, sources and impress your audience. This template can be altered and modified as per your expectations. So, grab it now.
Email Marketing Campaign Kpis Tracking Dashboard Template PDF
This slide shows key performance indicators KPI dashboard for measuring the effectiveness of email campaigns. It provides information about sent, delivered, opens, clicks, unsubscribed, bounces, complaints, etc. Are you in need of a template that can accommodate all of your creative concepts This one is crafted professionally and can be altered to fit any style. Use it with Google Slides or PowerPoint. Include striking photographs, symbols, depictions, and other visuals. Fill, move around, or remove text boxes as desired. Test out color palettes and font mixtures. Edit and save your work, or work with colleagues. Download Email Marketing Campaign Kpis Tracking Dashboard Template PDF and observe how to make your presentation outstanding. Give an impeccable presentation to your group and make your presentation unforgettable.

Manufacturing Audit And Review Team Inspection Dashboard Microsoft PDF
This slide illustrates data related to inspections done by audit teams in manufacturing corporation. It includes graph for last 10 audits, audit report for september 2023 etc.Pitch your topic with ease and precision using this Manufacturing Audit And Review Team Inspection Dashboard Microsoft PDF. This layout presents information on Audit Report, Preparedness, Site Inspection. It is also available for immediate download and adjustment. So, changes can be made in the color, design, graphics or any other component to create a unique layout.

Alternative Distribution Advertising Platform Race Digital Marketing Dashboard Slides PDF
This infographic is used to improve the digital marketing in the company by using the RACE framework model. Deliver an awe inspiring pitch with this creative alternative distribution advertising platform race digital marketing dashboard slides pdf bundle. Topics like reach, act, convert, engage can be discussed with this completely editable template. It is available for immediate download depending on the needs and requirements of the user.

Dashboard To Evaluate Manufacturing Quality In Organization Elements PDF
This slide showcases the KPIs that would help a business organization to evaluate improvements in the new production planning and control system. It includes total production, defective production, production rate, average cycle duration, etc. Here you can discover an assortment of the finest PowerPoint and Google Slides templates. With these templates, you can create presentations for a variety of purposes while simultaneously providing your audience with an eye catching visual experience. Download Dashboard To Evaluate Manufacturing Quality In Organization Elements PDF to deliver an impeccable presentation. These templates will make your job of preparing presentations much quicker, yet still, maintain a high level of quality. Slidegeeks has experienced researchers who prepare these templates and write high quality content for you. Later on, you can personalize the content by editing the Dashboard To Evaluate Manufacturing Quality In Organization Elements PDF.
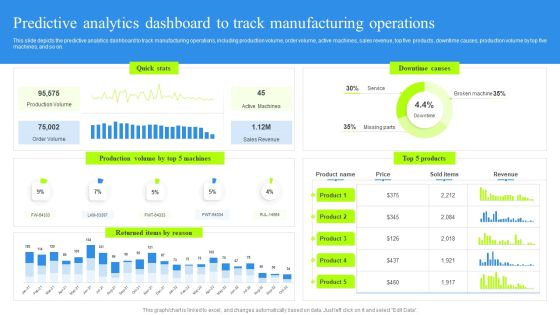
Predictive Analytics Dashboard To Track Manufacturing Operations Rules PDF
This slide depicts the predictive analytics dashboard to track manufacturing operations, including production volume, order volume, active machines, sales revenue, top five products, downtime causes, production volume by top five machines, and so on. Present like a pro with Predictive Analytics Dashboard To Track Manufacturing Operations Rules PDF Create beautiful presentations together with your team, using our easy-to-use presentation slides. Share your ideas in real-time and make changes on the fly by downloading our templates. So whether you are in the office, on the go, or in a remote location, you can stay in sync with your team and present your ideas with confidence. With Slidegeeks presentation got a whole lot easier. Grab these presentations today.

Market Research Summary Dashboard Of Fmcg Industry Pictures PDF
The following slide highlights the market research report of FMCG which includes the sales by location, units per transaction and products sold. Showcasing this set of slides titled Market Research Summary Dashboard Of Fmcg Industry Pictures PDF. The topics addressed in these templates are Revenues, Net Profit, Sales. All the content presented in this PPT design is completely editable. Download it and make adjustments in color, background, font etc. as per your unique business setting.
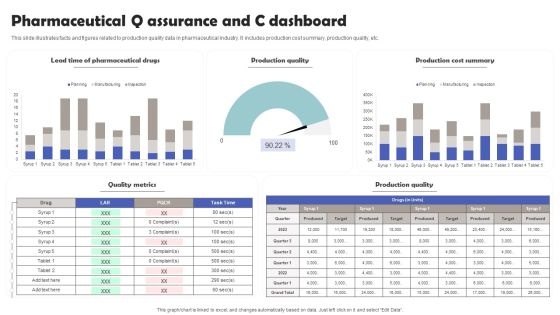
Pharmaceutical Q Assurance And C Dashboard Template PDF
This slide illustrates facts and figures related to production quality data in pharmaceutical industry. It includes production cost summary, production quality, etc. Showcasing this set of slides titled Pharmaceutical Q Assurance And C Dashboard Template PDF. The topics addressed in these templates are Pharmaceutical Drugs, Production Quality, Production Cost Summary. All the content presented in this PPT design is completely editable. Download it and make adjustments in color, background, font etc. as per your unique business setting.

Risk Assessment Dashboard For Securing Supply Chain System Graphics PDF
This slide demonstrates risk assessment matrix for improving the efficiency of industrial supply chain system. It includes supplier risks, service type and service health etc.Showcasing this set of slides titled Risk Assessment Dashboard For Securing Supply Chain System Graphics PDF The topics addressed in these templates are Operation Compliance, Privacy Compilation, External Score All the content presented in this PPT design is completely editable. Download it and make adjustments in color, background, font etc. as per your unique business setting.

Dashboard For Monitoring Social Media Platforms Marketing Document Slides PDF
This slide provides marketing report for various social media platforms aimed at displaying data insights in one place using relevant key performance indicators. It covers four platforms with key insights on marketing performance measured by metrics. Showcasing this set of slides titled Dashboard For Monitoring Social Media Platforms Marketing Document Slides PDF. The topics addressed in these templates are Impressions, Engagement, Target. All the content presented in this PPT design is completely editable. Download it and make adjustments in color, background, font etc. as per your unique business setting.
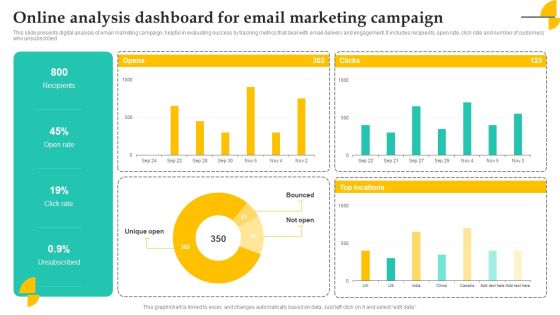
Online Analysis Dashboard For Email Marketing Campaign Elements PDF
This slide presents digital analysis of email marketing campaign, helpful in evaluating success by tracking metrics that deal with email delivery and engagement. It includes recipients, open rate, click rate and number of customers who unsubscribed Showcasing this set of slides titled Online Analysis Dashboard For Email Marketing Campaign Elements PDF. The topics addressed in these templates are Recipients, Open Rate, Campaign. All the content presented in this PPT design is completely editable. Download it and make adjustments in color, background, font etc. as per your unique business setting.
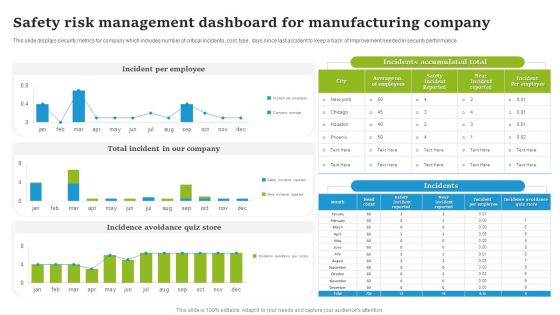
Safety Risk Management Dashboard For Manufacturing Company Introduction PDF
This slide displays security metrics for company which includes number of critical incidents, cost, type, days since last accident to keep a track of Improvement needed in security performance. Showcasing this set of slides titled Safety Risk Management Dashboard For Manufacturing Company Introduction PDF. The topics addressed in these templates are Incident Per Employee, Total Incident Our Company, Incidence Avoidance Quiz Store. All the content presented in this PPT design is completely editable. Download it and make adjustments in color, background, font etc. as per your unique business setting.
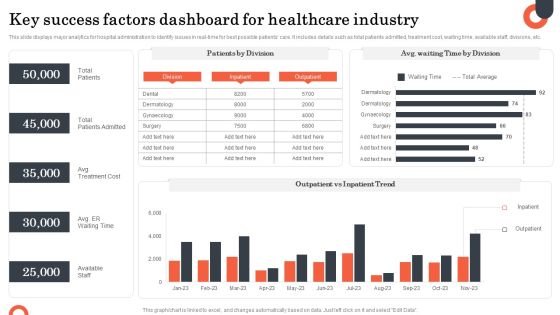
Key Success Factors Dashboard For Healthcare Industry Diagrams PDF
This slide displays major analytics for hospital administration to identify issues in real-time for best possible patients care. It includes details such as total patients admitted, treatment cost, waiting time, available staff, divisions, etc. Showcasing this set of slides titled Key Success Factors Dashboard For Healthcare Industry Diagrams PDF. The topics addressed in these templates are Success Factors, Total Patients, Total Patients Admitted, Available Staff. All the content presented in this PPT design is completely editable. Download it and make adjustments in color, background, font etc. as per your unique business setting.

Constructive Destructive Feedback Dashboard For Healthcare Industry Guidelines PDF
This slide displays customer satisfaction survey to analyze efficiency of services and areas of improvement for a hospital. It includes details about dental, radiology, laboratory and diagnostic and nutritional support. Showcasing this set of slides titled Constructive Destructive Feedback Dashboard For Healthcare Industry Guidelines PDF. The topics addressed in these templates are Nutritional Support, Dental Services, Overall Satisfaction . All the content presented in this PPT design is completely editable. Download it and make adjustments in color, background, font etc. as per your unique business setting.

Conversational Marketing Dashboard For B2B And B2C Organization Mockup PDF
Purpose of the following slide is to show key metrics that can help the organization to track conversational marketing efforts, it highlights essential KPIs such as subscribers, e-mail sent, sessions through link sent on e-mail. If your project calls for a presentation, then Slidegeeks is your go-to partner because we have professionally designed, easy-to-edit templates that are perfect for any presentation. After downloading, you can easily edit Conversational Marketing Dashboard For B2B And B2C Organization Mockup PDF and make the changes accordingly. You can rearrange slides or fill them with different images. Check out all the handy templates.
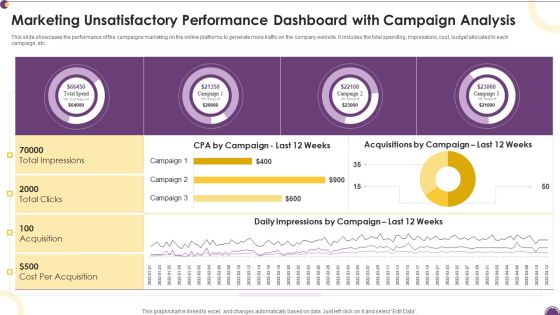
Marketing Unsatisfactory Performance Dashboard With Campaign Analysis Information PDF
This slide showcases the performance of the campaigns marketing on the online platforms to generate more traffic on the company website. It includes the total spending, impressions, cost, budget allocated to each campaign, etc.Pitch your topic with ease and precision using this Marketing Unsatisfactory Performance Dashboard With Campaign Analysis Information PDF. This layout presents information on Cost Acquisition, Total Clicks, Total Impressions. It is also available for immediate download and adjustment. So, changes can be made in the color, design, graphics or any other component to create a unique layout.
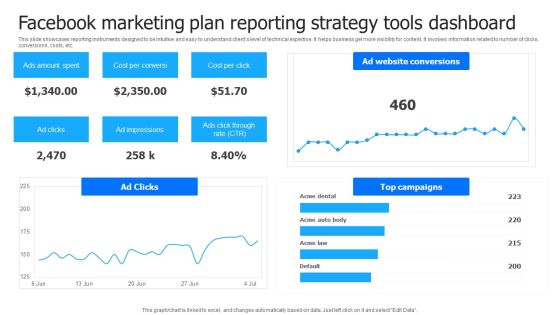
Facebook Marketing Plan Reporting Strategy Tools Dashboard Information PDF
This slide showcases reporting instruments designed to be intuitive and easy to understand clients level of technical expertise. It helps business get more visibility for content. It involves information related to number of clicks, conversions, costs, etc. Showcasing this set of slides titled Facebook Marketing Plan Reporting Strategy Tools Dashboard Information PDF Elements. The topics addressed in these templates are Ads Amount Spent, Cost Per Conversion, Cost Per Click. All the content presented in this PPT design is completely editable. Download it and make adjustments in color, background, font etc. as per your unique business setting.

Dashboard For Cloud Data Firm Revival Action Plan Summary PDF
Following slide highlights the strategies to optimize recovery performance is to provide a revival techniques to improve performance and overcome the problem of industrial sickness. The major strategies covered herein are cost control strategy, retrenchment strategy and leader replacement strategy. Pitch your topic with ease and precision using this Dashboard For Cloud Data Firm Revival Action Plan Summary PDF. This layout presents information on Device, Success, Process. It is also available for immediate download and adjustment. So, changes can be made in the color, design, graphics or any other component to create a unique layout.
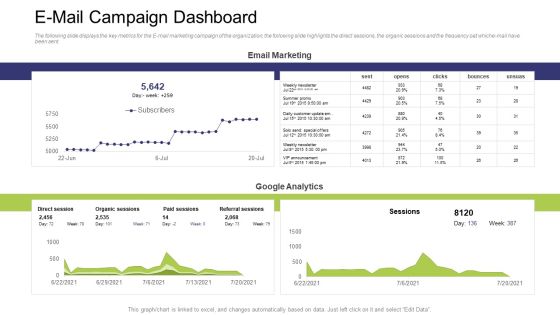
E Mail Campaign Dashboard Ppt Infographic Template Clipart Images PDF
The following slide displays the key metrics for the E-mail marketing campaign of the organization, the following slide highlights the direct sessions, the organic sessions and the frequency oat whiche-mail have been sent Deliver and pitch your topic in the best possible manner with this e mail campaign dashboard ppt infographic template clipart images pdf. Use them to share invaluable insights on direct session, paid sessions, organic sessions, referral sessions and impress your audience. This template can be altered and modified as per your expectations. So, grab it now.

Dashboard For Skill Assessment During Leadership Recruitment Infographics PDF
The slide shows industry wise top skills that are assessed during leadership hiring. It includes skill assessment in hiring by different industries, average time taken in hiring, skill assessment tools in leadership hiring. Showcasing this set of slides titled Dashboard For Skill Assessment During Leadership Recruitment Infographics PDF. The topics addressed in these templates are Skill Assessment Tools, Skill Analysis. All the content presented in this PPT design is completely editable. Download it and make adjustments in color, background, font etc. as per your unique business setting.
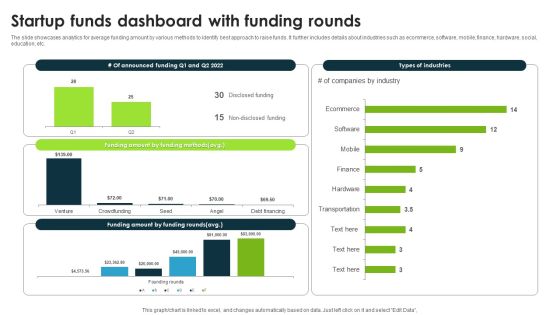
Startup Funds Dashboard With Funding Rounds Summary PDF
The slide showcases analytics for average funding amount by various methods to identify best approach to raise funds. It further includes details about industries such as ecommerce, software, mobile, finance, hardware, social, education, etc. Pitch your topic with ease and precision using this Startup Funds Dashboard With Funding Rounds Summary PDF. This layout presents information on Funding Methods, Industry, Ecommerce. It is also available for immediate download and adjustment. So, changes can be made in the color, design, graphics or any other component to create a unique layout.

Competition Analysis Matrix Dashboard Comparison Ppt PowerPoint Presentation Complete Deck
This competition analysis matrix dashboard comparison ppt powerpoint presentation complete deck acts as backup support for your ideas, vision, thoughts, etc. Use it to present a thorough understanding of the topic. This PPT slideshow can be utilized for both in-house and outside presentations depending upon your needs and business demands. Entailing twelve slides with a consistent design and theme, this template will make a solid use case. As it is intuitively designed, it suits every business vertical and industry. All you have to do is make a few tweaks in the content or any other component to design unique presentations. The biggest advantage of this complete deck is that it can be personalized multiple times once downloaded. The color, design, shapes, and other elements are free to modify to add personal touches. You can also insert your logo design in this PPT layout. Therefore a well-thought and crafted presentation can be delivered with ease and precision by downloading this competition analysis matrix dashboard comparison ppt powerpoint presentation complete deck PPT slideshow.

Organizational Manpower Kpi Dashboard Employees Ppt PowerPoint Presentation Complete Deck
This organizational manpower kpi dashboard employees ppt powerpoint presentation complete deck acts as backup support for your ideas, vision, thoughts, etc. Use it to present a thorough understanding of the topic. This PPT slideshow can be utilized for both in-house and outside presentations depending upon your needs and business demands. Entailing twelve slides with a consistent design and theme, this template will make a solid use case. As it is intuitively designed, it suits every business vertical and industry. All you have to do is make a few tweaks in the content or any other component to design unique presentations. The biggest advantage of this complete deck is that it can be personalized multiple times once downloaded. The color, design, shapes, and other elements are free to modify to add personal touches. You can also insert your logo design in this PPT layout. Therefore a well-thought and crafted presentation can be delivered with ease and precision by downloading this organizational manpower kpi dashboard employees ppt powerpoint presentation complete deck PPT slideshow.

JIRA KPI Dashboard Ppt PowerPoint Presentation Complete Deck With Slides
This jira kpi dashboard ppt powerpoint presentation complete deck with slides acts as backup support for your ideas, vision, thoughts, etc. Use it to present a thorough understanding of the topic. This PPT slideshow can be utilized for both in-house and outside presentations depending upon your needs and business demands. Entailing sixteen slides with a consistent design and theme, this template will make a solid use case. As it is intuitively designed, it suits every business vertical and industry. All you have to do is make a few tweaks in the content or any other component to design unique presentations. The biggest advantage of this complete deck is that it can be personalized multiple times once downloaded. The color, design, shapes, and other elements are free to modify to add personal touches. You can also insert your logo design in this PPT layout. Therefore a well-thought and crafted presentation can be delivered with ease and precision by downloading this jira kpi dashboard ppt powerpoint presentation complete deck with slides PPT slideshow.

Risk Evaluation Dashboard Ppt PowerPoint Presentation Complete Deck With Slides
This Risk Evaluation Dashboard Ppt PowerPoint Presentation Complete Deck With Slides acts as backup support for your ideas, vision, thoughts, etc. Use it to present a thorough understanding of the topic. This PPT slideshow can be utilized for both in-house and outside presentations depending upon your needs and business demands. Entailing twelve slides with a consistent design and theme, this template will make a solid use case. As it is intuitively designed, it suits every business vertical and industry. All you have to do is make a few tweaks in the content or any other component to design unique presentations. The biggest advantage of this complete deck is that it can be personalized multiple times once downloaded. The color, design, shapes, and other elements are free to modify to add personal touches. You can also insert your logo design in this PPT layout. Therefore a well-thought and crafted presentation can be delivered with ease and precision by downloading this Risk Evaluation Dashboard Ppt PowerPoint Presentation Complete Deck With Slides PPT slideshow.

IT Performance Dashboard Ppt PowerPoint Presentation Complete Deck With Slides
This IT Performance Dashboard Ppt PowerPoint Presentation Complete Deck With Slides acts as backup support for your ideas, vision, thoughts, etc. Use it to present a thorough understanding of the topic. This PPT slideshow can be utilized for both in-house and outside presentations depending upon your needs and business demands. Entailing twelve slides with a consistent design and theme, this template will make a solid use case. As it is intuitively designed, it suits every business vertical and industry. All you have to do is make a few tweaks in the content or any other component to design unique presentations. The biggest advantage of this complete deck is that it can be personalized multiple times once downloaded. The color, design, shapes, and other elements are free to modify to add personal touches. You can also insert your logo design in this PPT layout. Therefore a well-thought and crafted presentation can be delivered with ease and precision by downloading this IT Performance Dashboard Ppt PowerPoint Presentation Complete Deck With Slides PPT slideshow.

SLA KPI Dashboard Ppt PowerPoint Presentation Complete Deck With Slides
This SLA KPI Dashboard Ppt PowerPoint Presentation Complete Deck With Slides acts as backup support for your ideas, vision, thoughts, etc. Use it to present a thorough understanding of the topic. This PPT slideshow can be utilized for both in-house and outside presentations depending upon your needs and business demands. Entailing twelve slides with a consistent design and theme, this template will make a solid use case. As it is intuitively designed, it suits every business vertical and industry. All you have to do is make a few tweaks in the content or any other component to design unique presentations. The biggest advantage of this complete deck is that it can be personalized multiple times once downloaded. The color, design, shapes, and other elements are free to modify to add personal touches. You can also insert your logo design in this PPT layout. Therefore a well-thought and crafted presentation can be delivered with ease and precision by downloading this SLA KPI Dashboard Ppt PowerPoint Presentation Complete Deck With Slides PPT slideshow.
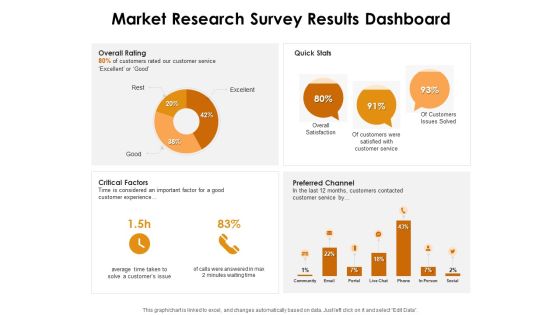
KPI Dashboards Per Industry Market Research Survey Results Dashboard Ppt PowerPoint Presentation Infographic Template Layout Ideas PDF
Deliver and pitch your topic in the best possible manner with this kpi dashboards per industry market research survey results dashboard ppt powerpoint presentation infographic template layout ideas pdf. Use them to share invaluable insights on overall rating, quick stats, critical factors, preferred channel and impress your audience. This template can be altered and modified as per your expectations. So, grab it now.

KPI Dashboards Per Industry Retail Sales And Order Overview Dashboard Ppt PowerPoint Presentation Infographic Template Master Slide PDF
Deliver and pitch your topic in the best possible manner with this kpi dashboards per industry retail sales and order overview dashboard ppt powerpoint presentation infographic template master slide pdf. Use them to share invaluable insights on return reasons, top seller orders, perfect order rate, total orders, seller location and impress your audience. This template can be altered and modified as per your expectations. So, grab it now.

Digitally Streamline Automation Sales Operations Choosing Best CRM System To Improve Sales Background PDF
This slide shows the comparison of customer relationship management on the basis of features such as phone support, live chat, custom dashboards, automated responses, round the clock support, etc. Deliver an awe inspiring pitch with this creative Digitally Streamline Automation Sales Operations Choosing Best CRM System To Improve Sales Background PDF bundle. Topics like Custom Dashboards, Automated Responses, Cost can be discussed with this completely editable template. It is available for immediate download depending on the needs and requirements of the user.

Sales Procedure Automation To Enhance Sales Choosing Best CRM System To Improve Sales Diagrams PDF
This slide shows the comparison of customer relationship management on the basis of features such as phone support, live chat, custom dashboards, automated responses, round the clock support, etc.Deliver an awe inspiring pitch with this creative Sales Procedure Automation To Enhance Sales Choosing Best CRM System To Improve Sales Diagrams PDF bundle. Topics like Custom Dashboards, Automated Responses, Phone Support can be discussed with this completely editable template. It is available for immediate download depending on the needs and requirements of the user.
Strategies To Maintain Transportation Shipping And Logistics Tracking Dashboard With Shipments Ppt Infographics Information PDF
This slide covers Key performance indicators to track the automation system of the company. This dashboard includes Logistics Efficiency Status, delivery time accuracy etc. Presenting this PowerPoint presentation, titled Strategies To Maintain Transportation Shipping And Logistics Tracking Dashboard With Shipments Ppt Infographics Information PDF, with topics curated by our researchers after extensive research. This editable presentation is available for immediate download and provides attractive features when used. Download now and captivate your audience. Presenting this Strategies To Maintain Transportation Shipping And Logistics Tracking Dashboard With Shipments Ppt Infographics Information PDF. Our researchers have carefully researched and created these slides with all aspects taken into consideration. This is a completely customizable Strategies To Maintain Transportation Shipping And Logistics Tracking Dashboard With Shipments Ppt Infographics Information PDF that is available for immediate downloading. Download now and make an impact on your audience. Highlight the attractive features available with our PPTs.
Shipping And Logistics Tracking Dashboard With Shipments And Fleet Status Ideas PDF
This slide covers Key performance indicators to track the automation system of the company. This dashboard includes Logistics Efficiency Status, delivery time accuracy etc. Get a simple yet stunning designed Shipping And Logistics Tracking Dashboard With Shipments And Fleet Status Ideas PDF. It is the best one to establish the tone in your meetings. It is an excellent way to make your presentations highly effective. So, download this PPT today from Slidegeeks and see the positive impacts. Our easy to edit Shipping And Logistics Tracking Dashboard With Shipments And Fleet Status Ideas PDF can be your go to option for all upcoming conferences and meetings. So, what are you waiting for Grab this template today.
Integrating AI To Enhance Dashboard For Tracking Impact Of Procurement Process Slides PDF
This slide covers the dashboard for analysing procurement performance after automation. It include KPIs such as on-time delivery, percentage of returns, compliance index percentage, procurement ROI, cost-saving, budget spent on training, etc. Slidegeeks is here to make your presentations a breeze with Integrating AI To Enhance Dashboard For Tracking Impact Of Procurement Process Slides PDF With our easy-to-use and customizable templates, you can focus on delivering your ideas rather than worrying about formatting. With a variety of designs to choose from, youre sure to find one that suits your needs. And with animations and unique photos, illustrations, and fonts, you can make your presentation pop. So whether youre giving a sales pitch or presenting to the board, make sure to check out Slidegeeks first.

Comparative Assessment Of Automation Tools For Procedure Enhancement Brochure PDF
The purpose of this slide is to compare various automation tools which can be used for operational process improvement. The key features of tools are AI assisted remediation, visual validation, customized dashboards, automated crash detection etc. Pitch your topic with ease and precision using this comparative assessment of automation tools for procedure enhancement brochure pdf. This layout presents information on comparative assessment of automation tools for procedure enhancement. It is also available for immediate download and adjustment. So, changes can be made in the color, design, graphics or any other component to create a unique layout.

Sales Automation Procedure Choosing Best Crm System To Improve Sales Inspiration PDF
This slide shows the comparison of customer relationship management on the basis of features such as phone support, live chat, custom dashboards, automated responses, round the clock support, etc. Deliver and pitch your topic in the best possible manner with this Sales Automation Procedure Choosing Best Crm System To Improve Sales Inspiration PDF. Use them to share invaluable insights on Phone Support, Custom Dashboards, Automated Responses and impress your audience. This template can be altered and modified as per your expectations. So, grab it now.

Healthcare Marketing Automation Ppt Slides
This is a healthcare marketing automation ppt slides. This is a seven stage process. The stages in this process are campaigns, opportunity, repeat business, lead generation, leads, new business, data mining.

KPI Dashboard For ESO System Ppt PowerPoint Presentation File Template PDF
This slide covers kpi dashboard for enterprise security operations. It involves details such as active alerts, active automated investigation, devices with major issues and report of daily devices. Pitch your topic with ease and precision using this KPI Dashboard For ESO System Ppt PowerPoint Presentation File Template PDF. This layout presents information on Security Health, Misconfigured, Service Operating Normally. It is also available for immediate download and adjustment. So, changes can be made in the color, design, graphics or any other component to create a unique layout.

Cloud Based Marketing Automation Powerpoint Slides Templates
This is a cloud based marketing automation powerpoint slides templates. This is a seven stage process. The stages in this process are reporting and analytics, sales enablement, data management, multi channel campaign management, targeting and segmentation, social marketing, content marketing.

COVID 19 Business Survive Adapt Post Recovery Strategy Online Industry Dashboard Information PDF
Presenting covid 19 business survive adapt post recovery strategy online industry dashboard information pdf to provide visual cues and insights. Share and navigate important information on three stages that need your due attention. This template can be used to pitch topics like low, medium, high. In addition, this PPT design contains high-resolution images, graphics, etc, that are easily editable and available for immediate download.
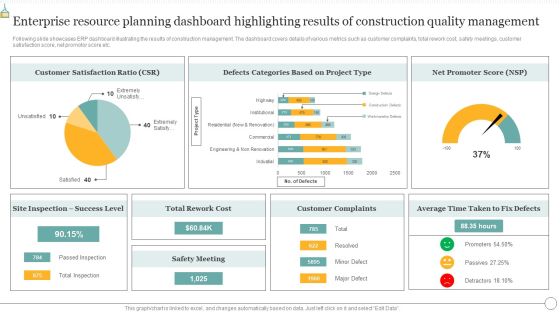
Enterprise Resource Planning Dashboard Highlighting Results Of Construction Quality Management Summary PDF
Following slide exhibits various functionalities that constructing company look for in ERP software. The multiple functionalities covered in the slide are project tracking, job costing, project estimating, improved accuracy, process automation etc. Pitch your topic with ease and precision using this Enterprise Resource Planning Dashboard Highlighting Results Of Construction Quality Management Summary PDF. This layout presents information on Technology Efficiency, Process Automation, Improved Accuracy. It is also available for immediate download and adjustment. So, changes can be made in the color, design, graphics or any other component to create a unique layout.

Shipping And Logistics Management Dashboard With Perfect Order Rate And Warehouse Background PDF
This slide covers KPIs to track the automation system of the company including warehouse operating costs, perfect order cost, on time shipment etc. Deliver and pitch your topic in the best possible manner with this Shipping And Logistics Management Dashboard With Perfect Order Rate And Warehouse Background PDF. Use them to share invaluable insights on Warehouse Operating Costs, Perfect Order Rate and impress your audience. This template can be altered and modified as per your expectations. So, grab it now.

Marketing Automation Powerpoint Slide Design Templates
This is a marketing automation powerpoint slide design templates. This is a four stage process. The stages in this process are content management, marketing automation, data management, search marketing.

Shipping And Logistics Management Dashboard With Perfect Order Rate And Warehouse Operating Costs Topics PDF
This slide covers KPIs to track the automation system of the company including warehouse operating costs, perfect order cost, on-time shipment etc. Do you have to make sure that everyone on your team knows about any specific topic I yes, then you should give Shipping And Logistics Management Dashboard With Perfect Order Rate And Warehouse Operating Costs Topics PDF a try. Our experts have put a lot of knowledge and effort into creating this impeccable Shipping And Logistics Management Dashboard With Perfect Order Rate And Warehouse Operating Costs Topics PDF. You can use this template for your upcoming presentations, as the slides are perfect to represent even the tiniest detail. You can download these templates from the Slidegeeks website and these are easy to edit. So grab these today.
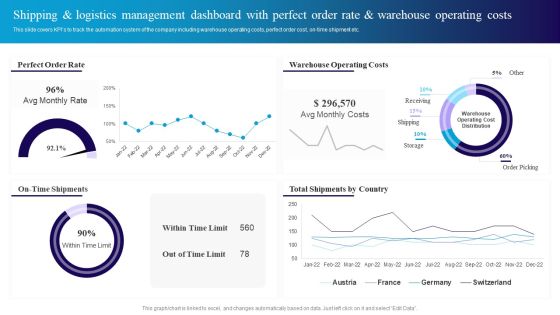
Shipping And Logistics Management Dashboard With Perfect Order Rate And Warehouse Sample PDF
This slide covers KPIs to track the automation system of the company including warehouse operating costs, perfect order cost, ontime shipment etc. This Shipping And Logistics Management Dashboard With Perfect Order Rate And Warehouse Sample PDF from Slidegeeks makes it easy to present information on your topic with precision. It provides customization options, so you can make changes to the colors, design, graphics, or any other component to create a unique layout. It is also available for immediate download, so you can begin using it right away. Slidegeeks has done good research to ensure that you have everything you need to make your presentation stand out. Make a name out there for a brilliant performance.
 Home
Home