Asset Management Process

Example Of Risk Assessment For Business Diagram Presentation Ideas
This is a example of risk assessment for business diagram presentation ideas. This is a three stage process. The stages in this process are threat, vulnerability, asset, risk.
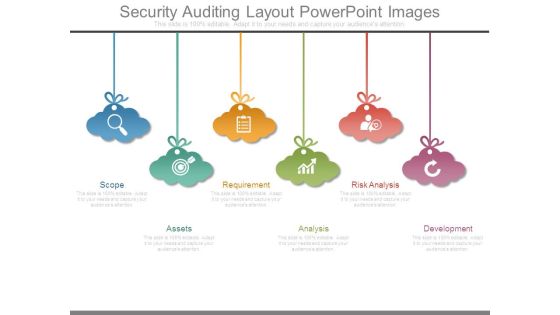
Security Auditing Layout Powerpoint Images
This is a security auditing layout powerpoint images. This is a six stage process. The stages in this process are scope, assets, requirement, analysis, risk analysis, development.

Balance Sheet Business Diagram Template Presentation Layouts
This is a balance sheet business diagram template presentation layouts. This is a three stage process. The stages in this process are assets, liability, equity.
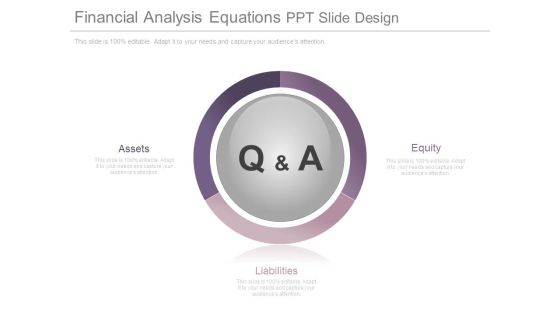
Financial Analysis Equations Ppt Slide Design
This is a financial analysis equations ppt slide design. This is a three stage process. The stages in this process are assets, liabilities, equity.
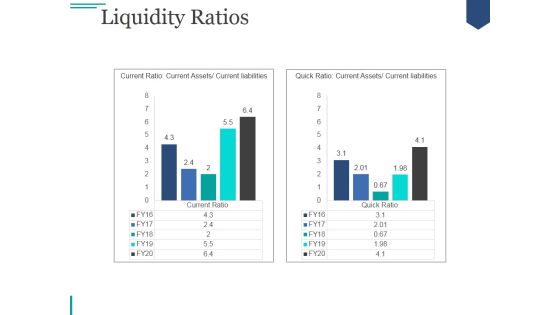
Liquidity Ratios Ppt PowerPoint Presentation Introduction
This is a liquidity ratios ppt powerpoint presentation introduction. This is a two stage process. The stages in this process are current ratio, current assets, current liabilities.

Brand Strategy Ppt PowerPoint Presentation Gallery Maker
This is a brand strategy ppt powerpoint presentation gallery maker. This is a five stage process. The stages in this process are research, strategy, design, touch points, assets.

Statistics Results Ppt PowerPoint Presentation Summary Example
This is a statistics results ppt powerpoint presentation summary example. This is a two stage process. The stages in this process are finance, media, data, assets, funding.
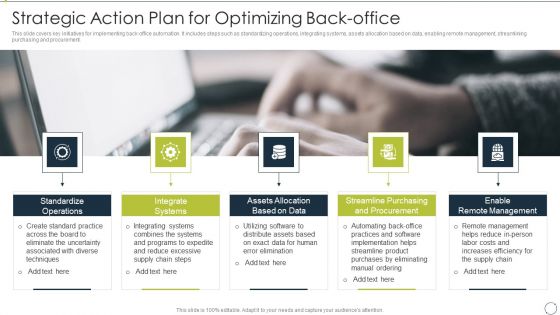
Automating Supply Chain Strategic Action Plan For Optimizing Back Office Ideas PDF
Presenting Automating Supply Chain Strategic Action Plan For Optimizing Back Office Ideas PDF to provide visual cues and insights. Share and navigate important information on five stages that need your due attention. This template can be used to pitch topics like Standardize Operations, Integrate Systems, Assets Allocation. In addtion, this PPT design contains high resolution images, graphics, etc, that are easily editable and available for immediate download.

Automated Government Procedures Our Financial Highlights For Fy 2019 Formats PDF
This slide covers financial highlights of the company such as profit after tax, EBITDA, net assets value and dividends for FYs 2019-2021. Deliver an awe-inspiring pitch with this creative automated government procedures our financial highlights for fy 2019 formats pdf bundle. Topics like profit, value, financial highlights can be discussed with this completely editable template. It is available for immediate download depending on the needs and requirements of the user.

Estimating Business Overall Activity Ratios To Determine Organization Efficiency In Utilizing Topics PDF
The following slide outlines efficiency ratios which can be used to indicate the company efficiency in utilizing the assets. Information covered in this slide is related to inventory and total assets turnover ratio. Are you in need of a template that can accommodate all of your creative concepts This one is crafted professionally and can be altered to fit any style. Use it with Google Slides or PowerPoint. Include striking photographs, symbols, depictions, and other visuals. Fill, move around, or remove text boxes as desired. Test out color palettes and font mixtures. Edit and save your work, or work with colleagues. Download Estimating Business Overall Activity Ratios To Determine Organization Efficiency In Utilizing Topics PDF and observe how to make your presentation outstanding. Give an impeccable presentation to your group and make your presentation unforgettable.

Overview Of Organizational Activity Ratios To Determine Organization Efficiency Download PDF
The following slide outlines efficiency ratios which can be used to indicate the company efficiency in utilizing the assets. Information covered in this slide is related to inventory and total assets turnover ratio. Slidegeeks is one of the best resources for PowerPoint templates. You can download easily and regulate Overview Of Organizational Activity Ratios To Determine Organization Efficiency Download PDF for your personal presentations from our wonderful collection. A few clicks is all it takes to discover and get the most relevant and appropriate templates. Use our Templates to add a unique zing and appeal to your presentation and meetings. All the slides are easy to edit and you can use them even for advertisement purposes.

Monetary Planning And Evaluation Guide Activity Ratios To Determine Organization Efficiency In Utilizing Ppt Inspiration Design Inspiration PDF
The following slide outlines efficiency ratios which can be used to indicate the company efficiency in utilizing the assets. Information covered in this slide is related to inventory and total assets turnover ratio. Slidegeeks is one of the best resources for PowerPoint templates. You can download easily and regulate Monetary Planning And Evaluation Guide Activity Ratios To Determine Organization Efficiency In Utilizing Ppt Inspiration Design Inspiration PDF for your personal presentations from our wonderful collection. A few clicks is all it takes to discover and get the most relevant and appropriate templates. Use our Templates to add a unique zing and appeal to your presentation and meetings. All the slides are easy to edit and you can use them even for advertisement purposes.

B2B Demand Generation Best Practices Determine B2B Marketing Activities Dashboard Summary PDF
This slide provides information regarding B2B marketing activities dashboard catering KPIs related to campaign ROI, email, engagement, etc. Deliver and pitch your topic in the best possible manner with this b2b demand generation best practices determine b2b marketing activities dashboard summary pdf. Use them to share invaluable insights on marketing highlights, highest performing campaign, best performing assets campaign and impress your audience. This template can be altered and modified as per your expectations. So, grab it now.

Complete IT Security IT Implementation Checklist Ppt Diagrams PDF
This slide depicts the cyber security checklist and measures an organization should take to protect data and company assets from cyber attacks or natural disasters. Deliver an awe inspiring pitch with this creative complete it security it implementation checklist ppt diagrams pdf bundle. Topics like training, antivirus software, secure communications, access control measures, device security can be discussed with this completely editable template. It is available for immediate download depending on the needs and requirements of the user.

Company Financial Performance Indicators Dashboard With Working Capital And Cash Conversion Icons PDF
This slide shows dashboard of finance KPIs . It covers working capital, cash conversion cycle, vendor payment error rate ,current assets and liabilities. Showcasing this set of slides titled Company Financial Performance Indicators Dashboard With Working Capital And Cash Conversion Icons PDF. The topics addressed in these templates are Current Working Capital, Current Liabilities, Working Capital. All the content presented in this PPT design is completely editable. Download it and make adjustments in color, background, font etc. as per your unique business setting.
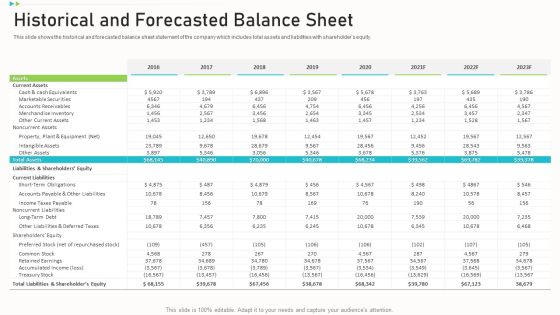
Pitch Deck Ppt Raise Funding Corporate Investors Historical And Forecasted Balance Sheet Elements PDF
This slide shows the historical and forecasted balance sheet statement of the company which includes total assets and liabilities with shareholders equity. Deliver an awe inspiring pitch with this creative pitch deck ppt raise funding corporate investors historical and forecasted balance sheet elements pdf bundle. Topics like marketable securities, accounts receivables, shareholders equity can be discussed with this completely editable template. It is available for immediate download depending on the needs and requirements of the user.

Construction Project Cost Benefit Analysis Report 5 Years Projected Balance Sheet Structure PDF
Following slide displays balance sheet projections for the next five years. It includes information of total current assets and non current assets, total current liabilities and non-current liabilities and total members equity. If you are looking for a format to display your unique thoughts, then the professionally designed Construction Project Cost Benefit Analysis Report 5 Years Projected Balance Sheet Structure PDF is the one for you. You can use it as a Google Slides template or a PowerPoint template. Incorporate impressive visuals, symbols, images, and other charts. Modify or reorganize the text boxes as you desire. Experiment with shade schemes and font pairings. Alter, share or cooperate with other people on your work. Download Construction Project Cost Benefit Analysis Report 5 Years Projected Balance Sheet Structure PDF and find out how to give a successful presentation. Present a perfect display to your team and make your presentation unforgettable.
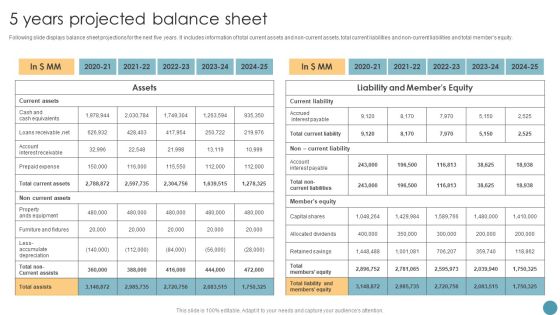
Feasibility Analysis Report For Construction Project 5 Years Projected Balance Sheet Ideas PDF
Following slide displays balance sheet projections for the next five years. It includes information of total current assets and non-current assets, total current liabilities and non-current liabilities and total members equity. If you are looking for a format to display your unique thoughts, then the professionally designed Feasibility Analysis Report For Construction Project 5 Years Projected Balance Sheet Ideas PDF is the one for you. You can use it as a Google Slides template or a PowerPoint template. Incorporate impressive visuals, symbols, images, and other charts. Modify or reorganize the text boxes as you desire. Experiment with shade schemes and font pairings. Alter, share or cooperate with other people on your work. Download Feasibility Analysis Report For Construction Project 5 Years Projected Balance Sheet Ideas PDF and find out how to give a successful presentation. Present a perfect display to your team and make your presentation unforgettable.

Credibility Assessment Summary For Construction Project 5 Years Projected Balance Sheet Clipart PDF
Following slide displays balance sheet projections for the next five years. It includes information of total current assets and non current assets, total current liabilities and non current liabilities and total members equity. Boost your pitch with our creative Credibility Assessment Summary For Construction Project 5 Years Projected Balance Sheet Clipart PDF. Deliver an awe inspiring pitch that will mesmerize everyone. Using these presentation templates you will surely catch everyones attention. You can browse the ppts collection on our website. We have researchers who are experts at creating the right content for the templates. So you don not have to invest time in any additional work. Just grab the template now and use them.

Business Operations Assessment Business Insurance Ppt Portfolio Graphics Design PDF
This is a business operations assessment business insurance ppt portfolio graphics design pdf template with various stages. Focus and dispense information on five stages using this creative set, that comes with editable features. It contains large content boxes to add your information on topics like protecting assets and revenues, safeguarding organizations interests, securing wheels business, securing projects and profits, putting employees first. You can also showcase facts, figures, and other relevant content using this PPT layout. Grab it now.
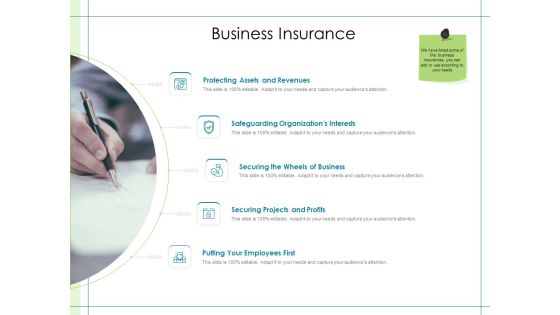
In Depth Business Assessment Business Insurance Ppt PowerPoint Presentation Gallery Brochure PDF
This is a in depth business assessment business insurance ppt powerpoint presentation gallery brochure pdf template with various stages. Focus and dispense information on five stages using this creative set, that comes with editable features. It contains large content boxes to add your information on topics like protecting assets and revenues, safeguarding organizations interests, securing wheels business, securing projects and profits, putting employees first. You can also showcase facts, figures, and other relevant content using this PPT layout. Grab it now.

Company Consolidated Balance Sheet With Detail One Pager Documents
This slide covers details regarding companys consolidated balance sheet which includes assets information, total liabilities, shareholders equity, etc. Presenting you an exemplary Company Consolidated Balance Sheet With Detail One Pager Documents. Our one-pager comprises all the must-have essentials of an inclusive document. You can edit it with ease, as its layout is completely editable. With such freedom, you can tweak its design and other elements to your requirements. Download this Company Consolidated Balance Sheet With Detail One Pager Documents brilliant piece now.

Enterprise Problem Solving And Intellect Business Intelligence KPI Dashboard Profile Ppt PowerPoint Presentation Summary Structure PDF
Presenting this set of slides with name enterprise problem solving and intellect business intelligence kpi dashboard profile ppt powerpoint presentation summary structure pdf. The topics discussed in these slides are expenses class, top 5 accounts receivables balance, assets profile, working capital, checking savings, monthly revenues and expenses. This is a completely editable PowerPoint presentation and is available for immediate download. Download now and impress your audience.

Requirements Documentation Powerpoint Presentation Templates
This is a requirements documentation powerpoint presentation templates. This is a four stage process. The stages in this process are requirements documentation, enterprise environmental factors, organizational process assets, cost benefit analysis.

Finance And Accounting Technology Applications In Organization Formats PDF
The following slide highlights financial accounting technology in business industry for processing and analysis of accounts data accurately and transfer of ownership of assets with no human errors etc. It includes use cases such as computing power, artificial intelligence, autonomous robots, blockchain etc. Showcasing this set of slides titled Finance And Accounting Technology Applications In Organization Formats PDF. The topics addressed in these templates are Computing Power, Artificial Intelligence, Autonomous Robots. All the content presented in this PPT design is completely editable. Download it and make adjustments in color, background, font etc. as per your unique business setting.
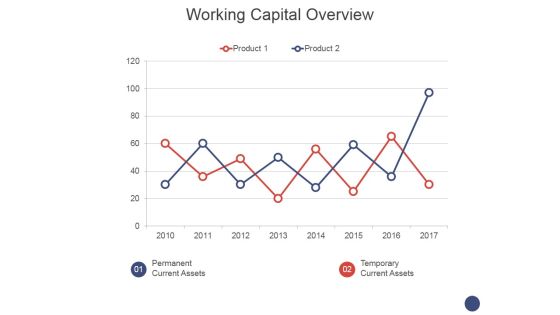
Working Capital Overview Ppt PowerPoint Presentation Layouts Diagrams
This is a working capital overview ppt powerpoint presentation layouts diagrams. This is a two stage process. The stages in this process are permanent current assets, temporary current assets.

Balance Sheet Ppt PowerPoint Presentation Infographics Icon
This is a balance sheet ppt powerpoint presentation infographics icon. This is a four stage process. The stages in this process are shareholders equity, inventories, trade receivables, current assets, total assets.

Balance Sheet Graphical Representation Ppt PowerPoint Presentation Outline Microsoft
This is a balance sheet graphical representation ppt powerpoint presentation outline microsoft. This is a four stage process. The stages in this process are current assets, current liabilities, total assets, total liabilities.

Financial Balance Sheet Dashboard Ppt PowerPoint Presentation Background Image
This is a financial balance sheet dashboard ppt powerpoint presentation background image. This is a two stage process. The stages in this process are current assets, cash, inventory, prepaid expenses, total assets.

Balance Sheet Kpis Ppt PowerPoint Presentation Professional
This is a balance sheet kpis ppt powerpoint presentation professional. This is a four stage process. The stages in this process are current assets, current liabilities, total assets, total liabilities.

Balance Sheet Kpis Template 3 Ppt PowerPoint Presentation Slides Brochure
This is a balance sheet kpis template 3 ppt powerpoint presentation slides brochure. This is a four stage process. The stages in this process are current assets, current liabilities, total liabilities, total assets.

Balance Sheet Kpis Tabular Form Ppt PowerPoint Presentation Professional Display
This is a balance sheet kpis tabular form ppt powerpoint presentation professional display. This is a four stage process. The stages in this process are current assets, current liabilities, total assets, total liabilities.

Balance Sheet Kpis Template 3 Ppt PowerPoint Presentation Professional Graphics Design
This is a balance sheet kpis template 3 ppt powerpoint presentation professional graphics design. This is a four stage process. The stages in this process are current assets, current liabilities, total assets, total liabilities.

Balance Sheet Kpis Template 1 Ppt PowerPoint Presentation Styles Layout Ideas
This is a balance sheet kpis template 1 ppt powerpoint presentation styles layout ideas. This is a four stage process. The stages in this process are current assets, current liabilities, total assets, total liabilities.

Balance Sheet Kpis Template 1 Ppt PowerPoint Presentation Layouts Design Ideas
This is a balance sheet kpis template 1 ppt powerpoint presentation layouts design ideas. This is a four stage process. The stages in this process are current assets, current liabilities, total assets, total liabilities.

Balance Sheet Kpis Tabular Form Ppt PowerPoint Presentation Infographics Good
This is a balance sheet kpis tabular form ppt powerpoint presentation infographics good. This is a four stage process. The stages in this process are current assets, current liabilities, total assets, total liabilities.
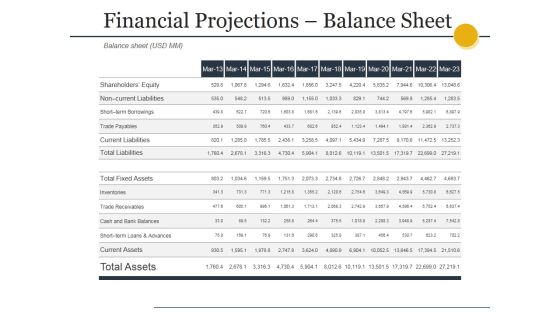
Financial Projections Balance Sheet Ppt PowerPoint Presentation Model Template
This is a financial projections balance sheet ppt powerpoint presentation model template. This is a eleven stage process. The stages in this process are current assets, cash and bank balances, trade receivables, inventories, total fixed assets.
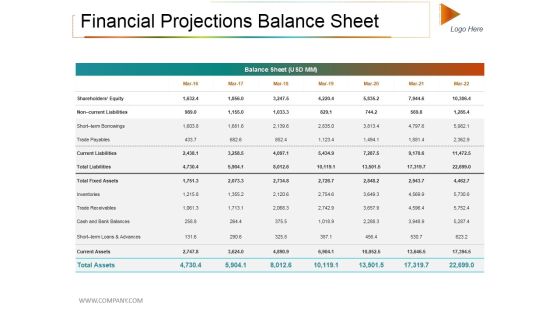
Financial Projections Balance Sheet Ppt PowerPoint Presentation Infographic Template Themes
This is a financial projections balance sheet ppt powerpoint presentation infographic template themes. This is a two stage process. The stages in this process are balance sheet, trade payable, total fixed assets, current assets.

Balance Sheet Kpis Tabular Form Ppt PowerPoint Presentation Show Example Introduction
This is a balance sheet kpis tabular form ppt powerpoint presentation show example introduction. This is a four stage process. The stages in this process are current assets, current liabilities, total assets, total liabilities.

Balance Sheet Kpls Template 2 Ppt PowerPoint Presentation Pictures Rules
This is a balance sheet kpls template 2 ppt powerpoint presentation pictures rules. This is a four stage process. The stages in this process are current investments, inventories, trade receivables, other current assets, current assets.

Balance Sheet Graphical Representation Ppt PowerPoint Presentation Inspiration Design Inspiration
This is a balance sheet graphical representation ppt powerpoint presentation inspiration design inspiration. This is a four stage process. The stages in this process are current assets, current liabilities, total assets, total liabilities.
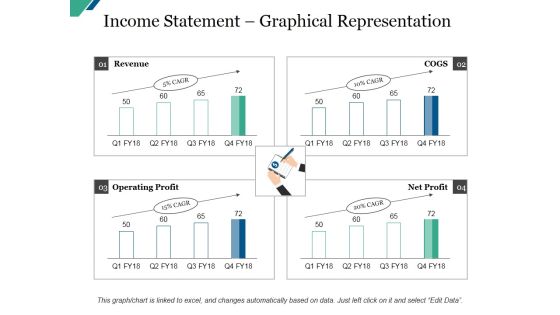
Income Statement Graphical Representation Ppt PowerPoint Presentation Summary Gallery
This is a income statement graphical representation ppt powerpoint presentation summary gallery. This is a four stage process. The stages in this process are current assets, current liabilities, total assets, total liabilities.

Balance Sheet Graphical Representation Ppt PowerPoint Presentation Inspiration Information
This is a balance sheet graphical representation ppt powerpoint presentation inspiration information. This is a four stage process. The stages in this process are current assets, current liabilities, total assets, total liabilities.
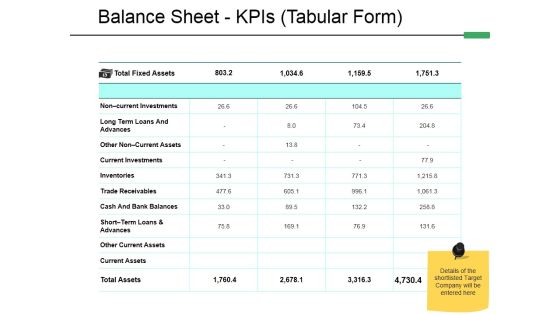
Balance Sheet Kpis Tabular Form Template 2 Ppt PowerPoint Presentation Styles Model
This is a balance sheet kpis tabular form template 2 ppt powerpoint presentation styles model. This is a four stage process. The stages in this process are advances, inventories, trade receivables, current investments, current assets, other current assets.

Balance Sheet Kpis Ppt PowerPoint Presentation Visual Aids Inspiration
This is a balance sheet kpis ppt powerpoint presentation visual aids inspiration. This is a four stage process. The stages in this process are current assets, current liabilities, total liabilities, total assets, business.

Balance Sheet Kpis Template 2 Ppt PowerPoint Presentation Ideas Show
This is a balance sheet kpis template 2 ppt powerpoint presentation ideas show. This is a four stage process. The stages in this process are current assets, total assets, total liabilities, current liabilities.
Balance Sheet Kpis Tabular Form Ppt PowerPoint Presentation Show Icons
This is a balance sheet kpis tabular form ppt powerpoint presentation show icons. This is a four stage process. The stages in this process are current assets, total assets, total liabilities, current liabilities.

Balance Sheet Kpis Ppt PowerPoint Presentation Layouts Design Ideas
This is a balance sheet kpis ppt powerpoint presentation layouts design ideas. This is a four stage process. The stages in this process are current assets, current liabilities, total assets, total liabilities.

Balance Sheet Kpis Ppt PowerPoint Presentation Infographics Good
This is a balance sheet kpis ppt powerpoint presentation infographics good. This is a four stage process. The stages in this process are current assets, current liabilities, total assets, total liabilities.

Financial Projections Balance Sheet Ppt PowerPoint Presentation Infographics Clipart Images
This is a financial projections balance sheet ppt powerpoint presentation infographics clipart images. This is a two stage process. The stages in this process are total liabilities, total fixed assets, trade receivables, total assets, inventories.
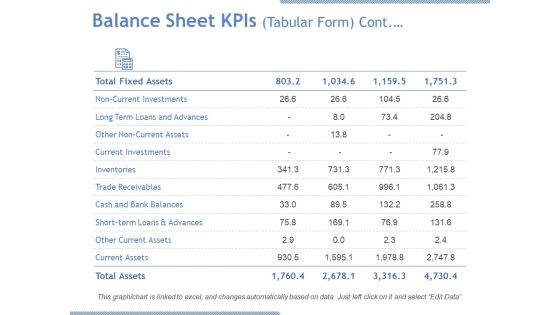
Balance Sheet Kpis Tabular Form Continuous Ppt PowerPoint Presentation Model Graphic Images
This is a balance sheet kpis tabular form continuous ppt powerpoint presentation model graphic images. This is a four stage process. The stages in this process are current investments, inventories, current assets, total assets, trade receivables.

Balance Sheet Kpis Ppt PowerPoint Presentation Infographic Template Inspiration
This is a balance sheet kpis ppt powerpoint presentation infographic template inspiration. This is a four stage process. The stages in this process are current assets, current liabilities, total assets, total liabilities.

Balance Sheet Kpis Template 1 Ppt PowerPoint Presentation Professional Graphics Download
This is a balance sheet kpis template 1 ppt powerpoint presentation professional graphics download. This is a four stage process. The stages in this process are current assets, current liabilities, total assets, total liabilities.

Balance Sheet Kpis Template 1 Ppt PowerPoint Presentation Pictures Grid
This is a balance sheet kpis template 1 ppt powerpoint presentation pictures grid. This is a four stage process. The stages in this process are current assets, current liabilities, total assets, total liabilities.

Balance Sheet Kpis Ppt PowerPoint Presentation Model Layout Ideas
This is a balance sheet kpis ppt powerpoint presentation model layout ideas. This is a four stage process. The stages in this process are current assets, current liabilities, total assets, total liabilities.
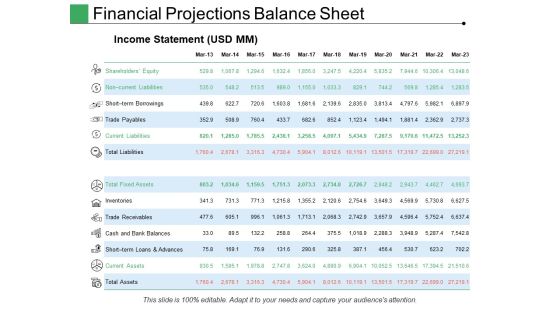
Financial Projections Balance Sheet Ppt PowerPoint Presentation Gallery Graphics Example
This is a financial projections balance sheet ppt powerpoint presentation gallery graphics example. This is a two stage process. The stages in this process are trade payables, current liabilities, inventories, total assets, trade payables, current assets.

Balance Sheet Graphical Representation Ppt PowerPoint Presentation Gallery Design Templates
This is a balance sheet graphical representation ppt powerpoint presentation gallery design templates. This is a four stage process. The stages in this process are current assets, current liabilities, total assets, total liabilities.

Financial Projections Balance Sheet Ppt PowerPoint Presentation Gallery Samples
This is a financial projections balance sheet ppt powerpoint presentation gallery samples. This is a two stage process. The stages in this process are trade payables, inventories, current assets, total assets, trade receivables.

Balance Sheet Kpis Ppt PowerPoint Presentation Slides Download
This is a balance sheet kpis ppt powerpoint presentation slides download. This is a four stage process. The stages in this process are current assets, total assets, current liabilities, total liabilities, business.

Balance Sheet Graphical Representation Ppt PowerPoint Presentation Inspiration Example
This is a balance sheet graphical representation ppt powerpoint presentation inspiration example. This is a four stage process. The stages in this process are business, current assets, current liabilities, total liabilities, total assets.

 Home
Home