Analytics

Customer Analytics Ppt PowerPoint Presentation Information
This is a customer analytics ppt powerpoint presentation information. This is a four stage process. The stages in this process are customer analytics.

Tools To Conduct SEO Analytics Training Ppt
This slide provides an overview of major tools to perform SEO analytics such as Google Analytics, SE Ranking, Sitechecker, Moz Pro, Ahrefs and SEMrush.
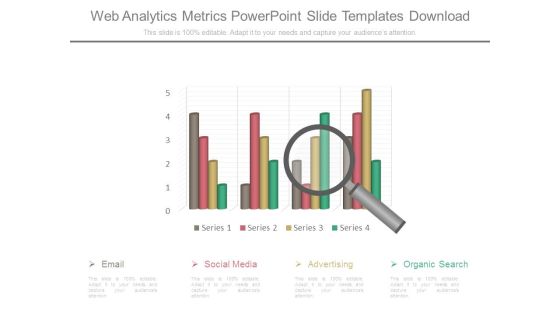
Web Analytics Metrics Powerpoint Slide Templates Download
This is a web analytics metrics powerpoint slide templates download. This is a one stage process. The stages in this process are email, social media, advertising, organic search.

Analytics Solutions Diagram Sample Of Ppt Presentation
This is a analytics solutions diagram sample of ppt presentation. This is a four stage process. The stages in this process are analytic applications, analytics, data sources, business intelligence.

Smartphone App Analytics Services Comparison Brochure PDF
This slide shows market share of various app analytics to understand customer behavior. It includes analytics such as google analytics, flurry analytics, facebook analytics, fabric, and mixpanel. Pitch your topic with ease and precision using this Smartphone App Analytics Services Comparison Brochure PDF. This layout presents information on Different Services Measure, Visitor Stats Differently, Provides Accurate Results. It is also available for immediate download and adjustment. So, changes can be made in the color, design, graphics or any other component to create a unique layout.

AI Driven Logistics Management Analytics Professional PDF
The purpose of this slide is to showcase supply chain data analytics to optimize the workflow by identifying inefficiencies and driving digital innovation. Certain analytics includes predictive, descriptive, prescriptive, and cognitive. Presenting AI Driven Logistics Management Analytics Professional PDF to dispense important information. This template comprises four stages. It also presents valuable insights into the topics including Predictive Analytics, Prescriptive Analytics, Descriptive Analytics. This is a completely customizable PowerPoint theme that can be put to use immediately. So, download it and address the topic impactfully.
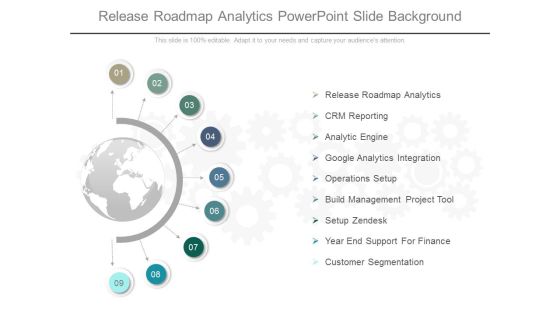
Release Roadmap Analytics Powerpoint Slide Background
This is a release roadmap analytics powerpoint slide background. This is a nine stage process. The stages in this process are release roadmap analytics, crm reporting, analytic engine, google analytics integration, operations setup, build management project tool, setup zendesk, year end support for finance, customer segmentation.
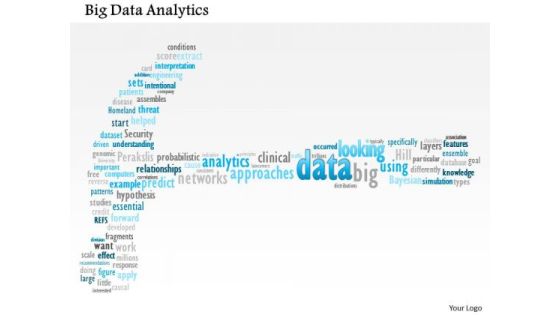
Business Framework Big Data Analytics PowerPoint Presentation
This unique power point diagram slide has been crafted with big data analytics. This data analytics is used to improve predictions and support decision making. Use this image slide for big data analysis related presentations.

Analytics Solutions Sample Of Ppt Presentation
This is a analytics solutions sample of ppt presentation. This is a eight stage process. The stages in this process are information sources, analytics solutions, system infrastructure, social network, big data, data discovery, data analysis, reports and dashboards.
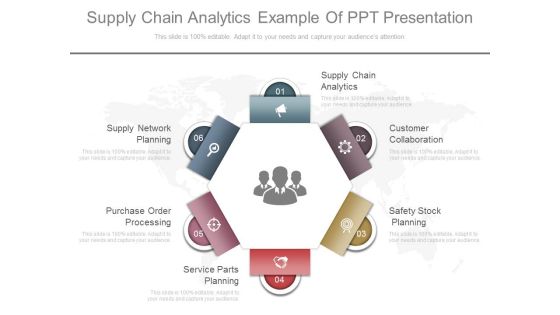
Supply Chain Analytics Example Of Ppt Presentation
This is a supply chain analytics example of ppt presentation. This is a six stage process. The stages in this process are supply chain analytics, customer collaboration, safety stock planning, purchase order processing, supply network planning, safety stock planning.
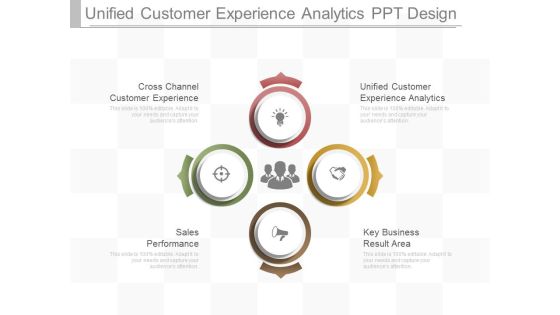
Unified Customer Experience Analytics Ppt Design
This is a unified customer experience analytics ppt design. This is a four stage process. The stages in this process are cross channel customer experience, unified customer experience analytics, sales, performance, key business result area.

Business Analytics Lab Example Of Ppt
This is a business analytics lab example of ppt. This is a four stage process. The stages in this process are managerial and organizational economics, business analytics, sustainable, interdisciplinary management factory.

Analytics Maturity Ppt Powerpoint Slide Background Designs
This is a analytics maturity ppt powerpoint slide background designs. This is a four stage process. The stages in this process are competitive advantage, analytics maturity, sense and respond, predict and analysis.

Customizable Dashboard Enhanced Analytics Powerpoint Slides
This is a customizable dashboard enhanced analytics powerpoint slides. This is a six stage process. The stages in this process are customizable dashboard, reports, real time updates, natural query, data warehouse, enhanced analytics.
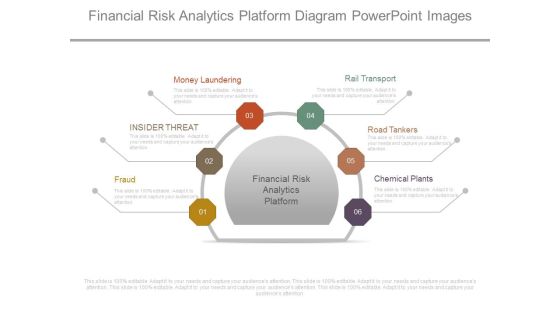
Financial Risk Analytics Platform Diagram Powerpoint Images
This is a financial risk analytics platform diagram powerpoint images. This is a six stage process. The stages in this process are money laundering, insider threat, fraud, rail transport, road tankers, chemical plants, financial risk analytics platform.

Analytics Insights Planning Template Ppt Images Gallery
This is a analytics insights planning template ppt images gallery. This is a seven stage process. The stages in this process are customer analytics, public relations, discover, engage, marketing, customer experiences, advertising.
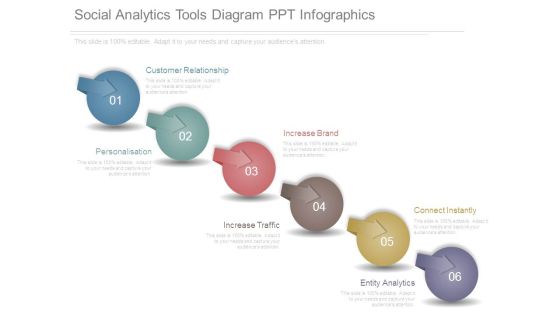
Social Analytics Tools Diagram Ppt Infographics
This is a social analytics tools diagram ppt infographics. This is a six stage process. The stages in this process are customer relationship, personalisation, increase brand, increase traffic, connect instantly, entity analytics.

Marketing Analytics Example Diagram Ppt Inspiration
This is a marketing analytics example diagram ppt inspiration. This is a six stage process. The stages in this process are marketing analytics, development, analysis, strategy, acquisition, retention, other solutions.

Data Modeling And Analytics Example Ppt Presentation
This is a data modeling and analytics example ppt presentation. This is a four stage process. The stages in this process are data modeling, data migration, balance data, explore data, data modeling and analytics.

Advantages Of SEO Analytics Training Ppt
The purpose of this slide is to provide an overview of SEO analytics. It also includes details of major SEO analytics benefits such as tracking online traffic, understanding user behavior, knowing the websites popular pages, and improving website content.

Analytics Strategy For Organizational Goals Clipart PDF
Presenting analytics strategy for organizational goals clipart pdf. to dispense important information. This template comprises six stages. It also presents valuable insights into the topics including business context, organization, analytics platform, analytics goals. This is a completely customizable PowerPoint theme that can be put to use immediately. So, download it and address the topic impactfully.

Business Environment Video Analytics Diagram Powerpoint Ideas
This is a business environment video analytics diagram powerpoint ideas. This is a four stage process. The stages in this process are camera, nvr, analytic server, remote client.

Centralized Data Analytics Team Structure Clipart PDF
This slide shows the model representing the structure of the centralized data analytics team. It includes key stakeholders such as vice president, centralized data analytics team, and analysts of units A,B and C.Persuade your audience using this Centralized Data Analytics Team Structure Clipart PDF. This PPT design coversone stage, thus making it a great tool to use. It also caters to a variety of topics including Vice President, Data Analytics, Analytics Team. Download this PPT design now to present a convincing pitch that not only emphasizes the topic but also showcases your presentation skills.

Salary Dashboard With Custom Analytics Rules PDF
The following slide highlights the payroll dashboard with custom analytics illustrating key headings which includes analytics and reports, custom analytics, current payroll, last payroll, task to do, actions required and employee. Showcasing this set of slides titled Salary Dashboard With Custom Analytics Rules PDF. The topics addressed in these templates are Custom Analytics, Current Payroll, Characterize Employee Profiles. All the content presented in this PPT design is completely editable. Download it and make adjustments in color, background, font etc. as per your unique business setting.

CRM Analytics Regional Growth Rate Diagrams PDF
This slide provides the glimpse of the customer relationship management analytics regional growth rate from 2020 to 2025.This is a crm analytics regional growth rate diagrams pdf template with various stages. Focus and dispense information on three stages using this creative set, that comes with editable features. It contains large content boxes to add your information on topics like crm analytics regional growth rate. You can also showcase facts, figures, and other relevant content using this PPT layout. Grab it now.

Oracle Analytics Cloud Professional Edition Graphics PDF
This slide defines the collaboration and publishing cloud solution of Oracle Analytics and how it encourages teamwork in the organizations. Presenting oracle analytics cloud professional edition graphics pdf to provide visual cues and insights. Share and navigate important information on seven stages that need your due attention. This template can be used to pitch topics like oracle analytics cloud solutions collaboration and publishing. In addtion, this PPT design contains high resolution images, graphics, etc, that are easily editable and available for immediate download.

Relevant Analytics Poorly Aligned Capabilities Ppt Presentation
This is a relevant analytics poorly aligned capabilities ppt presentation. This is a four stage process. The stages in this process are success, business, marketing, arrows.

Analytics Pervasive Business Intelligence Ppt Slides
This is a analytics pervasive business intelligence ppt slides. This is a six stage process. The stages in this process are circle charts, business, marketing.
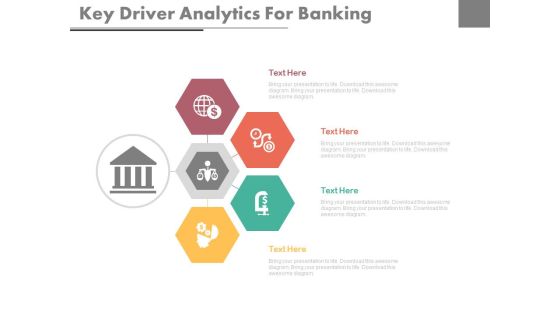
Key Driver Analytics For Banking Ppt Slides
This is a key driver analytics for banking ppt slides. This is a four stage process. The stages in this process are marketing, business, success, hexagon.

Marketing Analytics Diagram Powerpoint Slide Ideas
This is a marketing analytics diagram powerpoint slide ideas. This is a four stage process. The stages in this process are development, other solution, acquisition, retention.
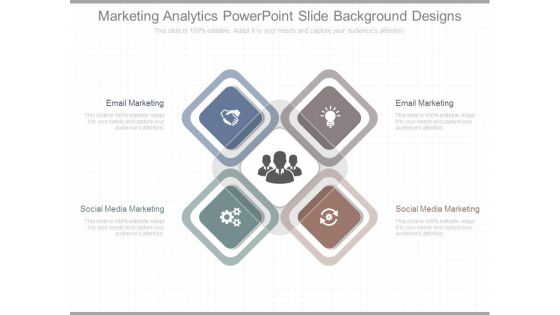
Marketing Analytics Powerpoint Slide Background Designs
This is a marketing analytics powerpoint slide background designs. This is a four stage process. The stages in this process are email marketing, social media marketing.

Visual Analytics Ppt Presentation Background Images
This is a visual analytics ppt presentation background images. This is a three stage process. The stages in this process are visualization, interaction, data analysis.
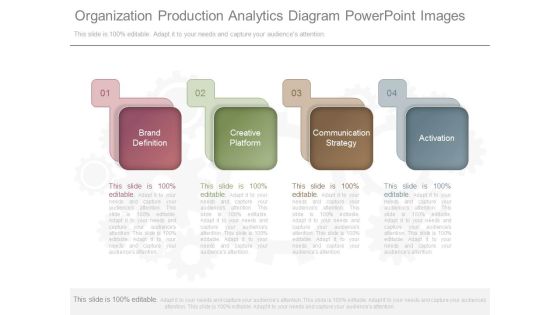
Organization Production Analytics Diagram Powerpoint Images
This is a organization production analytics diagram powerpoint images. This is a four stage process. The stages in this process are brand definition, creative platform, communication strategy, activation.

Business Intelligence And Analytics Template Ppt Slides
This is a business intelligence and analytics template ppt slides. This is a three stage process. The stages in this process are leadership skills, strategy, innovate business models.
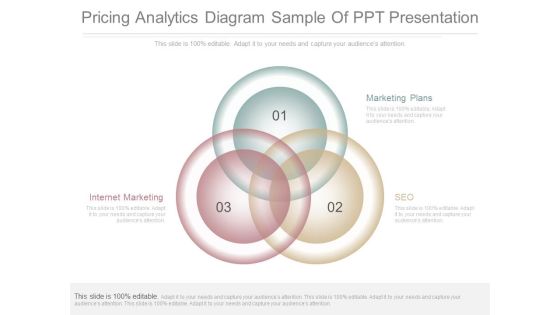
Pricing Analytics Diagram Sample Of Ppt Presentation
This is a pricing analytics diagram sample of ppt presentation. This is a three stage process. The stages in this process are internet marketing, marketing plans, seo.

Cloud Analytics Strategy Sample Diagram Powerpoint Guide
This is a cloud analytics strategy sample diagram powerpoint guide. This is a one stage process. The stages in this process are business, marketing, thought, presentation, strategy.
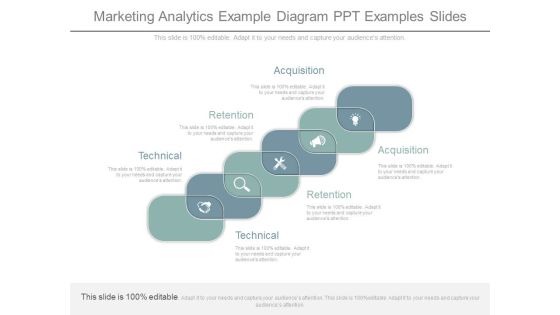
Marketing Analytics Example Diagram Ppt Examples Slides
This is a marketing analytics example diagram ppt examples slides. This is a six stage process. The stages in this process are acquisition, retention, technical.
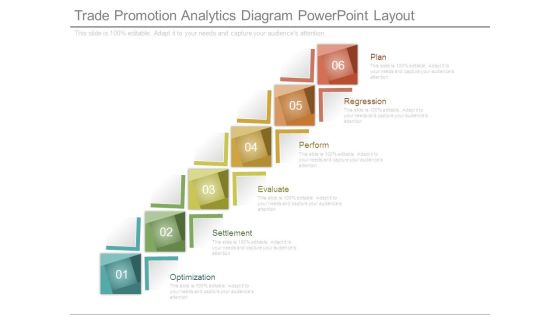
Trade Promotion Analytics Diagram Powerpoint Layout
This is a trade promotion analytics diagram powerpoint layout. This is a six stage process. The stages in this process are plan, regression, perform, evaluate, settlement, optimization.
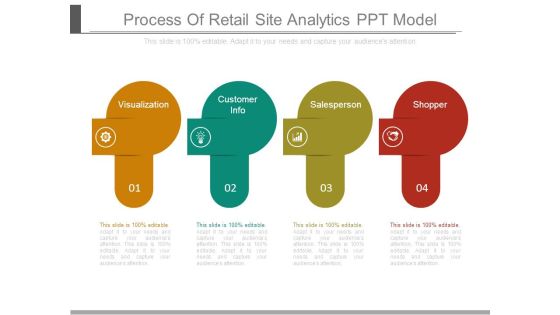
Process Of Retail Site Analytics Ppt Model
This is a process of retail site analytics ppt model. This is a four stage process. The stages in this process are visualization, customer info, salesperson, shopper.

Sales Analytics Ppt Layout Presentation Images
This is a sales analytics ppt layout presentation images. This is a five stage process. The stages in this process are sales reporting, sales portals, engine, reporter, pathfinder.

Insights Analytics Business Template Ppt Slide Examples
This is a insights analytics business template ppt slide examples. This is a five stage process. The stages in this process are messaging, contact, creative, explore, discover.

Marketing Analytics Technology Template Ppt Sample Download
This is a marketing analytics technology template ppt sample download. This is a six stage process. The stages in this process are strategy, technology, traffic, marketing, volume, shares.

Digital Marketing Analytics Diagram Ppt Summary
This is a digital marketing analytics diagram ppt summary. This is a four stage process. The stages in this process are content strategy, usability, engineering, architecture, strategy.

Marketing Management Analytics Diagram Ppt Background Graphics
This is a marketing management analytics diagram ppt background graphics. This is a five stage process. The stages in this process are product, price, place, targeting, positioning.
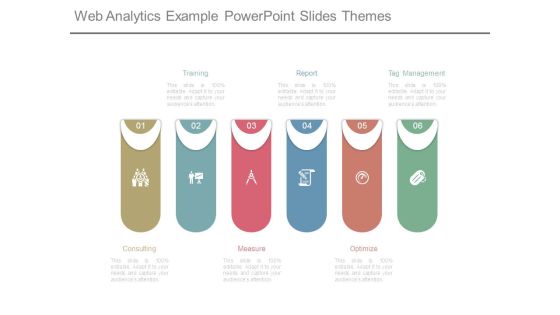
Web Analytics Example Powerpoint Slides Themes
This is a web analytics example powerpoint slides themes. This is a six stage process. The stages in this process are consulting, training, measure, report, optimize, tag management.

Web Analytics Process Framework Presentation Graphics
This is a web analytics process framework presentation graphics. This is a five stage process. The stages in this process are benchmarketing, management, implement, operations, social media.
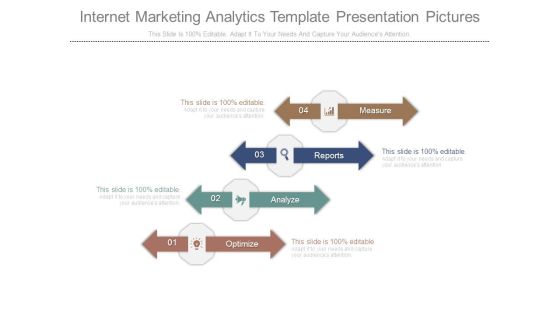
Internet Marketing Analytics Template Presentation Pictures
This is a internet marketing analytics template presentation pictures. This is a four stage process. The stages in this process are measure, reports, analyze, optimize.

Marketing Analytics Diagram Powerpoint Slides Backgrounds
This is a marketing analytics diagram powerpoint slides backgrounds. This is a four stage process. The stages in this process are acquisition, development, retention, other solutions.

Advanced Analytics Techniques Template Powerpoint Slides
This is a advanced analytics techniques template powerpoint slides. This is a six stage process. The stages in this process are reporting, strategy, collection, knowledge, information, data.
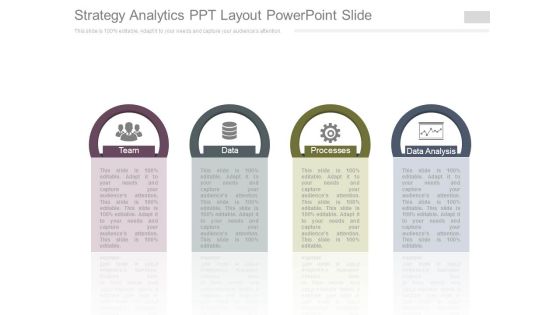
Strategy Analytics Ppt Layout Powerpoint Slide
This is a strategy analytics ppt layout powerpoint slide. This is a four stage process. The stages in this process are team, data, processes, data analysis.

Business Analytics Dashboard Diagram Example Of Ppt
This is a business analytics dashboard diagram example of ppt. This is a one stage process. The stages in this process are business, management, strategy, pie, presentation.
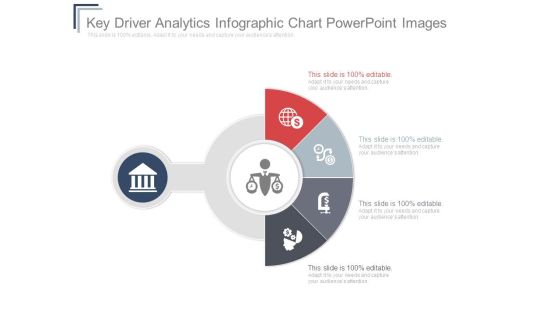
Key Driver Analytics Infographic Chart Powerpoint Images
This is a key driver analytics infographic chart powerpoint images. This is a five stage process. The stages in this process are business, marketing, semicircle, icons, strategy.
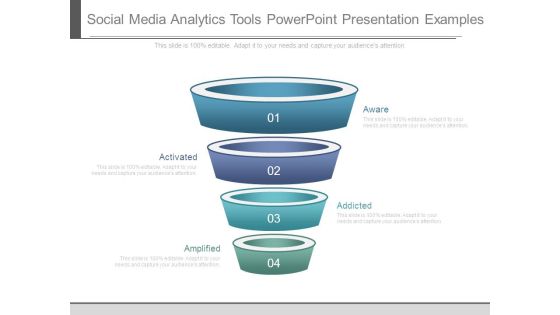
Social Media Analytics Tools Powerpoint Presentation Examples
This is a social media analytics tools powerpoint presentation examples. This is a four stage process. The stages in this process are activated, amplified, aware, addicted.

Bar Chart For Data Analytics Ppt Examples
This is a bar chart for data analytics ppt examples. This is a five stage process. The stages in this process are category.

Data Driven Analytics Chart Powerpoint Presentation Templates
This is a data driven analytics chart powerpoint presentation templates. This is a five stage process. The stages in this process are category.

Data Analytics Bar Chart Ppt Sample Presentations
This is a data analytics bar chart ppt sample presentations. This is a five stage process. The stages in this process are category.
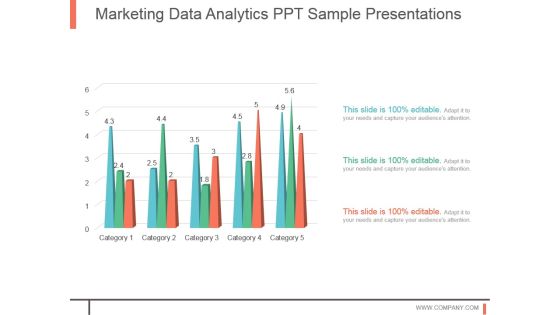
Marketing Data Analytics Ppt Sample Presentations
This is a marketing data analytics ppt sample presentations. This is a five stage process. The stages in this process are business, strategy, marketing, process, linear process.

Data Analytics For Marketing Growth Ppt Slide
This is a data analytics for marketing growth ppt slide. This is a five stage process. The stages in this process are category.

Paid Search Analytics Ppt PowerPoint Presentation Guidelines
This is a paid search analytics ppt powerpoint presentation guidelines. This is a three stage process. The stages in this process are budget, impressions, clicks.

Data Analytics Ppt PowerPoint Presentation Themes
This is a data analytics ppt powerpoint presentation themes. This is a five stage process. The stages in this process are business, marketing, presentation, data analyst, management.

 Home
Home