Analytics

Online Marketing Analytics To Enhance Business Growth Analyzing Landing Page Bounce Rate To Improve Rules PDF
This slide covers a brief overview of the bounce rate, showing the percentage of visitors who load a landing page but leave without taking action. It also includes trying A B testing, engaging the audience with videos, and investing in content marketing. Do you have to make sure that everyone on your team knows about any specific topic I yes, then you should give Online Marketing Analytics To Enhance Business Growth Analyzing Landing Page Bounce Rate To Improve Rules PDF a try. Our experts have put a lot of knowledge and effort into creating this impeccable Online Marketing Analytics To Enhance Business Growth Analyzing Landing Page Bounce Rate To Improve Rules PDF. You can use this template for your upcoming presentations, as the slides are perfect to represent even the tiniest detail. You can download these templates from the Slidegeeks website and these are easy to edit. So grab these today.
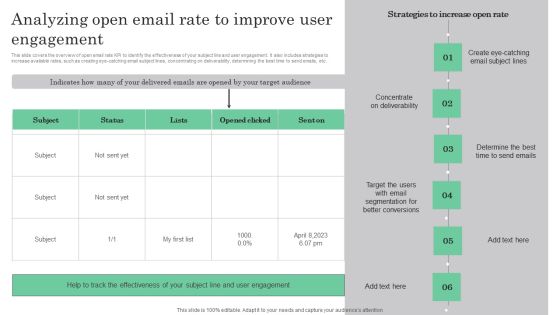
Online Marketing Analytics To Enhance Business Growth Analyzing Open Email Rate To Improve Themes PDF
This slide covers the overview of open email rate KPI to identify the effectiveness of your subject line and user engagement. It also includes strategies to increase available rates, such as creating eye-catching email subject lines, concentrating on deliverability, determining the best time to send emails, etc. Get a simple yet stunning designed Online Marketing Analytics To Enhance Business Growth Analyzing Open Email Rate To Improve Themes PDF. It is the best one to establish the tone in your meetings. It is an excellent way to make your presentations highly effective. So, download this PPT today from Slidegeeks and see the positive impacts. Our easy to edit Online Marketing Analytics To Enhance Business Growth Analyzing Open Email Rate To Improve Themes PDF can be your go to option for all upcoming conferences and meetings. So, what are you waiting for Grab this template today.
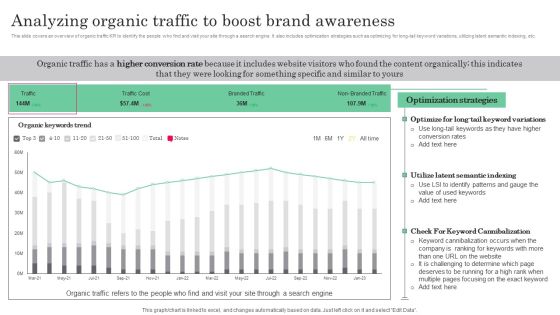
Online Marketing Analytics To Enhance Business Growth Analyzing Organic Traffic To Boost Brand Awareness Structure PDF
This slide covers an overview of organic traffic KPI to identify the people who find and visit your site through a search engine. It also includes optimization strategies such as optimizing for long-tail keyword variations, utilizing latent semantic indexing, etc. Create an editable Online Marketing Analytics To Enhance Business Growth Analyzing Organic Traffic To Boost Brand Awareness Structure PDF that communicates your idea and engages your audience. Whether youre presenting a business or an educational presentation, pre designed presentation templates help save time. Online Marketing Analytics To Enhance Business Growth Analyzing Organic Traffic To Boost Brand Awareness Structure PDF is highly customizable and very easy to edit, covering many different styles from creative to business presentations. Slidegeeks has creative team members who have crafted amazing templates. So, go and get them without any delay.
Online Marketing Analytics To Enhance Business Growth Kpi Dashboard For Tracking Paid Ad Campaign Diagrams PDF
This slide covers the dashboard for analyzing paid search metrics such as ad cost, clicks, impressions, click-through rate, cost per conversion, conversion rate, cost per click, etc. Do you have to make sure that everyone on your team knows about any specific topic I yes, then you should give Online Marketing Analytics To Enhance Business Growth Kpi Dashboard For Tracking Paid Ad Campaign Diagrams PDF a try. Our experts have put a lot of knowledge and effort into creating this impeccable Online Marketing Analytics To Enhance Business Growth Kpi Dashboard For Tracking Paid Ad Campaign Diagrams PDF. You can use this template for your upcoming presentations, as the slides are perfect to represent even the tiniest detail. You can download these templates from the Slidegeeks website and these are easy to edit. So grab these today.
Online Marketing Analytics To Enhance Business Growth Tracking Social Media Content Reach For Better Template PDF
This slide covers an overview of social media content reach to identify the number of people who see your content, either ads or posts. It also includes improvement strategies such as producing high-quality content, increasing the number of images, etc. Whether you have daily or monthly meetings, a brilliant presentation is necessary. Online Marketing Analytics To Enhance Business Growth Tracking Social Media Content Reach For Better Template PDF can be your best option for delivering a presentation. Represent everything in detail using Online Marketing Analytics To Enhance Business Growth Tracking Social Media Content Reach For Better Template PDF and make yourself stand out in meetings. The template is versatile and follows a structure that will cater to your requirements. All the templates prepared by Slidegeeks are easy to download and edit. Our research experts have taken care of the corporate themes as well. So, give it a try and see the results.
Online Marketing Analytics To Enhance Business Growth Tracking Social Media Engagement Rate For Improving Professional PDF
This slide covers an overview of the social media engagement rate to identify if the content is reaching the target audience. It also includes improvement strategies such as having a consistent, authentic voice, knowing your algorithms, and creating shareable content. Find highly impressive Online Marketing Analytics To Enhance Business Growth Tracking Social Media Engagement Rate For Improving Professional PDF on Slidegeeks to deliver a meaningful presentation. You can save an ample amount of time using these presentation templates. No need to worry to prepare everything from scratch because Slidegeeks experts have already done a huge research and work for you. You need to download Online Marketing Analytics To Enhance Business Growth Tracking Social Media Engagement Rate For Improving Professional PDF for your upcoming presentation. All the presentation templates are 100 percent editable and you can change the color and personalize the content accordingly. Download now.
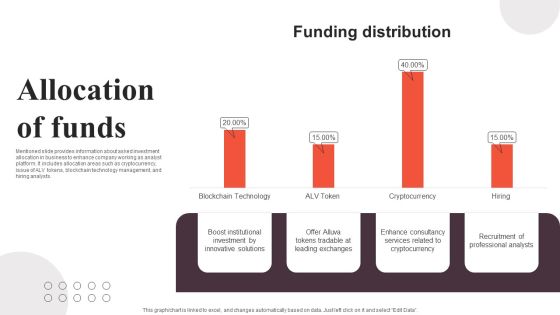
Financial Analytics Solution Investor Funding Elevator Pitch Deck Allocation Of Funds Ideas PDF
Mentioned slide provides information about asked investment allocation in business to enhance company working as analyst platform. It includes allocation areas such as cryptocurrency, issue of ALV tokens, blockchain technology management, and hiring analysts. Find highly impressive Financial Analytics Solution Investor Funding Elevator Pitch Deck Allocation Of Funds Ideas PDF on Slidegeeks to deliver a meaningful presentation. You can save an ample amount of time using these presentation templates. No need to worry to prepare everything from scratch because Slidegeeks experts have already done a huge research and work for you. You need to download Financial Analytics Solution Investor Funding Elevator Pitch Deck Allocation Of Funds Ideas PDF for your upcoming presentation. All the presentation templates are 100 percent editable and you can change the color and personalize the content accordingly. Download now.

Financial Analytics Solution Investor Funding Elevator Pitch Deck Client Testimonials Background PDF
This slide represents positive customer reviews related to the global analyst marketplace. It includes reviews from customers from Georgia, Florida, and California. If you are looking for a format to display your unique thoughts, then the professionally designed Financial Analytics Solution Investor Funding Elevator Pitch Deck Client Testimonials Background PDF is the one for you. You can use it as a Google Slides template or a PowerPoint template. Incorporate impressive visuals, symbols, images, and other charts. Modify or reorganize the text boxes as you desire. Experiment with shade schemes and font pairings. Alter, share or cooperate with other people on your work. Download Financial Analytics Solution Investor Funding Elevator Pitch Deck Client Testimonials Background PDF and find out how to give a successful presentation. Present a perfect display to your team and make your presentation unforgettable.

Financial Analytics Solution Investor Funding Elevator Pitch Deck Competitor Analysis Download PDF
Following slide provide insights into comparative assessment of FinTech companies. It includes key components such as description, employee base and revenue Crafting an eye catching presentation has never been more straightforward. Let your presentation shine with this tasteful yet straightforward Financial Analytics Solution Investor Funding Elevator Pitch Deck Competitor Analysis Download PDF template. It offers a minimalistic and classy look that is great for making a statement. The colors have been employed intelligently to add a bit of playfulness while still remaining professional. Construct the ideal Financial Analytics Solution Investor Funding Elevator Pitch Deck Competitor Analysis Download PDF that effortlessly grabs the attention of your audience. Begin now and be certain to wow your customers.
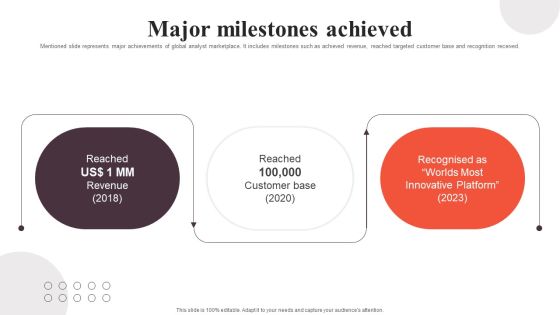
Financial Analytics Solution Investor Funding Elevator Pitch Deck Major Milestones Achieved Infographics PDF
Mentioned slide represents major achievements of global analyst marketplace. It includes milestones such as achieved revenue, reached targeted customer base and recognition received. Are you searching for a Financial Analytics Solution Investor Funding Elevator Pitch Deck Major Milestones Achieved Infographics PDF that is uncluttered, straightforward, and original Its easy to edit, and you can change the colors to suit your personal or business branding. For a presentation that expresses how much effort you have put in, this template is ideal. With all of its features, including tables, diagrams, statistics, and lists, its perfect for a business plan presentation. Make your ideas more appealing with these professional slides. Download Financial Analytics Solution Investor Funding Elevator Pitch Deck Major Milestones Achieved Infographics PDF from Slidegeeks today.
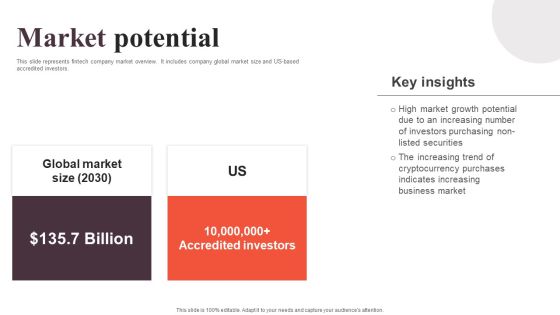
Financial Analytics Solution Investor Funding Elevator Pitch Deck Market Potential Information PDF
This slide represents fintech company market overview. It includes company global market size and US-based accredited investors. If you are looking for a format to display your unique thoughts, then the professionally designed Financial Analytics Solution Investor Funding Elevator Pitch Deck Market Potential Information PDF is the one for you. You can use it as a Google Slides template or a PowerPoint template. Incorporate impressive visuals, symbols, images, and other charts. Modify or reorganize the text boxes as you desire. Experiment with shade schemes and font pairings. Alter, share or cooperate with other people on your work. Download Financial Analytics Solution Investor Funding Elevator Pitch Deck Market Potential Information PDF and find out how to give a successful presentation. Present a perfect display to your team and make your presentation unforgettable.
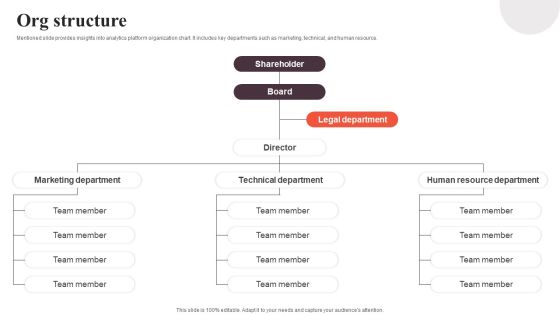
Financial Analytics Solution Investor Funding Elevator Pitch Deck Org Structure Ideas PDF
Mentioned slide provides insights into analytics platform organization chart. It includes key departments such as marketing, technical, and human resource. Are you in need of a template that can accommodate all of your creative concepts This one is crafted professionally and can be altered to fit any style. Use it with Google Slides or PowerPoint. Include striking photographs, symbols, depictions, and other visuals. Fill, move around, or remove text boxes as desired. Test out color palettes and font mixtures. Edit and save your work, or work with colleagues. Download Financial Analytics Solution Investor Funding Elevator Pitch Deck Org Structure Ideas PDF and observe how to make your presentation outstanding. Give an impeccable presentation to your group and make your presentation unforgettable.
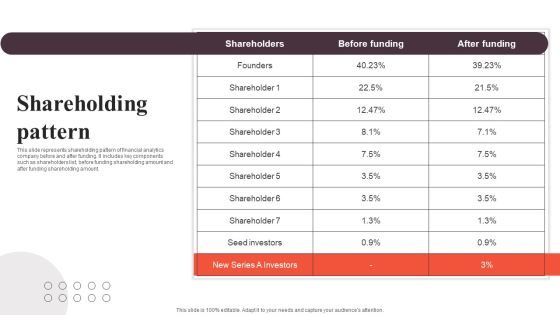
Financial Analytics Solution Investor Funding Elevator Pitch Deck Shareholding Pattern Pictures PDF
This slide represents shareholding pattern of financial analytics company before and after funding. It includes key components such as shareholders list, before funding shareholding amount and after funding shareholding amount. This modern and well arranged Financial Analytics Solution Investor Funding Elevator Pitch Deck Shareholding Pattern Pictures PDF provides lots of creative possibilities. It is very simple to customize and edit with the Powerpoint Software. Just drag and drop your pictures into the shapes. All facets of this template can be edited with Powerpoint no extra software is necessary. Add your own material, put your images in the places assigned for them, adjust the colors, and then you can show your slides to the world, with an animated slide included.

Financial Analytics Solution Investor Funding Elevator Pitch Deck Value Proposition USP Clipart PDF
Following slide provides information about unique services offered by global analyst company to formulate investment decisions. it includes USPs such as cryptocurrency prediction, asset portfolio and asset purchase option on platform. This Financial Analytics Solution Investor Funding Elevator Pitch Deck Value Proposition USP Clipart PDF is perfect for any presentation, be it in front of clients or colleagues. It is a versatile and stylish solution for organizing your meetings. The Financial Analytics Solution Investor Funding Elevator Pitch Deck Value Proposition USP Clipart PDF features a modern design for your presentation meetings. The adjustable and customizable slides provide unlimited possibilities for acing up your presentation. Slidegeeks has done all the homework before launching the product for you. So, do not wait, grab the presentation templates today
Information Analytics Company Outline ESG Performance Gender And Ethnic Diversity Icons PDF
This slide highlights the Experian ESG performance which includes gender diversity by level, racial and ethnic diversity by level USA and gender diversity targets. This Information Analytics Company Outline ESG Performance Gender And Ethnic Diversity Icons PDF is perfect for any presentation, be it in front of clients or colleagues. It is a versatile and stylish solution for organizing your meetings. The Information Analytics Company Outline ESG Performance Gender And Ethnic Diversity Icons PDF features a modern design for your presentation meetings. The adjustable and customizable slides provide unlimited possibilities for acing up your presentation. Slidegeeks has done all the homework before launching the product for you. So, do not wait, grab the presentation templates today

Information Analytics Company Outline Revenue By Business Activity And Regions Clipart PDF
This slide highlights the Experian company revenue which includes the revenue by business activity B2B Data, B2B decisioning and consumer services and revenue by regions North America, Latin America, UK, Ireland and EMEA. Here you can discover an assortment of the finest PowerPoint and Google Slides templates. With these templates, you can create presentations for a variety of purposes while simultaneously providing your audience with an eye catching visual experience. Download Information Analytics Company Outline Revenue By Business Activity And Regions Clipart PDF to deliver an impeccable presentation. These templates will make your job of preparing presentations much quicker, yet still, maintain a high level of quality. Slidegeeks has experienced researchers who prepare these templates and write high quality content for you. Later on, you can personalize the content by editing the Information Analytics Company Outline Revenue By Business Activity And Regions Clipart PDF.

Projection Model Methods Of Data Clustering In Predictive Analytics Formats PDF
This slide outlines the two primary information clustering methods used in the predictive analytics clustering model. The methods include K-means and K-nearest neighbor clustering, including the working of both approaches. This modern and well-arranged Projection Model Methods Of Data Clustering In Predictive Analytics Formats PDF provides lots of creative possibilities. It is very simple to customize and edit with the Powerpoint Software. Just drag and drop your pictures into the shapes. All facets of this template can be edited with Powerpoint, no extra software is necessary. Add your own material, put your images in the places assigned for them, adjust the colors, and then you can show your slides to the world, with an animated slide included.
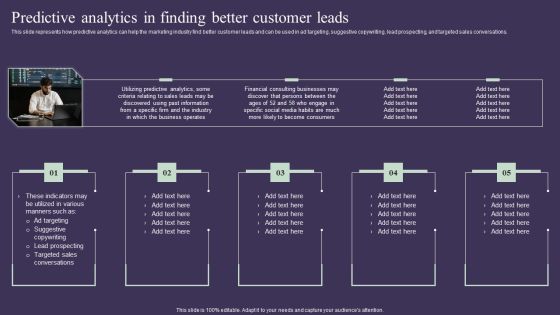
Projection Model Predictive Analytics In Finding Better Customer Leads Graphics PDF
This slide represents how predictive analytics can help the marketing industry find better customer leads and can be used in ad targeting, suggestive copywriting, lead prospecting, and targeted sales conversations. Do you know about Slidesgeeks Projection Model Predictive Analytics In Finding Better Customer Leads Graphics PDF These are perfect for delivering any kind od presentation. Using it, create PowerPoint presentations that communicate your ideas and engage audiences. Save time and effort by using our pre-designed presentation templates that are perfect for a wide range of topic. Our vast selection of designs covers a range of styles, from creative to business, and are all highly customizable and easy to edit. Download as a PowerPoint template or use them as Google Slides themes.

Projection Model Predictive Analytics In Predictive Maintenance And Monitoring Sample PDF
This slide represents the predictive analytics application in predictive maintenance and monitoring to avoid difficulties later. It is utilized to analyze oil and gas pipelines, mining rigs, turbine farms, and different industrial Internet of Things implementations. Slidegeeks is one of the best resources for PowerPoint templates. You can download easily and regulate Projection Model Predictive Analytics In Predictive Maintenance And Monitoring Sample PDF for your personal presentations from our wonderful collection. A few clicks is all it takes to discover and get the most relevant and appropriate templates. Use our Templates to add a unique zing and appeal to your presentation and meetings. All the slides are easy to edit and you can use them even for advertisement purposes.

Predictive Data Model Checklist For Predictive Analytics Model Deployment Sample PDF
This slide talks about the checklist for predictive analytics deployment that is necessary for organizations before deploying it and avoiding possible mistakes. It includes defining objectives, building the right team, and planning the deployment. Present like a pro with Predictive Data Model Checklist For Predictive Analytics Model Deployment Sample PDF Create beautiful presentations together with your team, using our easy-to-use presentation slides. Share your ideas in real-time and make changes on the fly by downloading our templates. So whether you are in the office, on the go, or in a remote location, you can stay in sync with your team and present your ideas with confidence. With Slidegeeks presentation got a whole lot easier. Grab these presentations today.

Predictive Data Model Methods Of Data Clustering In Predictive Analytics Rules PDF
This slide outlines the two primary information clustering methods used in the predictive analytics clustering model. The methods include K-means and K-nearest neighbor clustering, including the working of both approaches. Are you in need of a template that can accommodate all of your creative concepts This one is crafted professionally and can be altered to fit any style. Use it with Google Slides or PowerPoint. Include striking photographs, symbols, depictions, and other visuals. Fill, move around, or remove text boxes as desired. Test out color palettes and font mixtures. Edit and save your work, or work with colleagues. Download Predictive Data Model Methods Of Data Clustering In Predictive Analytics Rules PDF and observe how to make your presentation outstanding. Give an impeccable presentation to your group and make your presentation unforgettable.

Predictive Data Model Predictive Analytics In Banking And Finance Industry Introduction PDF
This slide represents the application of predictive analytics in the finance and banking sector as they deal with vast amounts of data. It helps these industries identify fraudulent transactions, generate credit score, monitor credit risks, and optimize cross-sell or up-sell possibilities. Retrieve professionally designed Predictive Data Model Predictive Analytics In Banking And Finance Industry Introduction PDF to effectively convey your message and captivate your listeners. Save time by selecting pre-made slideshows that are appropriate for various topics, from business to educational purposes. These themes come in many different styles, from creative to corporate, and all of them are easily adjustable and can be edited quickly. Access them as PowerPoint templates or as Google Slides themes. You do not have to go on a hunt for the perfect presentation because Slidegeeks got you covered from everywhere.

Predictive Data Model Predictive Analytics In Finding Better Customer Leads Sample PDF
This slide represents how predictive analytics can help the marketing industry find better customer leads and can be used in ad targeting, suggestive copywriting, lead prospecting, and targeted sales conversations. Slidegeeks has constructed Predictive Data Model Predictive Analytics In Finding Better Customer Leads Sample PDF after conducting extensive research and examination. These presentation templates are constantly being generated and modified based on user preferences and critiques from editors. Here, you will find the most attractive templates for a range of purposes while taking into account ratings and remarks from users regarding the content. This is an excellent jumping-off point to explore our content and will give new users an insight into our top-notch PowerPoint Templates.

Predictive Data Model Predictive Analytics In Predictive Maintenance And Monitoring Brochure PDF
This slide represents the predictive analytics application in predictive maintenance and monitoring to avoid difficulties later. It is utilized to analyze oil and gas pipelines, mining rigs, turbine farms, and different industrial Internet of Things implementations. Take your projects to the next level with our ultimate collection of Predictive Data Model Predictive Analytics In Predictive Maintenance And Monitoring Brochure PDF. Slidegeeks has designed a range of layouts that are perfect for representing task or activity duration, keeping track of all your deadlines at a glance. Tailor these designs to your exact needs and give them a truly corporate look with your own brand colors they will make your projects stand out from the rest

Predictive Data Model Predictive Analytics Models For Predictive Problems Structure PDF
This slide depicts the overview of predictive analytics models, including the predictive problems they solve, such as binary results, number prediction, detecting odd behavior, and so on. The models include classification, forecasting, anomaly, cluster, and time series. Boost your pitch with our creative Predictive Data Model Predictive Analytics Models For Predictive Problems Structure PDF. Deliver an awe-inspiring pitch that will mesmerize everyone. Using these presentation templates you will surely catch everyones attention. You can browse the ppts collection on our website. We have researchers who are experts at creating the right content for the templates. So you do not have to invest time in any additional work. Just grab the template now and use them.

Predictive Data Model Time Series Model Of Predictive Analytics Infographics PDF
This slide talks about the time series model of predictive analytics that makes future outcome predictions by taking time as input. This model can be implemented in customer support services and healthcare industries to predict the expected number of queries or patients. Slidegeeks is here to make your presentations a breeze with Predictive Data Model Time Series Model Of Predictive Analytics Infographics PDF With our easy-to-use and customizable templates, you can focus on delivering your ideas rather than worrying about formatting. With a variety of designs to choose from, you are sure to find one that suits your needs. And with animations and unique photos, illustrations, and fonts, you can make your presentation pop. So whether you are giving a sales pitch or presenting to the board, make sure to check out Slidegeeks first

Predictive Data Model Uses Of Predictive Analytics In Marketing Industry Themes PDF
This slide outlines the use of predictive analytics in the marketing industry, where active traders develop a new campaign based on customer behavior. The marketing use cases include understanding customer behavior, optimizing resources and spending, qualifying and prioritizing leads, and retaining customers. Are you in need of a template that can accommodate all of your creative concepts This one is crafted professionally and can be altered to fit any style. Use it with Google Slides or PowerPoint. Include striking photographs, symbols, depictions, and other visuals. Fill, move around, or remove text boxes as desired. Test out color palettes and font mixtures. Edit and save your work, or work with colleagues. Download Predictive Data Model Uses Of Predictive Analytics In Marketing Industry Themes PDF and observe how to make your presentation outstanding. Give an impeccable presentation to your group and make your presentation unforgettable.
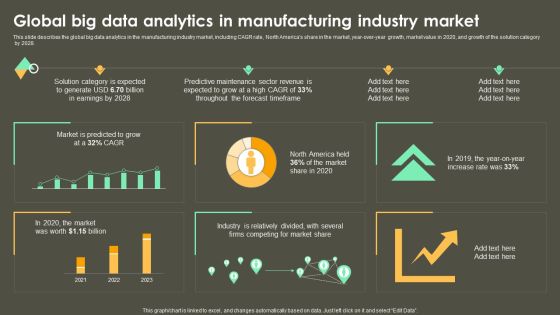
Iot Integration In Manufacturing Global Big Data Analytics In Manufacturing Industry Market Infographics PDF
This slide describes the global big data analytics in the manufacturing industry market, including CAGR rate, North Americas share in the market, year-over-year growth, market value in 2020, and growth of the solution category by 2028. Coming up with a presentation necessitates that the majority of the effort goes into the content and the message you intend to convey. The visuals of a PowerPoint presentation can only be effective if it supplements and supports the story that is being told. Keeping this in mind our experts created Iot Integration In Manufacturing Global Big Data Analytics In Manufacturing Industry Market Infographics PDF to reduce the time that goes into designing the presentation. This way, you can concentrate on the message while our designers take care of providing you with the right template for the situation.
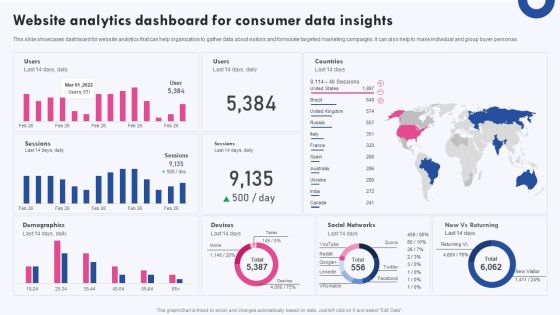
Targeted Marketing Campaigns To Improve Buyers Experience Website Analytics Dashboard For Consumer Infographics PDF
This slide showcases dashboard for website analytics that can help organization to gather data about visitors and formulate targeted marketing campaigns. It can also help to make individual and group buyer personas This modern and well arranged Targeted Marketing Campaigns To Improve Buyers Experience Website Analytics Dashboard For Consumer Infographics PDF provides lots of creative possibilities. It is very simple to customize and edit with the Powerpoint Software. Just drag and drop your pictures into the shapes. All facets of this template can be edited with Powerpoint no extra software is necessary. Add your own material, put your images in the places assigned for them, adjust the colors, and then you can show your slides to the world, with an animated slide included.
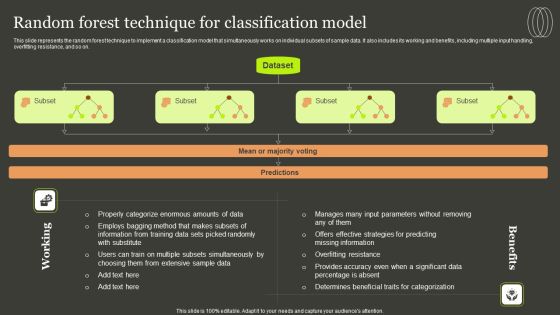
Predictive Analytics Methods Random Forest Technique For Classification Model Inspiration PDF
This slide represents the random forest technique to implement a classification model that simultaneously works on individual subsets of sample data. It also includes its working and benefits, including multiple input handling, overfitting resistance, and so on. Create an editable Predictive Analytics Methods Random Forest Technique For Classification Model Inspiration PDF that communicates your idea and engages your audience. Whether you are presenting a business or an educational presentation, pre designed presentation templates help save time. Predictive Analytics Methods Random Forest Technique For Classification Model Inspiration PDF is highly customizable and very easy to edit, covering many different styles from creative to business presentations. Slidegeeks has creative team members who have crafted amazing templates. So, go and get them without any delay.

Predictive Analytics Methods Steps To Build Predictive Algorithm Models Themes PDF
This slide discusses the steps required to create predictive algorithm models for business processes. The steps include defining scope and scale, profile data, information collection, cleaning, and integrating, comprising analytics in business processes, and tracking models and business results. Slidegeeks has constructed Predictive Analytics Methods Steps To Build Predictive Algorithm Models Themes PDF after conducting extensive research and examination. These presentation templates are constantly being generated and modified based on user preferences and critiques from editors. Here, you will find the most attractive templates for a range of purposes while taking into account ratings and remarks from users regarding the content. This is an excellent jumping off point to explore our content and will give new users an insight into our top notch PowerPoint Templates.
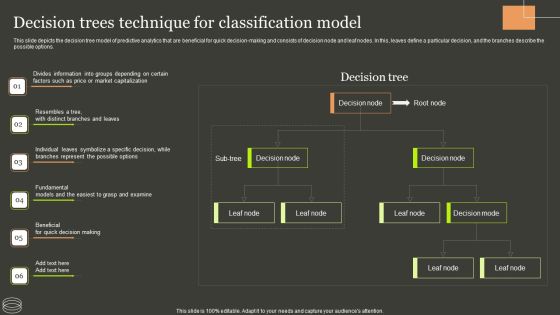
Predictive Analytics Methods Decision Trees Technique For Classification Model Formats PDF
This slide depicts the decision tree model of predictive analytics that are beneficial for quick decision-making and consists of decision node and leaf nodes. In this, leaves define a particular decision, and the branches describe the possible options. Take your projects to the next level with our ultimate collection of Predictive Analytics Methods Decision Trees Technique For Classification Model Formats PDF. Slidegeeks has designed a range of layouts that are perfect for representing task or activity duration, keeping track of all your deadlines at a glance. Tailor these designs to your exact needs and give them a truly corporate look with your own brand colors they will make your projects stand out from the rest.
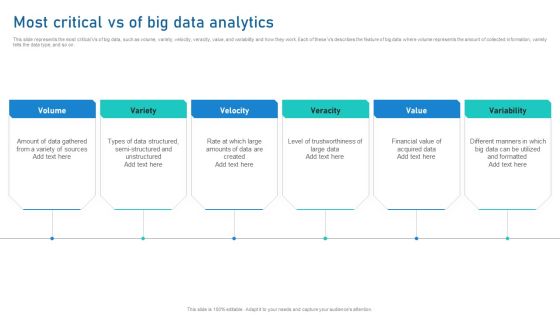
Intelligent Process Automation IPA Most Critical Vs Of Big Data Analytics Formats PDF
This slide represents the most critical Vs of big data, such as volume, variety, velocity, veracity, value, and variability and how they work. Each of these Vs describes the feature of big data where volume represents the amount of collected information, variety tells the data type, and so on. Do you have an important presentation coming up Are you looking for something that will make your presentation stand out from the rest Look no further than Intelligent Process Automation IPA Most Critical Vs Of Big Data Analytics Formats PDF. With our professional designs, you can trust that your presentation will pop and make delivering it a smooth process. And with Slidegeeks, you can trust that your presentation will be unique and memorable. So why wait Grab Intelligent Process Automation IPA Most Critical Vs Of Big Data Analytics Formats PDF today and make your presentation stand out from the rest
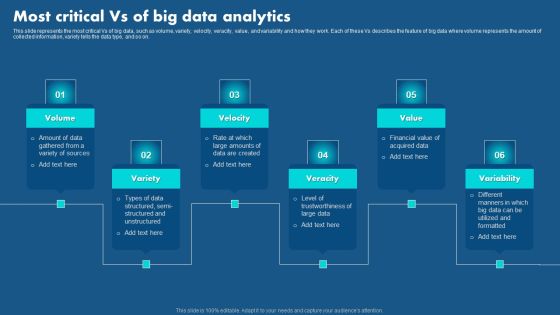
Role Of Hyperautomation In Redefining Business Most Critical Vs Of Big Data Analytics Introduction PDF
This slide represents the most critical Vs of big data, such as volume, variety, velocity, veracity, value, and variability and how they work. Each of these Vs describes the feature of big data where volume represents the amount of collected information, variety tells the data type, and so on. Do you have to make sure that everyone on your team knows about any specific topic I yes, then you should give Role Of Hyperautomation In Redefining Business Most Critical Vs Of Big Data Analytics Introduction PDF a try. Our experts have put a lot of knowledge and effort into creating this impeccable Role Of Hyperautomation In Redefining Business Most Critical Vs Of Big Data Analytics Introduction PDF. You can use this template for your upcoming presentations, as the slides are perfect to represent even the tiniest detail. You can download these templates from the Slidegeeks website and these are easy to edit. So grab these today.

Role Of Hyperautomation In Redefining Business Types Of Big Data Analytics Technology Professional PDF
This slide depicts the three types of big data, including structured, unstructured, and semi-structured. The structured data is kept in specific formats that are handled by machines only, and the unstructured data can be in any form, such as videos, audio, likes, and comments. Whether you have daily or monthly meetings, a brilliant presentation is necessary. Role Of Hyperautomation In Redefining Business Types Of Big Data Analytics Technology Professional PDF can be your best option for delivering a presentation. Represent everything in detail using Role Of Hyperautomation In Redefining Business Types Of Big Data Analytics Technology Professional PDF and make yourself stand out in meetings. The template is versatile and follows a structure that will cater to your requirements. All the templates prepared by Slidegeeks are easy to download and edit. Our research experts have taken care of the corporate themes as well. So, give it a try and see the results.
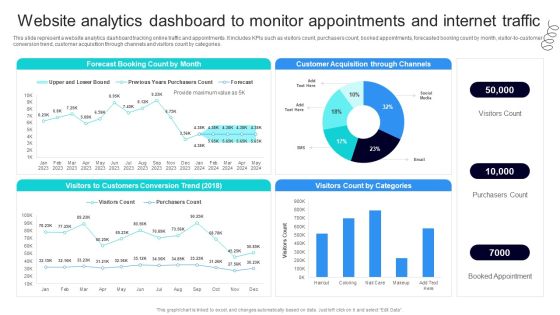
Strategic Marketing For Hair And Beauty Salon To Increase Website Analytics Dashboard Ideas PDF
This slide represent a website analytics dashboard tracking online traffic and appointments. It includes KPIs such as visitors count, purchasers count, booked appointments, forecasted booking count by month, visitor-to-customer conversion trend, customer acquisition through channels and visitors count by categories. Slidegeeks has constructed Strategic Marketing For Hair And Beauty Salon To Increase Website Analytics Dashboard Ideas PDF after conducting extensive research and examination. These presentation templates are constantly being generated and modified based on user preferences and critiques from editors. Here, you will find the most attractive templates for a range of purposes while taking into account ratings and remarks from users regarding the content. This is an excellent jumping off point to explore our content and will give new users an insight into our top notch PowerPoint Templates.

Ensuring Organizational Safety Using AML Transaction Using Behavioral Analytics Microsoft PDF
The following slide illustrates usage of behavioral analytics for multiple transactions and profiles. It provides information about transaction, collaborative, behavior sorted, user defined, global intelligent, merchant, risk sensitivity, false positives, financial crimes, etc. The Ensuring Organizational Safety Using AML Transaction Using Behavioral Analytics Microsoft PDF is a compilation of the most recent design trends as a series of slides. It is suitable for any subject or industry presentation, containing attractive visuals and photo spots for businesses to clearly express their messages. This template contains a variety of slides for the user to input data, such as structures to contrast two elements, bullet points, and slides for written information. Slidegeeks is prepared to create an impression.

Data Analytics Reporting Structure Ppt PowerPoint Presentation Infographics Clipart Images Cpb Pdf
Presenting this set of slides with name data analytics reporting structure ppt powerpoint presentation infographics clipart images cpb pdf. This is an editable Powerpoint one stages graphic that deals with topics like data analysis reporting tools to help convey your message better graphically. This product is a premium product available for immediate download and is 100 percent editable in Powerpoint. Download this now and use it in your presentations to impress your audience.

Data Services Market Data Pricing Analytics Ppt PowerPoint Presentation Slides Template Cpb Pdf
Presenting this set of slides with name data services market data pricing analytics ppt powerpoint presentation slides template cpb pdf. This is an editable Powerpoint four stages graphic that deals with topics like data security financial services to help convey your message better graphically. This product is a premium product available for immediate download and is 100 percent editable in Powerpoint. Download this now and use it in your presentations to impress your audience.
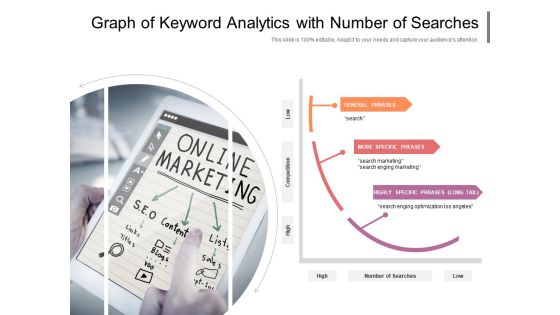
Graph Of Keyword Analytics With Number Of Searches Ppt PowerPoint Presentation Show Designs PDF
Presenting this set of slides with name graph of keyword analytics with number of searches ppt powerpoint presentation show designs pdf. This is a one stage process. The stages in this process are general phrases, more specific pheases, highly specific phrases long tail, high, number of searches, low, search marketing. This is a completely editable PowerPoint presentation and is available for immediate download. Download now and impress your audience.

Data Analytics Strategy With Performance Management And Data Application Ppt PowerPoint Presentation Summary Images PDF
Presenting this set of slides with name data analytics strategy with performance management and data application ppt powerpoint presentation summary images pdf. This is a six stage process. The stages in this process are data application, data life cycle, data architecture, process and methods, performance management. This is a completely editable PowerPoint presentation and is available for immediate download. Download now and impress your audience.

business intelligence and analytics dashboard ppt powerpoint presentation icon example topics pdf
Presenting this set of slides with name business intelligence and analytics dashboard ppt powerpoint presentation icon example topics pdf. The topics discussed in these slides are geographic distribution of total revenue, top 5 product by total revenue, measuring running by total revenue, how close are we to tour planned total revenue. This is a completely editable PowerPoint presentation and is available for immediate download. Download now and impress your audience.
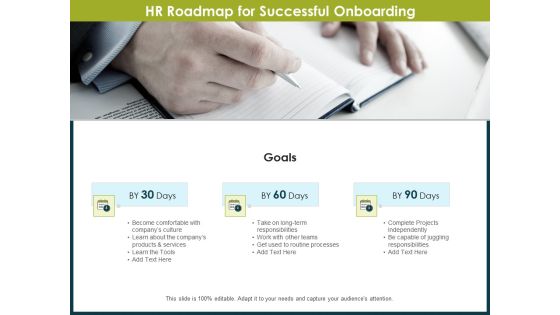
Roadmap Success People Analytics HR Roadmap For Successful Onboarding Ppt Gallery Aids PDF
Presenting this set of slides with name roadmap success people analytics hr roadmap for successful onboarding ppt gallery aids pdf. This is a three stage process. The stages in this process are become comfortable with companys culture, learn about the companys products and services, learn the tools, take on long term responsibilities. This is a completely editable PowerPoint presentation and is available for immediate download. Download now and impress your audience.

Seven Stages Circle Layout For Online Analytics Optimization Ppt PowerPoint Presentation Outline Background Designs PDF
Presenting this set of slides with name seven stages circle layout for online analytics optimization ppt powerpoint presentation outline background designs pdf. This is a seven stage process. The stages in this process are data mining, strategy formation, strategy implementation, reporting, analysis, optimization, measure business impact. This is a completely editable PowerPoint presentation and is available for immediate download. Download now and impress your audience.
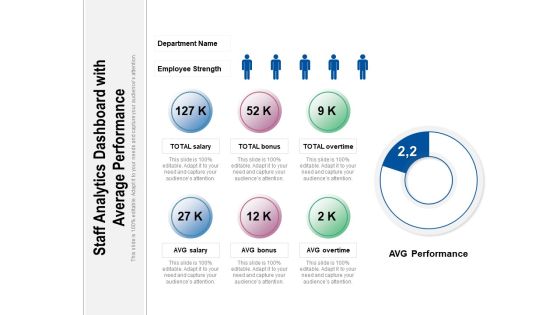
Staff Analytics Dashboard With Average Performance Ppt PowerPoint Presentation Gallery Infographics PDF
Persuade your audience using this staff analytics dashboard with average performance ppt powerpoint presentation gallery infographics pdf. This PPT design covers six stages, thus making it a great tool to use. It also caters to a variety of topics including salary, bonus, overtime. Download this PPT design now to present a convincing pitch that not only emphasizes the topic but also showcases your presentation skills.

Five Years Business Analytics Employee Career Roadmap With Salary Range Designs
Presenting our jaw-dropping five years business analytics employee career roadmap with salary range designs. You can alternate the color, font size, font type, and shapes of this PPT layout according to your strategic process. This PPT presentation is compatible with Google Slides and is available in both standard screen and widescreen aspect ratios. You can also download this well-researched PowerPoint template design in different formats like PDF, JPG, and PNG. So utilize this visually-appealing design by clicking the download button given below.

Half Yearly Business Analytics Employee Career Roadmap With Salary Range Elements
Presenting our jaw-dropping half yearly business analytics employee career roadmap with salary range elements. You can alternate the color, font size, font type, and shapes of this PPT layout according to your strategic process. This PPT presentation is compatible with Google Slides and is available in both standard screen and widescreen aspect ratios. You can also download this well-researched PowerPoint template design in different formats like PDF, JPG, and PNG. So utilize this visually-appealing design by clicking the download button given below.
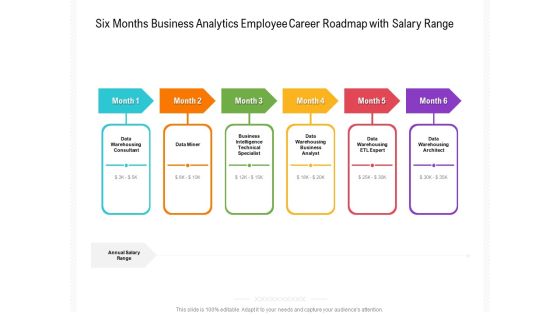
Six Months Business Analytics Employee Career Roadmap With Salary Range Pictures
Presenting our jaw-dropping six months business analytics employee career roadmap with salary range pictures. You can alternate the color, font size, font type, and shapes of this PPT layout according to your strategic process. This PPT presentation is compatible with Google Slides and is available in both standard screen and widescreen aspect ratios. You can also download this well-researched PowerPoint template design in different formats like PDF, JPG, and PNG. So utilize this visually-appealing design by clicking the download button given below.
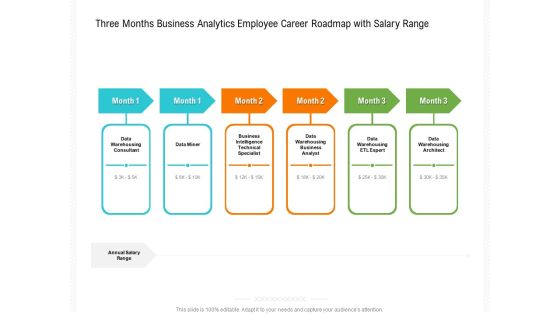
Three Months Business Analytics Employee Career Roadmap With Salary Range Information
Presenting our jaw-dropping three months business analytics employee career roadmap with salary range information. You can alternate the color, font size, font type, and shapes of this PPT layout according to your strategic process. This PPT presentation is compatible with Google Slides and is available in both standard screen and widescreen aspect ratios. You can also download this well-researched PowerPoint template design in different formats like PDF, JPG, and PNG. So utilize this visually-appealing design by clicking the download button given below.

Lead Scoring Model Predictive Analytics To Assess Lead Scoring Ppt Pictures Mockup PDF
This is a lead scoring model predictive analytics to assess lead scoring ppt pictures mockup pdf template with various stages. Focus and dispense information on five stages using this creative set, that comes with editable features. It contains large content boxes to add your information on topics like psychographic, firmographic, demographic, geographic, histographic. You can also showcase facts, figures, and other relevant content using this PPT layout. Grab it now.

Five Years Data Analytics Career Roadmap With Live Industry Projects Portrait
Presenting our jaw-dropping five years data analytics career roadmap with live industry projects portrait. You can alternate the color, font size, font type, and shapes of this PPT layout according to your strategic process. This PPT presentation is compatible with Google Slides and is available in both standard screen and widescreen aspect ratios. You can also download this well-researched PowerPoint template design in different formats like PDF, JPG, and PNG. So utilize this visually-appealing design by clicking the download button given below.
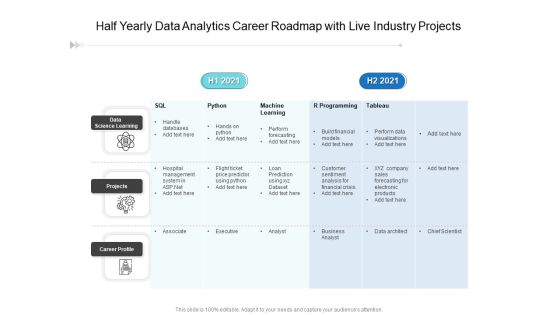
Half Yearly Data Analytics Career Roadmap With Live Industry Projects Formats
Presenting our jaw-dropping half yearly data analytics career roadmap with live industry projects formats You can alternate the color, font size, font type, and shapes of this PPT layout according to your strategic process. This PPT presentation is compatible with Google Slides and is available in both standard screen and widescreen aspect ratios. You can also download this well-researched PowerPoint template design in different formats like PDF, JPG, and PNG. So utilize this visually-appealing design by clicking the download button given below.

Six Months Data Analytics Career Roadmap With Live Industry Projects Demonstration
Presenting our jaw-dropping six months data analytics career roadmap with live industry projects demonstration. You can alternate the color, font size, font type, and shapes of this PPT layout according to your strategic process. This PPT presentation is compatible with Google Slides and is available in both standard screen and widescreen aspect ratios. You can also download this well-researched PowerPoint template design in different formats like PDF, JPG, and PNG. So utilize this visually-appealing design by clicking the download button given below.

Three Months Data Analytics Career Roadmap With Live Industry Projects Elements
Presenting our jaw-dropping three months data analytics career roadmap with live industry projects elements. You can alternate the color, font size, font type, and shapes of this PPT layout according to your strategic process. This PPT presentation is compatible with Google Slides and is available in both standard screen and widescreen aspect ratios. You can also download this well-researched PowerPoint template design in different formats like PDF, JPG, and PNG. So utilize this visually-appealing design by clicking the download button given below.
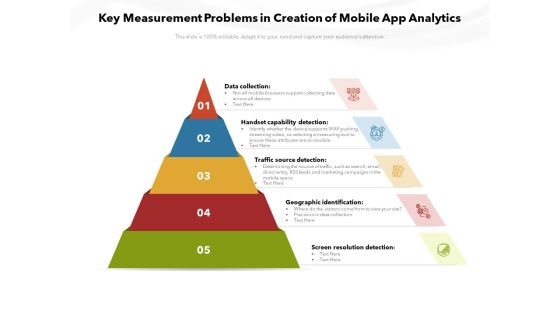
Key Measurement Problems In Creation Of Mobile App Analytics Ppt PowerPoint Presentation Pictures Inspiration PDF
Presenting key measurement problems in creation of mobile app analytics ppt powerpoint presentation pictures inspiration pdf to dispense important information. This template comprises five stages. It also presents valuable insights into the topics including data collection, handset capability detection, traffic source detection, geographic identification. This is a completely customizable PowerPoint theme that can be put to use immediately. So, download it and address the topic impactfully.

Mobile Analytics Channels With Reliable Infrastructure Ppt PowerPoint Presentation Model Graphics Tutorials PDF
Presenting mobile analytics channels with reliable infrastructure ppt powerpoint presentation model graphics tutorials pdf to dispense important information. This template comprises six stages. It also presents valuable insights into the topics including integrate easily, measure user engagement, offer dashboards, reliable infrastructure, offer unified view customer. This is a completely customizable PowerPoint theme that can be put to use immediately. So, download it and address the topic impactfully.
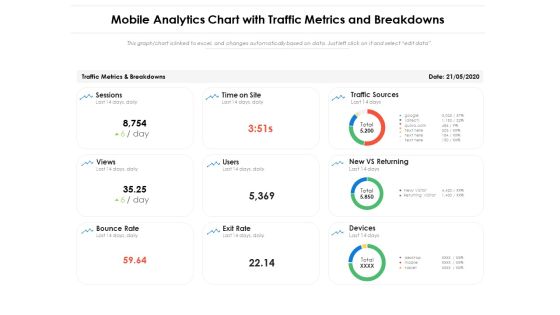
Mobile Analytics Chart With Traffic Metrics And Breakdowns Ppt PowerPoint Presentation Ideas Layout PDF
Pitch your topic with ease and precision using this mobile analytics chart with traffic metrics and breakdowns ppt powerpoint presentation ideas layout pdf. This layout presents information on traffic sources, new vs returning, devices, bounce rate, sessions. It is also available for immediate download and adjustment. So, changes can be made in the color, design, graphics or any other component to create a unique layout.

Mobile Analytics To Assess User Interactions Ppt PowerPoint Presentation Layouts Design Inspiration PDF
Pitch your topic with ease and precision using this mobile analytics to assess user interactions ppt powerpoint presentation layouts design inspiration pdf. This layout presents information on platform android, occurrences, affected users, latest app version, revenue loss. It is also available for immediate download and adjustment. So, changes can be made in the color, design, graphics or any other component to create a unique layout.

Data Analytics Planning Roadmap With Key Business Drivers Ppt PowerPoint Presentation Gallery Deck PDF
Persuade your audience using this data analytics planning roadmap with key business drivers ppt powerpoint presentation gallery deck pdf. This PPT design covers five stages, thus making it a great tool to use. It also caters to a variety of topics including business, strategy, performance. Download this PPT design now to present a convincing pitch that not only emphasizes the topic but also showcases your presentation skills.

Data Analytics Roadmap With Selecting And Shifting Data Ppt PowerPoint Presentation File Designs PDF
Persuade your audience using this data analytics roadmap with selecting and shifting data ppt powerpoint presentation file designs pdf. This PPT design covers six stages, thus making it a great tool to use. It also caters to a variety of topics including developing, sources, data. Download this PPT design now to present a convincing pitch that not only emphasizes the topic but also showcases your presentation skills.

 Home
Home