Analytics Icon
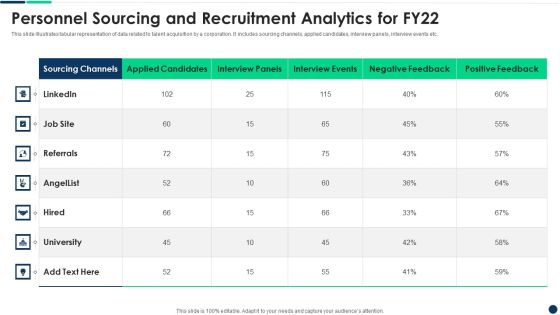
Personnel Sourcing And Recruitment Analytics For FY22 Diagrams PDF
Pitch your topic with ease and precision using this Personnel Sourcing And Recruitment Analytics For FY22 Diagrams PDF This layout presents information on Personnel Sourcing And Recruitment Analytics For Fy22 It is also available for immediate download and adjustment. So, changes can be made in the color, design, graphics or any other component to create a unique layout.
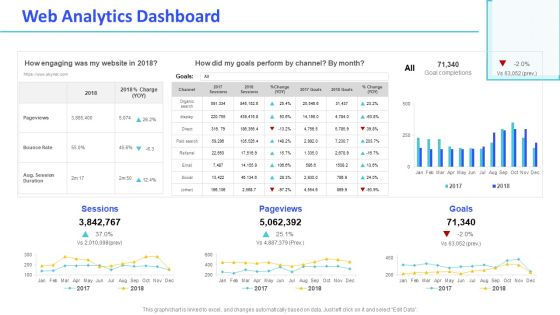
Monthly Digital Marketing Report Template Web Analytics Dashboard Mockup PDF
Deliver and pitch your topic in the best possible manner with this monthly digital marketing report template web analytics dashboard mockup pdf. Use them to share invaluable insights on web analytics dashboard and impress your audience. This template can be altered and modified as per your expectations. So, grab it now.
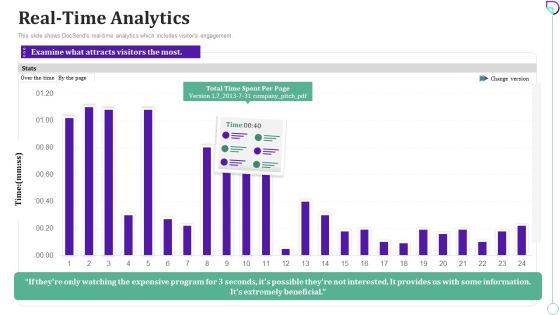
Docsend Capital Raising Pitch Deck Real Time Analytics Pictures PDF
This slide shows DocSends real time analytics which includes visitors engagement.Deliver and pitch your topic in the best possible manner with this Docsend Capital Raising Pitch Deck Real Time Analytics Pictures PDF Use them to share invaluable insights on Expensive Program, Extremely Beneficial, Provides Information and impress your audience. This template can be altered and modified as per your expectations. So, grab it now.
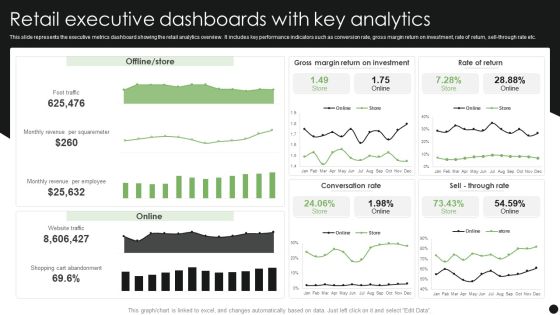
Retail Executive Dashboards With Key Analytics Guidelines PDF
Pitch your topic with ease and precision using this Retail Executive Dashboards With Key Analytics Guidelines PDF. This layout presents information on Retail Executive Dashboards, Key Analytics. It is also available for immediate download and adjustment. So, changes can be made in the color, design, graphics or any other component to create a unique layout.

Influencer Marketing Digital Promotion Success Analytics Structure PDF
Pitch your topic with ease and precision using this Influencer Marketing Digital Promotion Success Analytics Structure PDF. This layout presents information on Digital Promotion, Success Analytics. It is also available for immediate download and adjustment. So, changes can be made in the color, design, graphics or any other component to create a unique layout.

Agenda Checklist Infographic For Predictive Analytics Promotions Infographics PDF
Presenting agenda checklist infographic for predictive analytics promotions infographics pdf to dispense important information. This template comprises three stages. It also presents valuable insights into the topics including agenda checklist infographic for predictive analytics promotions. This is a completely customizable PowerPoint theme that can be put to use immediately. So, download it and address the topic impactfully.

Analytics Application PPT With Key Features Infographics PDF
Presenting analytics application ppt with key features infographics pdf to dispense important information. This template comprises four stages. It also presents valuable insights into the topics including analytics application ppt with key features. This is a completely customizable PowerPoint theme that can be put to use immediately. So, download it and address the topic impactfully.

Predictive Data Model Tools Used For Predictive Analytics Download PDF
This slide depicts the tools used for predictive analytics to perform operations in predictive models. These tools include SPSS statistics, SAS advanced analytics, SAP predictive analytics, TIBCO Statistica, H2O, and Q research. Whether you have daily or monthly meetings, a brilliant presentation is necessary. Predictive Data Model Tools Used For Predictive Analytics Download PDF can be your best option for delivering a presentation. Represent everything in detail using Predictive Data Model Tools Used For Predictive Analytics Download PDF and make yourself stand out in meetings. The template is versatile and follows a structure that will cater to your requirements. All the templates prepared by Slidegeeks are easy to download and edit. Our research experts have taken care of the corporate themes as well. So, give it a try and see the results.
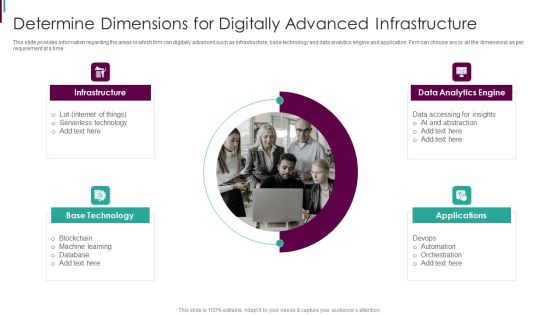
Developing Business Analytics Framework Determine Dimensions Diagrams PDF
This slide provides information regarding the areas in which firm can digitally advanced such as infrastructure, base technology and data analytics engine and application. Firm can choose any or all the dimensions as per requirement at a time. This is a Developing Business Analytics Framework Determine Dimensions Diagrams PDF template with various stages. Focus and dispense information on four stages using this creative set, that comes with editable features. It contains large content boxes to add your information on topics like Infrastructure, Analytics Engine, Base Technology You can also showcase facts, figures, and other relevant content using this PPT layout. Grab it now.

Four Components Of Big Data And Analytics Framework Diagrams PDF
This slide illustrate four different components of data and analytics architecture that enable people and teams to store and analyze organizations data. It includes components such as data collection, transformation, data storage and analytics Persuade your audience using this Four Components Of Big Data And Analytics Framework Diagrams PDF. This PPT design covers four stages, thus making it a great tool to use. It also caters to a variety of topics including Data Collection, Transformation, Data Storage. Download this PPT design now to present a convincing pitch that not only emphasizes the topic but also showcases your presentation skills.
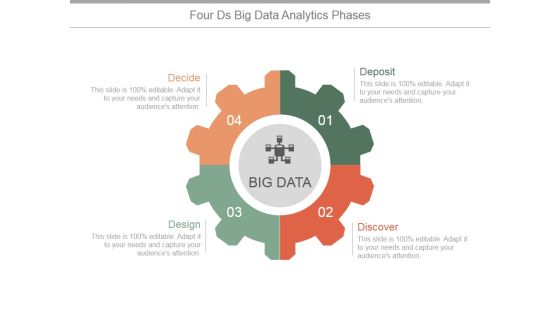
Four Ds Big Data Analytics Phases Ppt PowerPoint Presentation Shapes
This is a four ds big data analytics phases ppt powerpoint presentation shapes. This is a four stage process. The stages in this process are deposit, discover, design, decide.

B2b Marketing Analytics Dashboard With Engagement Rate Microsoft PDF
The purpose of this slide is to display analytics dashboard which can be used by company to highlight marketing campaign performance. Information covered in this template is related to shares and likes by social media platforms, total engagement rate etc. Showcasing this set of slides titled B2b Marketing Analytics Dashboard With Engagement Rate Microsoft PDF. The topics addressed in these templates are B2b Marketing Analytics Dashboard With Engagement Rate. All the content presented in this PPT design is completely editable. Download it and make adjustments in color, background, font etc. as per your unique business setting.
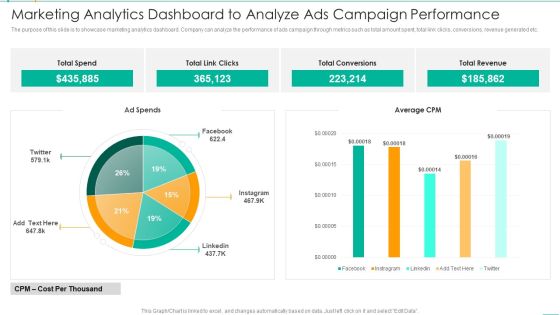
Marketing Analytics Dashboard To Analyze Ads Campaign Performance Microsoft PDF
The purpose of this slide is to showcase marketing analytics dashboard. Company can analyze the performance of ads campaign through metrics such as total amount spent, total link clicks, conversions, revenue generated etc. Showcasing this set of slides titled Marketing Analytics Dashboard To Analyze Ads Campaign Performance Microsoft PDF. The topics addressed in these templates are Marketing Analytics Dashboard To Analyze Ads Campaign Performance. All the content presented in this PPT design is completely editable. Download it and make adjustments in color, background, font etc. as per your unique business setting.

Marketing Analytics Dashboard With Conversion Rate Summary PDF
The purpose of this slide is to outline marketing analytics dashboard. The dashboard provides information about key metrices such as total impressions, clicks, cost, conversion value, rate, ROAS, market share by different ad platforms etc. Pitch your topic with ease and precision using this Marketing Analytics Dashboard With Conversion Rate Summary PDF. This layout presents information on Marketing Analytics Dashboard With Conversion Rate. It is also available for immediate download and adjustment. So, changes can be made in the color, design, graphics or any other component to create a unique layout.

Strategic B2B Marketing Agency Rollout Communication Plan Analytics Background PDF
This slide consists of a dashboard that can be used by marketing agencies for monitoring the success of client marketing strategy. Key performing indicators included in the slide are top rankings, google analytics, website audit, etc. Showcasing this set of slides titled Strategic B2B Marketing Agency Rollout Communication Plan Analytics Background PDF. The topics addressed in these templates are Top Ranking, Google Analytics, Website Audit. All the content presented in this PPT design is completely editable. Download it and make adjustments in color, background, font etc. as per your unique business setting.

E Mail Performance Analytics Metrics Tracking Report Analysis Demonstration PDF
The purpose of this slide is to showcase an e-mail analytics mechanism in order to track the performance of certain e-mail marketing based on various metrics. Certain KPIs include open rate, click rate, unsubscribe rate etc. Pitch your topic with ease and precision using this E Mail Performance Analytics Metrics Tracking Report Analysis Demonstration PDF. This layout presents information on E Mail Performance Analytics, Metrics Tracking Report Analysis. It is also available for immediate download and adjustment. So, changes can be made in the color, design, graphics or any other component to create a unique layout.
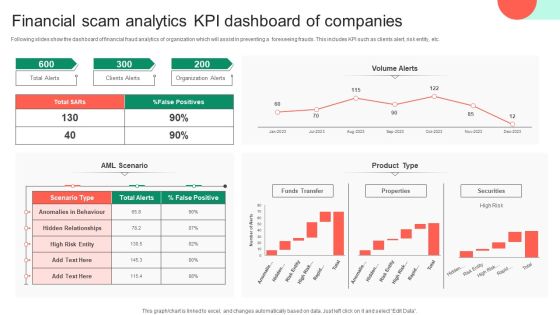
Financial Scam Analytics KPI Dashboard Of Companies Clipart PDF
Following slides show the dashboard of financial fraud analytics of organization which will assist in preventing a foreseeing frauds. This includes KPI such as clients alert, risk entity, etc. Pitch your topic with ease and precision using this Financial Scam Analytics KPI Dashboard Of Companies Clipart PDF. This layout presents information on Financial Scam Analytics, Kpi Dashboard Of Companies. It is also available for immediate download and adjustment. So, changes can be made in the color, design, graphics or any other component to create a unique layout.

Projection Model Introduction To Predictive Analytics Technology Elements PDF
This slide represents the predictive analytics introduction that is used for forecasts action, behaviors, and trends using recent and past information. It performs the operations such as data mining, text analytics, statistics, and modeling on structured and unstructured data. Make sure to capture your audiences attention in your business displays with our gratis customizable Projection Model Introduction To Predictive Analytics Technology Elements PDF. These are great for business strategies, office conferences, capital raising or task suggestions. If you desire to acquire more customers for your tech business and ensure they stay satisfied, create your own sales presentation with these plain slides.

Workforce Analytics Tools For Employee Enhancement Clipart PDF
This slide represents workforce analytics tool. It includes data visualization, cloud support, real-time data analytics, actionable insights, employee experience, etc., for staff optimization. Do you know about Slidesgeeks Workforce Analytics Tools For Employee Enhancement Clipart PDF These are perfect for delivering any kind od presentation. Using it, create PowerPoint presentations that communicate your ideas and engage audiences. Save time and effort by using our pre-designed presentation templates that are perfect for a wide range of topic. Our vast selection of designs covers a range of styles, from creative to business, and are all highly customizable and easy to edit. Download as a PowerPoint template or use them as Google Slides themes.

Dashboard For Monthly Recruitment Metrics And Analytics Themes PDF
The slide depicts the dashboard for monthly recruitment metrics and analytics depicting monthly recruitment, recruitment by department and source, candidate feedback and offer acceptance rate.Showcasing this set of slides titled Dashboard For Monthly Recruitment Metrics And Analytics Themes PDF The topics addressed in these templates are Recruitment Department, Recruitment Source, Interview Activity All the content presented in this PPT design is completely editable. Download it and make adjustments in color, background, font etc. as per your unique business setting.

Cloud Analytics Platform Ppt PowerPoint Presentation Styles Topics
Presenting this set of slides with name cloud analytics platform ppt powerpoint presentation styles topics. This is an editable Powerpoint four stages graphic that deals with topics like cloud analytics platform to help convey your message better graphically. This product is a premium product available for immediate download, and is 100 percent editable in Powerpoint. Download this now and use it in your presentations to impress your audience.
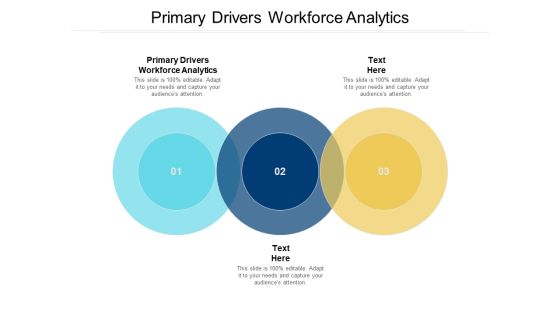
Primary Drivers Workforce Analytics Ppt PowerPoint Presentation Inspiration Gridlines Cpb
Presenting this set of slides with name primary drivers workforce analytics ppt powerpoint presentation inspiration gridlines cpb. This is an editable Powerpoint three stages graphic that deals with topics like primary drivers workforce analytics to help convey your message better graphically. This product is a premium product available for immediate download and is 100 percent editable in Powerpoint. Download this now and use it in your presentations to impress your audience.

Drive Marketing Analytics And Insight Process Diagram Powerpoint Slides
This is a drive marketing analytics and insight process diagram powerpoint slides. This is a six stage process. The stages in this process are share, access, clean, visualize, explore, mash up.
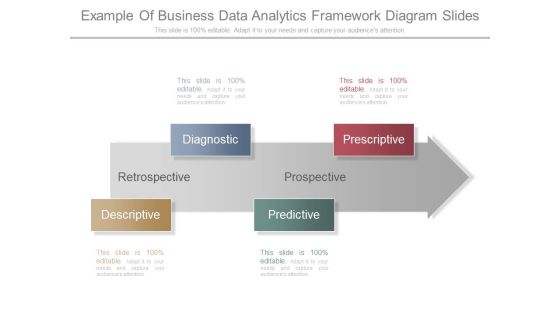
Example Of Business Data Analytics Framework Diagram Slides
This is a example of business data analytics framework diagram slides. This is a four stage process. The stages in this process are diagnostic, descriptive, predictive, prescriptive, retrospective, prospective.

Big Data Marketing Analytics Diagram Powerpoint Slide Backgrounds
This is a big data marketing analytics diagram powerpoint slide backgrounds. This is a five stage process. The stages in this process are marketing roi, reporting intelligence, pricing strategy, product design, pre post campaign strategy.
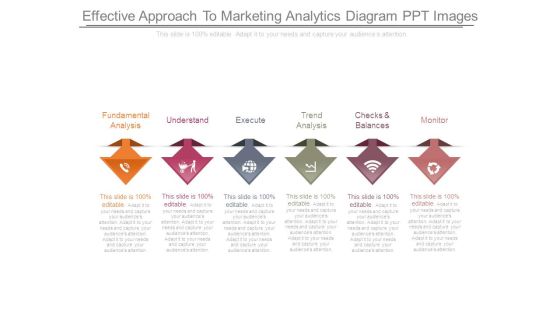
Effective Approach To Marketing Analytics Diagram Ppt Images
This is a effective approach to marketing analytics diagram ppt images. This is a six stage process. The stages in this process are fundamental analysis, understand, execute, trend analysis, checks and balances, monitor.

Cycle For Quality Assurance Analytics Diagram Ppt Example
This is a cycle for quality assurance analytics diagram ppt example. This is a six stage process. The stages in this process are development, production, assurance, baseline, logistics, quality.
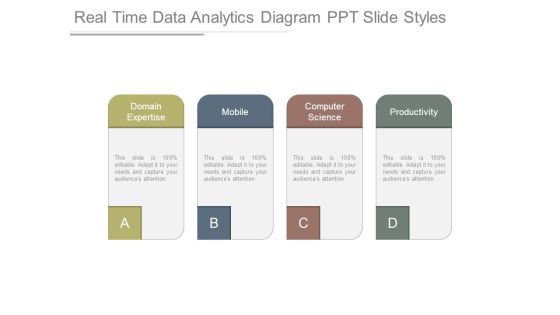
Real Time Data Analytics Diagram Ppt Slide Styles
This is a real time data analytics diagram ppt slide styles. This is a four stage process. The stages in this process are domain expertise, mobile, computer science, productivity.
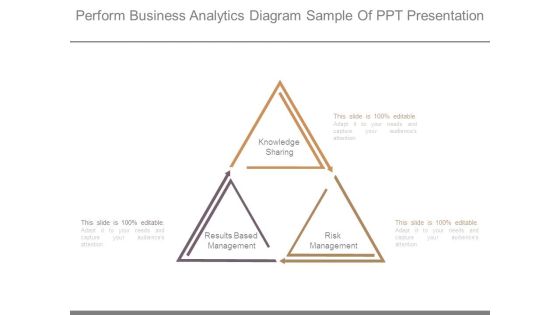
Perform Business Analytics Diagram Sample Of Ppt Presentation
This is a perform business analytics diagram sample of ppt presentation. This is a three stage process. The stages in this process are knowledge sharing, results based management, risk management.
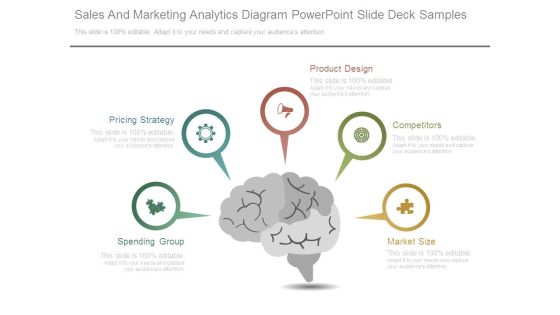
Sales And Marketing Analytics Diagram Powerpoint Slide Deck Samples
This is a sales and marketing analytics diagram powerpoint slide deck samples. This is a five stage process. The stages in this process are spending group, pricing strategy, product design, competitors, market size.

Advanced Analytics Tools Ppt PowerPoint Presentation Pictures Themes Cpb
Presenting this set of slides with name advanced analytics tools ppt powerpoint presentation pictures themes cpb. This is an editable Powerpoint four stages graphic that deals with topics like advanced analytics tools to help convey your message better graphically. This product is a premium product available for immediate download and is 100 percent editable in Powerpoint. Download this now and use it in your presentations to impress your audience.
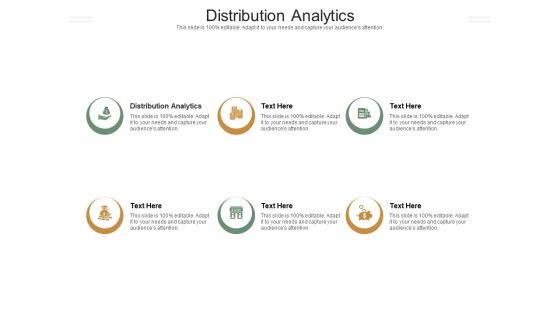
Distribution Analytics Ppt PowerPoint Presentation Model Themes Cpb Pdf
Presenting this set of slides with name distribution analytics ppt powerpoint presentation model themes cpb pdf. This is an editable Powerpoint Six stages graphic that deals with topics like distribution analytics to help convey your message better graphically. This product is a premium product available for immediate download and is 100 percent editable in Powerpoint. Download this now and use it in your presentations to impress your audience.
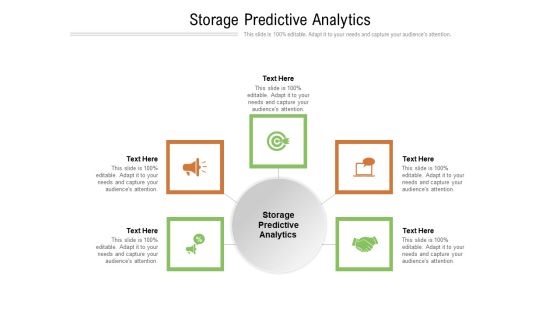
Storage Predictive Analytics Ppt PowerPoint Presentation Styles Themes Cpb Pdf
Presenting this set of slides with name storage predictive analytics ppt powerpoint presentation styles themes cpb pdf. This is an editable Powerpoint five stages graphic that deals with topics like storage predictive analytics to help convey your message better graphically. This product is a premium product available for immediate download and is 100 percent editable in Powerpoint. Download this now and use it in your presentations to impress your audience.
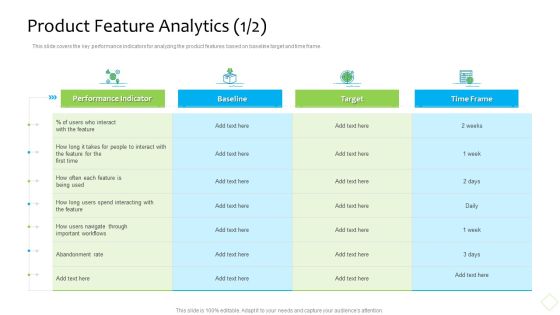
Product Demand Administration Product Feature Analytics Target Themes PDF
This slide covers the key performance indicators for analyzing the product features based on baseline target and time frame. Deliver an awe inspiring pitch with this creative product demand administration product feature analytics target themes pdf bundle. Topics like product feature analytics can be discussed with this completely editable template. It is available for immediate download depending on the needs and requirements of the user.
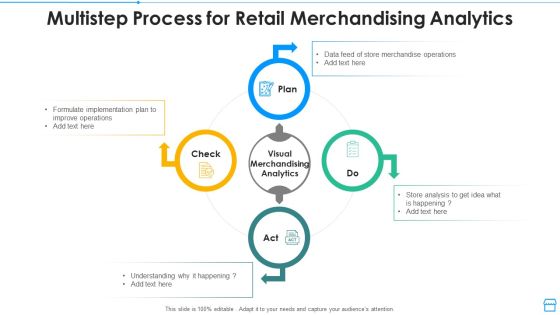
Multistep Process For Retail Merchandising Analytics Themes PDF
Persuade your audience using this multistep process for retail merchandising analytics themes pdf. This PPT design covers four stages, thus making it a great tool to use. It also caters to a variety of topics including check, plan, do, act, visual merchandising analytics. Download this PPT design now to present a convincing pitch that not only emphasizes the topic but also showcases your presentation skills.
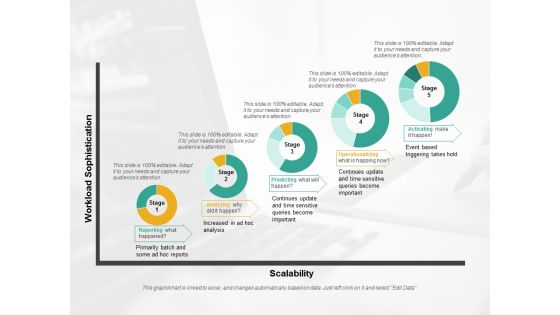
Predictive Analytics Stages Ppt PowerPoint Presentation Infographic Template Structure
This is a predictive analytics stages ppt powerpoint presentation infographic template structure. This is a five stage process. The stages in this process are business, donut chart, finance, marketing, strategy.
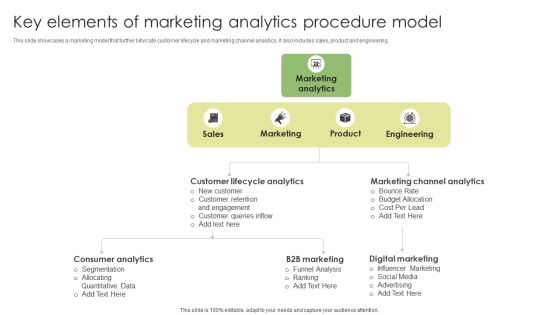
Key Elements Of Marketing Analytics Procedure Model Clipart PDF
This slide showcases a marketing model that further bifurcate customer lifecycle and marketing channel analytics. It also includes sales, product and engineering. Presenting Key Elements Of Marketing Analytics Procedure Model Clipart PDF to dispense important information. This template comprises three stages. It also presents valuable insights into the topics including Sales, Marketing, Engineering. This is a completely customizable PowerPoint theme that can be put to use immediately. So, download it and address the topic impactfully.

Online Content Marketing Metrics And Analytics Model Download PDF
This slide represents content marketing metrics and analytics model. It includes consumption, retention, sharing, engagement, MPI and SPI. Presenting Online Content Marketing Metrics And Analytics Model Download PDF to dispense important information. This template comprises two stages. It also presents valuable insights into the topics including Performance, Operations, Manufacturing. This is a completely customizable PowerPoint theme that can be put to use immediately. So, download it and address the topic impactfully.
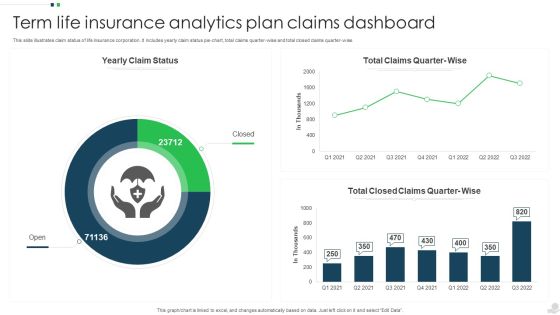
Term Life Insurance Analytics Plan Claims Dashboard Structure PDF
This slide illustrates claim status of life insurance corporation. It includes yearly claim status pie chart, total claims quarter-wise and total closed claims quarter wise. Pitch your topic with ease and precision using this Term Life Insurance Analytics Plan Claims Dashboard Structure PDF. This layout presents information on Insurance Analytics, Plan Claims Dashboard. It is also available for immediate download and adjustment. So, changes can be made in the color, design, graphics or any other component to create a unique layout.
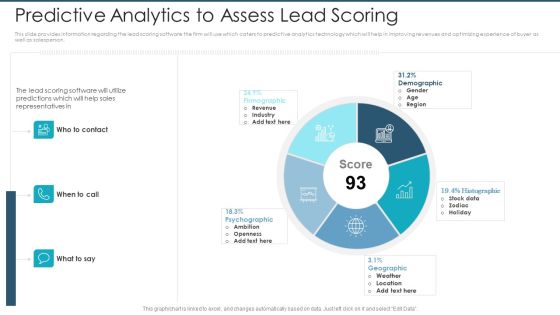
Predictive Analytics To Assess Lead Scoring Structure PDF
This slide provides information regarding the lead scoring software the firm will use which caters to predictive analytics technology which will help in improving revenues and optimizing experience of buyer as well as salesperson. Deliver an awe-inspiring pitch with this creative predictive analytics to assess lead scoring structure pdf. bundle. Topics like revenue, openness, demographic, psychographic, geographic can be discussed with this completely editable template. It is available for immediate download depending on the needs and requirements of the user.

Cross Channel Marketing Communications Initiatives Review Analytics Professional PDF
Measure the results of your marketing campaigns to see how they performed. Measure total spend, CPA and CPC by campaign, CTR, and customer acquisitions from each campaign. Deliver an awe-inspiring pitch with this creative cross channel marketing communications initiatives review analytics professional pdf bundle. Topics like review analytics can be discussed with this completely editable template. It is available for immediate download depending on the needs and requirements of the user.
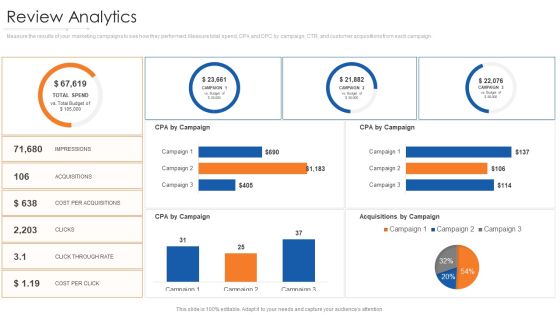
Online Marketing Approach And Execution Review Analytics Brochure PDF
Measure the results of your marketing campaigns to see how they performed. Measure total spend, CPA and CPC by campaign, CTR, and customer acquisitions from each campaign. Deliver and pitch your topic in the best possible manner with this online marketing approach and execution review analytics brochure pdf. Use them to share invaluable insights on review analytics and impress your audience. This template can be altered and modified as per your expectations. So, grab it now.

Advertising On Youtube Platform Youtube Marketing Campaign Analytics Ideas PDF
This slide provides the glimpse of KPI for YouTube marketing campaign which focuses on demographics, location and by age analysis of the video marketing viewers. Deliver an awe inspiring pitch with this creative advertising on youtube platform youtube marketing campaign analytics ideas pdf bundle. Topics like youtube marketing campaign analytics dashboard can be discussed with this completely editable template. It is available for immediate download depending on the needs and requirements of the user.

Dashboard For Data Analytics Implementation Ppt Model Files PDF
This slide depicts the dashboard for data integration in the business, and it is showing real time details about expenses, profits, margins percentage, and new addition projects. Deliver and pitch your topic in the best possible manner with this dashboard for data analytics implementation ppt model files pdf. Use them to share invaluable insights on expenses, profits, analytics, data and impress your audience. This template can be altered and modified as per your expectations. So, grab it now.
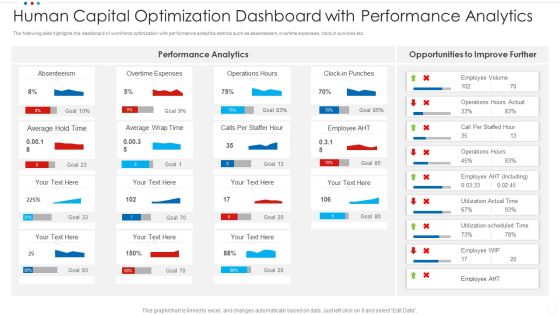
Human Capital Optimization Dashboard With Performance Analytics Infographics PDF
The following slide highlights the dashboard of workforce optimization with performance analytics metrics such as absenteeism, overtime expenses, clock in punches etc. Showcasing this set of slides titled human capital optimization dashboard with performance analytics infographics pdf. The topics addressed in these templates are average, overtime expenses, absenteeism. All the content presented in this PPT design is completely editable. Download it and make adjustments in color, background, font etc. as per your unique business setting.

Data Requirements Dashboard For Social Media Analytics Professional PDF
This slide outlines data requirement dashboard for social media analysis which covers components such as total watch time, total amount of views, unique views, audience retention etc. Showcasing this set of slides titled data requirements dashboard for social media analytics professional pdf. The topics addressed in these templates are data requirements dashboard for social media analytics. All the content presented in this PPT design is completely editable. Download it and make adjustments in color, background, font etc. as per your unique business setting.
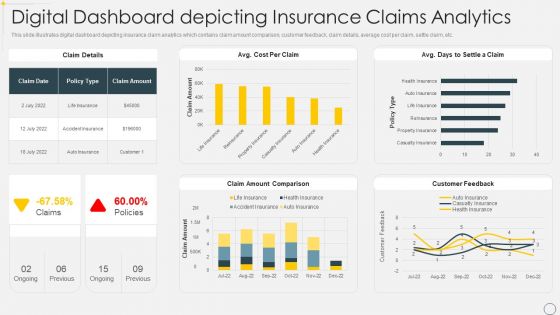
Digital Dashboard Depicting Insurance Claims Analytics Pictures PDF
This slide illustrates digital dashboard depicting insurance claim analytics which contains claim amount comparison, customer feedback, claim details, average cost per claim, settle claim, etc. Showcasing this set of slides titled Digital Dashboard Depicting Insurance Claims Analytics Pictures PDF. The topics addressed in these templates are Policy, Cost, Comparison. All the content presented in this PPT design is completely editable. Download it and make adjustments in color, background, font etc. as per your unique business setting.

Statistics Showing Impact Of Marketing Analytics Tool Background PDF
The purpose of this slide is to outline the various statistics of marketing analytics tool. The statistics are related to customer acquisition, customer retention, social media, segmentation, promotion strategy etc. Showcasing this set of slides titled Statistics Showing Impact Of Marketing Analytics Tool Background PDF. The topics addressed in these templates are Marketing, Organizations, Customers. All the content presented in this PPT design is completely editable. Download it and make adjustments in color, background, font etc. as per your unique business setting.

Talent Acquisition And Recruitment Analytics Dashboard Microsoft PDF
The slide highlights the talent acquisition and recruitment analytics dashboard depicting total application, experience, gender diversity, application type, salary preference, employee details and open positions by department.Showcasing this set of slides titled Talent Acquisition And Recruitment Analytics Dashboard Microsoft PDF The topics addressed in these templates are Highest Experience, Inexperience Candidates, Inexperience Candidates All the content presented in this PPT design is completely editable. Download it and make adjustments in color, background, font etc. as per your unique business setting.

Effective Digital Marketing Audit Process Web Analytics Audit Pictures PDF
This slide highlights the web analytics audit report with website conversation rate, type of website visitors, site traffic website open rate by browser and purchase by device type.Deliver an awe inspiring pitch with this creative Effective Digital Marketing Audit Process Web Analytics Audit Pictures PDF bundle. Topics like Conversion Rate, Website Conversion, Website Visitors can be discussed with this completely editable template. It is available for immediate download depending on the needs and requirements of the user.

Retail Analytics Dashboard To Measure Merchandise Planning Effectiveness Information PDF
This slide shows the retail analytics dashboard to measure merchandise planning effectiveness which includes conversion rate, sell through rate, return on investment, website traffic, abandonment rate, etc. Deliver an awe inspiring pitch with this creative Retail Analytics Dashboard To Measure Merchandise Planning Effectiveness Information PDF bundle. Topics like Return On Investment, Conversation Rate, Rate Of Return can be discussed with this completely editable template. It is available for immediate download depending on the needs and requirements of the user.

Data And Analytics Impact Analysis On Business Slides PDF
This slide covers potential impact of data and analytics on location based services and other sectors. It also includes major barriers to adoption disrupting the process. Pitch your topic with ease and precision using this Data And Analytics Impact Analysis On Business Slides PDF. This layout presents information on Retail, Manufacturing, Location Based Data. It is also available for immediate download and adjustment. So, changes can be made in the color, design, graphics or any other component to create a unique layout.

Forecasted Financial Data Analytics Expansion Trends Slides PDF
This slide shows financial data analytics growth trends till 2029 that highlights geographical distribution of growth among different countries. It include key market players and geographical growth etc. Showcasing this set of slides titled Forecasted Financial Data Analytics Expansion Trends Slides PDF. The topics addressed in these templates are Machine Learning, Projected Growth, Industry. All the content presented in this PPT design is completely editable. Download it and make adjustments in color, background, font etc. as per your unique business setting.

Call Center Kpis Reporting And Analytics Dashboard Download PDF
This slide covers contact center reporting and analytics metrics dashboard. It involves metrics such as total unsuccessful calls, competence, activity, agent details and quality rate. Pitch your topic with ease and precision using this Call Center Kpis Reporting And Analytics Dashboard Download PDF. This layout presents information on Activity, Quality, Dashboard. It is also available for immediate download and adjustment. So, changes can be made in the color, design, graphics or any other component to create a unique layout.

Key Advertising Campaign Statistics For Business Analytics Summary PDF
The following slide exhibits branding campaign statistics. The important elements include- data privacy, racial inequality, healthcare access, climate change, brand popularity, customer experience of goods and services, customization etc. Showcasing this set of slides titled Key Advertising Campaign Statistics For Business Analytics Summary PDF. The topics addressed in these templates are Key Insights, Analytics, Healthcare Access. All the content presented in this PPT design is completely editable. Download it and make adjustments in color, background, font etc. as per your unique business setting.
Global Prescriptive Reductive Analytics Market Ppt PowerPoint Presentation Gallery Template
Presenting this set of slides with name global prescriptive reductive analytics market ppt powerpoint presentation gallery template. This is an editable Powerpoint four stages graphic that deals with topics like global prescriptive reductive analytics market to help convey your message better graphically. This product is a premium product available for immediate download and is 100 percent editable in Powerpoint. Download this now and use it in your presentations to impress your audience.

Workforce Analytics Tools For Employee Enhancement Introduction PDF
This slide represents workforce analytics tool. It includes data visualization, cloud support, real-time data analytics, actionable insights, employee experience, etc. For staff optimization. Are you searching for a Workforce Analytics Tools For Employee Enhancement Introduction PDF that is uncluttered, straightforward, and original Its easy to edit, and you can change the colors to suit your personal or business branding. For a presentation that expresses how much effort you have put in, this template is ideal With all of its features, including tables, diagrams, statistics, and lists, its perfect for a business plan presentation. Make your ideas more appealing with these professional slides. Download Workforce Analytics Tools For Employee Enhancement Introduction PDF from Slidegeeks today.
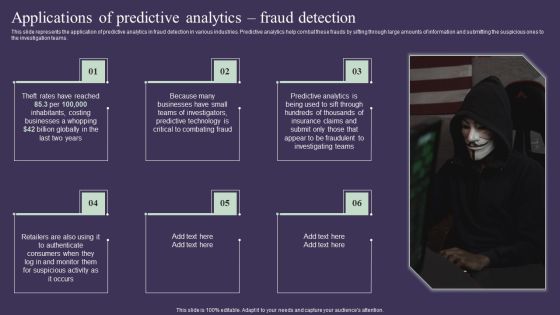
Projection Model Applications Of Predictive Analytics Fraud Detection Information PDF
This slide represents the application of predictive analytics in fraud detection in various industries. Predictive analytics help combat these frauds by sifting through large amounts of information and submitting the suspicious ones to the investigation teams. Whether you have daily or monthly meetings, a brilliant presentation is necessary. Projection Model Applications Of Predictive Analytics Fraud Detection Information PDF can be your best option for delivering a presentation. Represent everything in detail using Projection Model Applications Of Predictive Analytics Fraud Detection Information PDF and make yourself stand out in meetings. The template is versatile and follows a structure that will cater to your requirements. All the templates prepared by Slidegeeks are easy to download and edit. Our research experts have taken care of the corporate themes as well. So, give it a try and see the results.

Predictive Data Model How Businesses Use Predictive Analytics Topics PDF
This slide depicts the importance of predictive analytics that covers detecting fraud, improving operations, optimizing marketing campaigns, and reducing risks. Predictive analytics is being used by businesses to fix complex challenges and identify new possibilities. Whether you have daily or monthly meetings, a brilliant presentation is necessary. Predictive Data Model How Businesses Use Predictive Analytics Topics PDF can be your best option for delivering a presentation. Represent everything in detail using Predictive Data Model How Businesses Use Predictive Analytics Topics PDF and make yourself stand out in meetings. The template is versatile and follows a structure that will cater to your requirements. All the templates prepared by Slidegeeks are easy to download and edit. Our research experts have taken care of the corporate themes as well. So, give it a try and see the results.

Five Years Business Analytics Analyst Career Roadmap Download
We present our five years business analytics analyst career roadmap download. This PowerPoint layout is easy-to-edit so you can change the font size, font type, color, and shape conveniently. In addition to this, the PowerPoint layout is Google Slides compatible, so you can share it with your audience and give them access to edit it. Therefore, download and save this well-researched five years business analytics analyst career roadmap download in different formats like PDF, PNG, and JPG to smoothly execute your business plan.

Half Yearly Business Analytics Analyst Career Roadmap Infographics
We present our half yearly business analytics analyst career roadmap infographics. This PowerPoint layout is easy-to-edit so you can change the font size, font type, color, and shape conveniently. In addition to this, the PowerPoint layout is Google Slides compatible, so you can share it with your audience and give them access to edit it. Therefore, download and save this well-researched half yearly business analytics analyst career roadmap infographics in different formats like PDF, PNG, and JPG to smoothly execute your business plan.
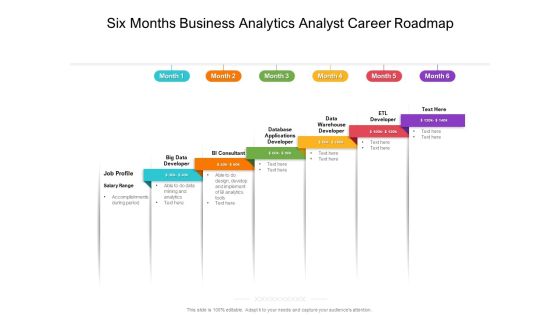
Six Months Business Analytics Analyst Career Roadmap Rules
We present our six months business analytics analyst career roadmap rules. This PowerPoint layout is easy-to-edit so you can change the font size, font type, color, and shape conveniently. In addition to this, the PowerPoint layout is Google Slides compatible, so you can share it with your audience and give them access to edit it. Therefore, download and save this well-researched six months business analytics analyst career roadmap rules in different formats like PDF, PNG, and JPG to smoothly execute your business plan.
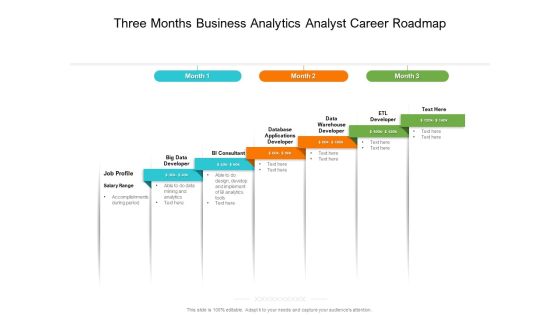
Three Months Business Analytics Analyst Career Roadmap Topics
We present our three months business analytics analyst career roadmap topics. This PowerPoint layout is easy-to-edit so you can change the font size, font type, color, and shape conveniently. In addition to this, the PowerPoint layout is Google Slides compatible, so you can share it with your audience and give them access to edit it. Therefore, download and save this well-researched three months business analytics analyst career roadmap topics in different formats like PDF, PNG, and JPG to smoothly execute your business plan.

Benefits Of Data Analytics Strategy For Internal Audit Introduction PDF
This slide covers top benefits of data analytics in internal auditing. It includes risk management, greater assurance, enhanced efficiency, clear reporting and improved audit quality. Presenting Benefits Of Data Analytics Strategy For Internal Audit Introduction PDF to dispense important information. This template comprises five stages. It also presents valuable insights into the topics including Enhanced Efficiency, Risk Management, Greater Assurance. This is a completely customizable PowerPoint theme that can be put to use immediately. So, download it and address the topic impactfully.

Applications Of Healthcare In Data Analytics Information PDF
This slide showcases the uses of data analytics in healthcare. It includes benefits such as improved medical research, new drug development and automatic administrative processes. Presenting Applications Of Healthcare In Data Analytics Information PDF to dispense important information. This template comprises Five stages. It also presents valuable insights into the topics including Drug Discovery, Disease Prevention, Post Care Monitoring. This is a completely customizable PowerPoint theme that can be put to use immediately. So, download it and address the topic impactfully.

Data Analytics Healthcare For Hospital Administration Clipart PDF
This slide showcases the advantages of data analytics in healthcare. It includes benefits such as improved medical research, new drug development and automatic administrative processes. Presenting Data Analytics Healthcare For Hospital Administration Clipart PDF to dispense important information. This template comprises Seven stages. It also presents valuable insights into the topics including Clinical Decision Support, Secure Clinical Trials, Process Improvement. This is a completely customizable PowerPoint theme that can be put to use immediately. So, download it and address the topic impactfully.

Business Intelligence To Overcome Marketing Analytics Challenges Mockup PDF
The following slide presents various solutions given by business intelligence to overcome marketing analytics challenges. The challenges related to information, filtration, data, interpretation, security and campaign testing. Presenting Business Intelligence To Overcome Marketing Analytics Challenges Mockup PDF to dispense important information. This template comprises four stages. It also presents valuable insights into the topics including Information Filtration, Data Interpretation, Security. This is a completely customizable PowerPoint theme that can be put to use immediately. So, download it and address the topic impactfully.

Big Data Ecosystem And Application Analytics Guidelines PDF
Presenting big data ecosystem and application analytics guidelines pdf to dispense important information. This template comprises two stages. It also presents valuable insights into the topics including big data ecosystem, analytic applications, data sources. This is a completely customizable PowerPoint theme that can be put to use immediately. So, download it and address the topic impactfully.

Phases Of Data Analytics Operationalize Ppt Pictures Files PDF
This slide describes the operational phase of data science and what tasks are performed in this phase, such as deliver final reports, pilot project implementation, and how it will be helpful in monitoring performance. Presenting phases of data analytics operationalize ppt pictures files pdf to provide visual cues and insights. Share and navigate important information on three stages that need your due attention. This template can be used to pitch topics like phases of data analytics operationalize. In addtion, this PPT design contains high resolution images, graphics, etc, that are easily editable and available for immediate download.
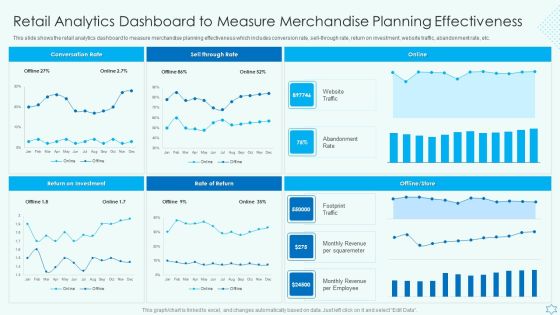
Retail Analytics Dashboard To Measure Merchandise Planning Effectiveness Diagrams PDF
This slide shows the retail analytics dashboard to measure merchandise planning effectiveness which includes conversion rate, sell through rate, return on investment, website traffic, abandonment rate, etc. Are you searching for a Retail Analytics Dashboard To Measure Merchandise Planning Effectiveness Diagrams PDF that is uncluttered, straightforward, and original Its easy to edit, and you can change the colors to suit your personal or business branding. For a presentation that expresses how much effort you have put in, this template is ideal With all of its features, including tables, diagrams, statistics, and lists, its perfect for a business plan presentation. Make your ideas more appealing with these professional slides. Download Retail Analytics Dashboard To Measure Merchandise Planning Effectiveness Diagrams PDF from Slidegeeks today.

Predictive Data Model Lifecycle Of Predictive Analytics Model Diagrams PDF
This slide depicts the lifecycle of the predictive analytics model, and it includes highlighting and formulating a problem, data preparation, information exploration, transforming and choosing, making, validating, and deploying a model, and then evaluating and monitoring results. If you are looking for a format to display your unique thoughts, then the professionally designed Predictive Data Model Lifecycle Of Predictive Analytics Model Diagrams PDF is the one for you. You can use it as a Google Slides template or a PowerPoint template. Incorporate impressive visuals, symbols, images, and other charts. Modify or reorganize the text boxes as you desire. Experiment with shade schemes and font pairings. Alter, share or cooperate with other people on your work. Download Predictive Data Model Lifecycle Of Predictive Analytics Model Diagrams PDF and find out how to give a successful presentation. Present a perfect display to your team and make your presentation unforgettable.

Manpower Analytics For Addressing Human Capital Challenges Diagrams PDF
This slide illustrates role of workforce data analytics for resolving human capital challenges. It includes developing training strategies, retain talent in organisation, work performance evaluation, strategies for redeployment, understanding collaboration and knowledge sharing. Showcasing this set of slides titled Manpower Analytics For Addressing Human Capital Challenges Diagrams PDF. The topics addressed in these templates are Gap Indicates, Training Strategies, Evaluation Performance. All the content presented in this PPT design is completely editable. Download it and make adjustments in color, background, font etc. as per your unique business setting.
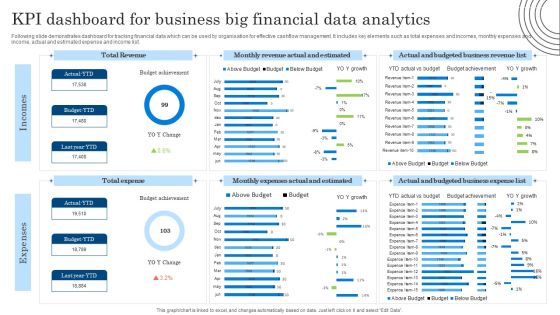
KPI Dashboard For Business Big Financial Data Analytics Diagrams PDF
Following slide demonstrates dashboard for tracking financial data which can be used by organisation for effective cashflow management. It includes key elements such as total expenses and incomes, monthly expenses and income, actual and estimated expense and income list. Showcasing this set of slides titled KPI Dashboard For Business Big Financial Data Analytics Diagrams PDF. The topics addressed in these templates are KPI Dashboard, Business Big Financial, Data Analytics. All the content presented in this PPT design is completely editable. Download it and make adjustments in color, background, font etc. as per your unique business setting.
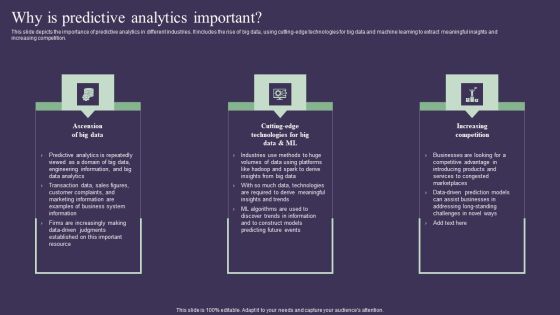
Projection Model Why Is Predictive Analytics Important Diagrams PDF
This slide depicts the importance of predictive analytics in different industries. It includes the rise of big data, using cutting-edge technologies for big data and machine learning to extract meaningful insights and increasing competition. Create an editable Projection Model Why Is Predictive Analytics Important Diagrams PDF that communicates your idea and engages your audience. Whether you are presenting a business or an educational presentation, pre-designed presentation templates help save time. Projection Model Why Is Predictive Analytics Important Diagrams PDF is highly customizable and very easy to edit, covering many different styles from creative to business presentations. Slidegeeks has creative team members who have crafted amazing templates. So, go and get them without any delay.

Predictive Analytics Three Months Roadmap For Enhancing Marketing Effectiveness Themes
We present our predictive analytics three months roadmap for enhancing marketing effectiveness themes. This PowerPoint layout is easy to edit so you can change the font size, font type, color, and shape conveniently. In addition to this, the PowerPoint layout is Google Slides compatible, so you can share it with your audience and give them access to edit it. Therefore, download and save this well researched predictive analytics three months roadmap for enhancing marketing effectiveness themes in different formats like PDF, PNG, and JPG to smoothly execute your business plan.

Dashboard Depicting Sales And Customer Analytics Infographics PDF
This slide focuses on dashboard that depicts sales and customer analytics which covers sales revenue, average transaction rate, out of stock items, sales by division, monthly visitors, etc. If you are looking for a format to display your unique thoughts, then the professionally designed Dashboard Depicting Sales And Customer Analytics Infographics PDF is the one for you. You can use it as a Google Slides template or a PowerPoint template. Incorporate impressive visuals, symbols, images, and other charts. Modify or reorganize the text boxes as you desire. Experiment with shade schemes and font pairings. Alter, share or cooperate with other people on your work. Download Dashboard Depicting Sales And Customer Analytics Infographics PDF and find out how to give a successful presentation. Present a perfect display to your team and make your presentation unforgettable.
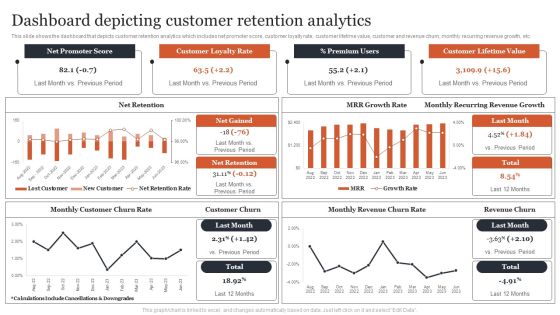
Managing Customer Attrition Dashboard Depicting Customer Retention Analytics Formats PDF
This slide shows the dashboard that depicts customer retention analytics which includes net promoter score, customer loyalty rate, customer lifetime value, customer and revenue churn, monthly recurring revenue growth, etc. Get a simple yet stunning designed Managing Customer Attrition Dashboard Depicting Customer Retention Analytics Formats PDF. It is the best one to establish the tone in your meetings. It is an excellent way to make your presentations highly effective. So, download this PPT today from Slidegeeks and see the positive impacts. Our easy-to-edit Managing Customer Attrition Dashboard Depicting Customer Retention Analytics Formats PDF can be your go-to option for all upcoming conferences and meetings. So, what are you waiting for Grab this template today.

KPI Dashboard For Monitoring Recruitment Analytics Professional PDF
The slide depicts the dashboard of recruitment analytics monitoring depicting candidate by source, candidate workflow, candidate status, new application, application source vs hired and reasons for decline. Do you have to make sure that everyone on your team knows about any specific topic I yes, then you should give KPI Dashboard For Monitoring Recruitment Analytics Professional PDF a try. Our experts have put a lot of knowledge and effort into creating this impeccable KPI Dashboard For Monitoring Recruitment Analytics Professional PDF. You can use this template for your upcoming presentations, as the slides are perfect to represent even the tiniest detail. You can download these templates from the Slidegeeks website and these are easy to edit. So grab these today.

Website Analytics Dashboard For Consumer Data Insights Template PDF
This slide showcases dashboard for website analytics that can help organization to gather data about visitors and formulate targeted marketing campaigns. It can also help to make individual and group buyer personas Here you can discover an assortment of the finest PowerPoint and Google Slides templates. With these templates, you can create presentations for a variety of purposes while simultaneously providing your audience with an eye-catching visual experience. Download Website Analytics Dashboard For Consumer Data Insights Template PDF to deliver an impeccable presentation. These templates will make your job of preparing presentations much quicker, yet still, maintain a high level of quality. Slidegeeks has experienced researchers who prepare these templates and write high-quality content for you. Later on, you can personalize the content by editing the Website Analytics Dashboard For Consumer Data Insights Template PDF.

Predictive Data Model Working Of Predictive Analytics Models Pictures PDF
This slide depicts the working of predictive analytics models that operates iteratively. The main phases in working include business understanding, data understanding, data preparation, modeling, evaluation, and deployment. Formulating a presentation can take up a lot of effort and time, so the content and message should always be the primary focus. The visuals of the PowerPoint can enhance the presenters message, so our Predictive Data Model Working Of Predictive Analytics Models Pictures PDF was created to help save time. Instead of worrying about the design, the presenter can concentrate on the message while our designers work on creating the ideal templates for whatever situation is needed. Slidegeeks has experts for everything from amazing designs to valuable content, we have put everything into Predictive Data Model Working Of Predictive Analytics Models Pictures PDF

Big Data And Analytics Integration Architecture Themes PDF
The purpose of this slide is to highlight the strategic model along with various tools and techniques to store and extract big data and analytics. The major components include web applications, external databases, cloud computing, big data storage etc. Showcasing this set of slides titled Big Data And Analytics Integration Architecture Themes PDF. The topics addressed in these templates are Data Discovery Platform, Big Data Storage, Enterprise Database. All the content presented in this PPT design is completely editable. Download it and make adjustments in color, background, font etc. as per your unique business setting.

Service Price Matrix For Big Data Analytics Themes PDF
This slide includes various data management services which can be used by companies to build competitive advantage. It includes services such as data migration, data integration, data security, data analytics and data quality management. Pitch your topic with ease and precision using this Service Price Matrix For Big Data Analytics Themes PDF. This layout presents information on Assessment Of Business, Financial Data, Data Quality Management. It is also available for immediate download and adjustment. So, changes can be made in the color, design, graphics or any other component to create a unique layout.

Big Data And Analytics Framework Implementation Challenges Themes PDF
This slide provide information about various challenges faced while implementing big data and analytics architecture in organization along with its solutions. It includes challenges such as complexity, skillset, technology maturity and security Pitch your topic with ease and precision using this Big Data And Analytics Framework Implementation Challenges Themes PDF. This layout presents information on Challenges, Description, Solutions . It is also available for immediate download and adjustment. So, changes can be made in the color, design, graphics or any other component to create a unique layout.

Predictive Data Model Predictive Analytics Forecast Model Introduction Themes PDF
This slide outlines the introduction of the forecast model used for predictive analytics to make the metric value predictions for business processes. This model uses the Prophet algorithm to make predictions and includes its use cases in the manufacturing industry. The best PPT templates are a great way to save time, energy, and resources. Slidegeeks have 100 percent editable powerpoint slides making them incredibly versatile. With these quality presentation templates, you can create a captivating and memorable presentation by combining visually appealing slides and effectively communicating your message. Download Predictive Data Model Predictive Analytics Forecast Model Introduction Themes PDF from Slidegeeks and deliver a wonderful presentation.

Change Management Communication Plan For Data Analytics Project Topics PDF
Here, we are describing the communication plan of implementing the change in data analytics project. It includes sections such as designated leader who support the change, respective departments and key actions for rationalizing the change in the process. If you are looking for a format to display your unique thoughts, then the professionally designed Change Management Communication Plan For Data Analytics Project Topics PDF is the one for you. You can use it as a Google Slides template or a PowerPoint template. Incorporate impressive visuals, symbols, images, and other charts. Modify or reorganize the text boxes as you desire. Experiment with shade schemes and font pairings. Alter, share or cooperate with other people on your work. Download Change Management Communication Plan For Data Analytics Project Topics PDF and find out how to give a successful presentation. Present a perfect display to your team and make your presentation unforgettable.

Projection Model Training Program For Predictive Analytics Model Sample PDF
This slide represents the training program for the predictive analytics model, and it includes the name of teams, trainer names, modules to be covered in training, and the schedule and venue of the training. If you are looking for a format to display your unique thoughts, then the professionally designed Projection Model Training Program For Predictive Analytics Model Sample PDF is the one for you. You can use it as a Google Slides template or a PowerPoint template. Incorporate impressive visuals, symbols, images, and other charts. Modify or reorganize the text boxes as you desire. Experiment with shade schemes and font pairings. Alter, share or cooperate with other people on your work. Download Projection Model Training Program For Predictive Analytics Model Sample PDF and find out how to give a successful presentation. Present a perfect display to your team and make your presentation unforgettable.

Predictive Data Model Uses Of Predictive Analytics Credit Information PDF
This slide describes the usage of predictive analytics in banking and other financial institutions for credit purposes. It is used to calculate the credit score of a person or organization and to ensure that borrower doesnot fail to return the loan. If you are looking for a format to display your unique thoughts, then the professionally designed Predictive Data Model Uses Of Predictive Analytics Credit Information PDF is the one for you. You can use it as a Google Slides template or a PowerPoint template. Incorporate impressive visuals, symbols, images, and other charts. Modify or reorganize the text boxes as you desire. Experiment with shade schemes and font pairings. Alter, share or cooperate with other people on your work. Download Predictive Data Model Uses Of Predictive Analytics Credit Information PDF and find out how to give a successful presentation. Present a perfect display to your team and make your presentation unforgettable.

Applications Of Data Analytics In Medical Administration Diagrams PDF
The following slide depicts the implementation of data analytics in medical management to convert data into more useful insights. It constitutes of activities such as researching remedy for severe diseases, enhancing patient documents, furnishing telehealth services etc.Showcasing this set of slides titled Applications Of Data Analytics In Medical Administration Diagrams PDF. The topics addressed in these templates are Severe Diseases, Furnish Telehealth, Patient Documentation. All the content presented in this PPT design is completely editable. Download it and make adjustments in color, background, font etc. as per your unique business setting.
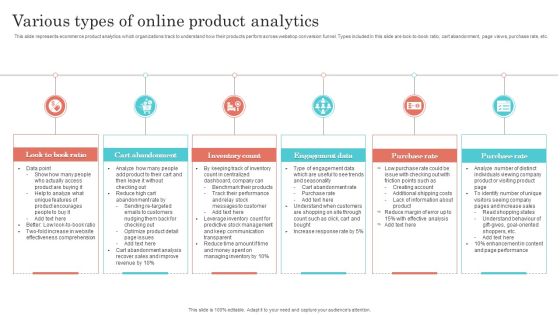
Various Types Of Online Product Analytics Diagrams PDF
This slide represents ecommerce product analytics which organizations track to understand how their products perform across webshop conversion funnel. Types included in this slide are look-to-book ratio, cart abandonment, page views, purchase rate, etc. Persuade your audience using this Various Types Of Online Product Analytics Diagrams PDF. This PPT design covers six stages, thus making it a great tool to use. It also caters to a variety of topics including Cart Abandonment, Inventory Count, Engagement Data. Download this PPT design now to present a convincing pitch that not only emphasizes the topic but also showcases your presentation skills.
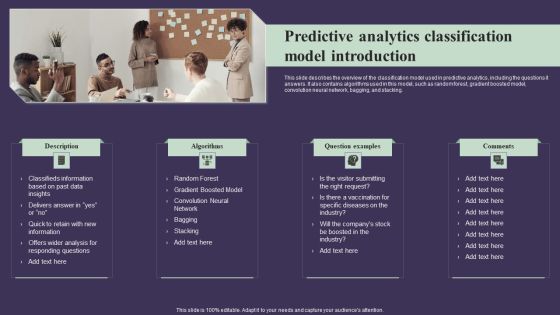
Projection Model Predictive Analytics Classification Model Introduction Rules PDF
This slide describes the overview of the classification model used in predictive analytics, including the questions it answers. It also contains algorithms used in this model, such as random forest, gradient boosted model, convolution neural network, bagging, and stacking.Are you searching for a Projection Model Predictive Analytics Classification Model Introduction Rules PDF that is uncluttered, straightforward, and original Its easy to edit, and you can change the colors to suit your personal or business branding. For a presentation that expresses how much effort you have put in, this template is ideal With all of its features, including tables, diagrams, statistics, and lists, its perfect for a business plan presentation. Make your ideas more appealing with these professional slides. Download Projection Model Predictive Analytics Classification Model Introduction Rules PDF from Slidegeeks today.

Roles And Responsibilities Of Marketing Analytics Team Mockup PDF
The purpose of this slide is to showcase major roles of strategist, influencer, data scientist, analyst, data engineer and solution design. Company can track and optimize the campaign performance by hiring above mentioned members in the marketing analytics team. Presenting Roles And Responsibilities Of Marketing Analytics Team Mockup PDF to dispense important information. This template comprises four stages. It also presents valuable insights into the topics including Business Strategy, Technical Expertise, Technology Strategy. This is a completely customizable PowerPoint theme that can be put to use immediately. So, download it and address the topic impactfully.

Sap Analytics Cloud Training Plan For Organization Employees Slides PDF
The purpose of this slide is to showcase the training plan for SAP Analytics Cloud coaching. It contains information regarding the basic perquisite, trainer name and number of attendees. It also contains details of training modules along with hours allocated, expected completion date. Whether you have daily or monthly meetings, a brilliant presentation is necessary. Sap Analytics Cloud Training Plan For Organization Employees Slides PDF can be your best option for delivering a presentation. Represent everything in detail using Sap Analytics Cloud Training Plan For Organization Employees Slides PDF and make yourself stand out in meetings. The template is versatile and follows a structure that will cater to your requirements. All the templates prepared by Slidegeeks are easy to download and edit. Our research experts have taken care of the corporate themes as well. So, give it a try and see the results.

Projection Model Time Series Model Of Predictive Analytics Designs PDF
This slide talks about the time series model of predictive analytics that makes future outcome predictions by taking time as input. This model can be implemented in customer support services and healthcare industries to predict the expected number of queries or patients. Whether you have daily or monthly meetings, a brilliant presentation is necessary. Projection Model Time Series Model Of Predictive Analytics Designs PDF can be your best option for delivering a presentation. Represent everything in detail using Projection Model Time Series Model Of Predictive Analytics Designs PDF and make yourself stand out in meetings. The template is versatile and follows a structure that will cater to your requirements. All the templates prepared by Slidegeeks are easy to download and edit. Our research experts have taken care of the corporate themes as well. So, give it a try and see the results.
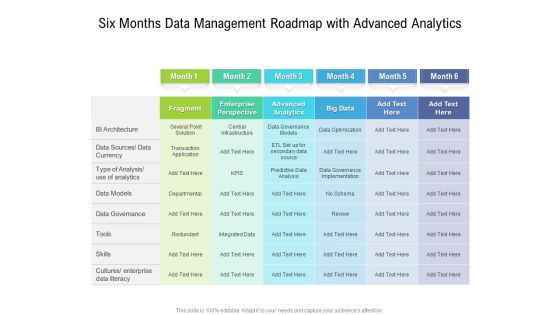
Six Months Data Management Roadmap With Advanced Analytics Information
We present our six months data management roadmap with advanced analytics information. This PowerPoint layout is easy-to-edit so you can change the font size, font type, color, and shape conveniently. In addition to this, the PowerPoint layout is Google Slides compatible, so you can share it with your audience and give them access to edit it. Therefore, download and save this well-researched six months data management roadmap with advanced analytics information in different formats like PDF, PNG, and JPG to smoothly execute your business plan.

Country Wise Recruitment Analytics From Social Media Platforms Clipart PDF
This slide covers the important social media practices to be used to increase candidates hiring rates. It includes making it professional, highlight oneself, keep balance, build connection and networks. Showcasing this set of slides titled country wise recruitment analytics from social media platforms clipart pdf. The topics addressed in these templates are country wise recruitment analytics from social media platforms. All the content presented in this PPT design is completely editable. Download it and make adjustments in color, background, font etc. as per your unique business setting.
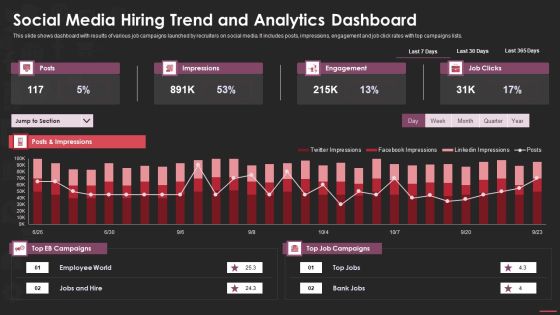
Social Media Hiring Trend And Analytics Dashboard Microsoft PDF
This slide shows dashboard with results of various job campaigns launched by recruiters on social media. It includes posts, impressions, engagement and job click rates with top campaigns lists. Pitch your topic with ease and precision using this social media hiring trend and analytics dashboard microsoft pdf. This layout presents information on social media hiring trend and analytics dashboard. It is also available for immediate download and adjustment. So, changes can be made in the color, design, graphics or any other component to create a unique layout.

Smartphone App Analytics Dashboard With Average Daily Users Microsoft PDF
This slide showcases dashboard that can help organization to analyse the daily active users and traffic generated from mobile application. Its key components daily users trend, installs by country, installs by source and daily active users by device. Showcasing this set of slides titled Smartphone App Analytics Dashboard With Average Daily Users Microsoft PDF. The topics addressed in these templates are Smartphone App Analytics Dashboard With Average Daily Users. All the content presented in this PPT design is completely editable. Download it and make adjustments in color, background, font etc. as per your unique business setting.

Insurance Analytics Corporation Clients Claims Dashboard Summary PDF
This slide illustrates clients claim status statistics of a insurance corporation. It includes total claims, monthly claims, claims amount by type, percentage of claims, denied and received claims line graph. Showcasing this set of slides titled Insurance Analytics Corporation Clients Claims Dashboard Summary PDF. The topics addressed in these templates are Insurance Analytics Corporation, Clients Claims Dashboard. All the content presented in this PPT design is completely editable. Download it and make adjustments in color, background, font etc. as per your unique business setting.

Insurance Analytics Corporation Sales Insights Dashboard Structure PDF
This slide illustrates facts and figures in relation to sales and overall policy status. It includes total policies and premiums in current and previous year, quarterly premium revenue and monthly policy status. Pitch your topic with ease and precision using this Insurance Analytics Corporation Sales Insights Dashboard Structure PDF. This layout presents information on Quarterly Premium Revenue, Sales Insights Dashboard, Insurance Analytics Corporation. It is also available for immediate download and adjustment. So, changes can be made in the color, design, graphics or any other component to create a unique layout.
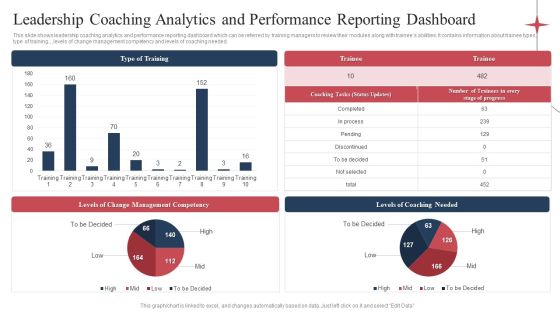
Leadership Coaching Analytics And Performance Reporting Dashboard Demonstration PDF
This slide shows leadership coaching analytics and performance reporting dashboard which can be referred by training managers to review their modules along with trainees abilities. It contains information about trainee types, type of training., ,levels of change management competency and levels of coaching needed. Pitch your topic with ease and precision using this Leadership Coaching Analytics And Performance Reporting Dashboard Demonstration PDF. This layout presents information on Levels Coaching Needed, Levels Change Management, Type Training. It is also available for immediate download and adjustment. So, changes can be made in the color, design, graphics or any other component to create a unique layout.
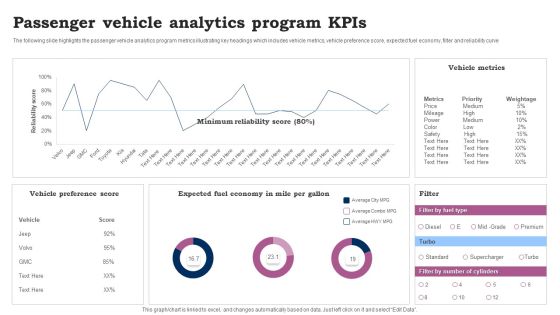
Passenger Vehicle Analytics Program Kpis Ppt Pictures Demonstration PDF
The following slide highlights the passenger vehicle analytics program metrics illustrating key headings which includes vehicle metrics, vehicle preference score, expected fuel economy, filter and reliability curve. Showcasing this set of slides titled Passenger Vehicle Analytics Program Kpis Ppt Pictures Demonstration PDF. The topics addressed in these templates are Vehicle Preference Score, Vehicle Metrics, Expected Fuel Economy. All the content presented in this PPT design is completely editable. Download it and make adjustments in color, background, font etc. as per your unique business setting.

Retail Analytics Dashboard To Measure Merchandise Planning Effectiveness Microsoft PDF
This slide shows the retail analytics dashboard to measure merchandise planning effectiveness which includes conversion rate, sell through rate, return on investment, website traffic, abandonment rate, etc. Make sure to capture your audiences attention in your business displays with our gratis customizable Retail Analytics Dashboard To Measure Merchandise Planning Effectiveness Microsoft PDF. These are great for business strategies, office conferences, capital raising or task suggestions. If you desire to acquire more customers for your tech business and ensure they stay satisfied, create your own sales presentation with these plain slides.

Dashboard Depicting Sales And Customer Analytics Professional PDF
This slide focuses on dashboard that depicts sales and customer analytics which covers sales revenue, average transaction rate, out of stock items, sales by division, monthly visitors, etc. Make sure to capture your audiences attention in your business displays with our gratis customizable Dashboard Depicting Sales And Customer Analytics Professional PDF. These are great for business strategies, office conferences, capital raising or task suggestions. If you desire to acquire more customers for your tech business and ensure they stay satisfied, create your own sales presentation with these plain slides.

Retail Analytics Dashboard To Measure Merchandise Planning Effectiveness Designs PDF
Do you have to make sure that everyone on your team knows about any specific topic I yes, then you should give Retail Analytics Dashboard To Measure Merchandise Planning Effectiveness Designs PDF a try. Our experts have put a lot of knowledge and effort into creating this impeccable Retail Analytics Dashboard To Measure Merchandise Planning Effectiveness Designs PDF. You can use this template for your upcoming presentations, as the slides are perfect to represent even the tiniest detail. You can download these templates from the Slidegeeks website and these are easy to edit. So grab these today.

Business Revenue And Client Retention Analytics Dashboard Brochure PDF
This slide shows dashboard of service department of firm to make business decisions using customer analytics and covers essential KPIs of customer. It includes request answered, revenue, support cost, customer satisfaction and retention, average time to solve issue. Showcasing this set of slides titled Business Revenue And Client Retention Analytics Dashboard Brochure PDF. The topics addressed in these templates are Customer Satisfaction, Customer Retention, Revenue. All the content presented in this PPT design is completely editable. Download it and make adjustments in color, background, font etc. as per your unique business setting.

Dashboard For Big Healthcare Data Analytics Graphics PDF
This slide showcase the dashboard for big data analytics in healthcare. It includes elements such as bed occupancy rate, patient turnover rate, efficiency and costs, missed and cancelled appointment rate. Showcasing this set of slides titled Dashboard For Big Healthcare Data Analytics Graphics PDF. The topics addressed in these templates are Satisfaction Service Indicators, Occupancy, Forecasted Patient Turnover. All the content presented in this PPT design is completely editable. Download it and make adjustments in color, background, font etc. as per your unique business setting.
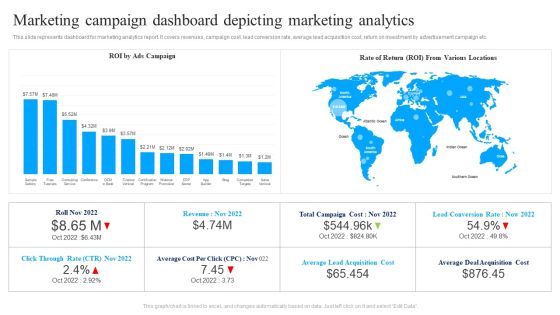
Marketing Campaign Dashboard Depicting Marketing Analytics Ppt Summary Infographics PDF
This slide represents dashboard for marketing analytics report. It covers revenues, campaign cost, lead conversion rate, average lead acquisition cost, return on investment by advertisement campaign etc. Pitch your topic with ease and precision using this Marketing Campaign Dashboard Depicting Marketing Analytics Ppt Summary Infographics PDF. This layout presents information on ROI Ads Campaign, Rate Of Return, Various Locations. It is also available for immediate download and adjustment. So, changes can be made in the color, design, graphics or any other component to create a unique layout.
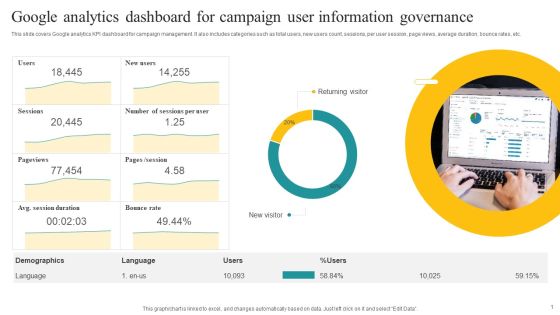
Google Analytics Dashboard For Campaign User Information Governance Demonstration PDF
This slide covers Google analytics KPI dashboard for campaign management. It also includes categories such as total users, new users count, sessions, per user session, page views, average duration, bounce rates, etc. Showcasing this set of slides titled Google Analytics Dashboard For Campaign User Information Governance Demonstration PDF. The topics addressed in these templates are Returning Visitor, New Visitor, Demographics. All the content presented in this PPT design is completely editable. Download it and make adjustments in color, background, font etc. as per your unique business setting.

Analytics Procedure Dashboard With Start Trend And Summary Infographics PDF
This slide showcases a dashboard of analytics process to guide organizations upstream root cause and plan actions to avoid issues in future. It covers essential KPIs such as total and active process, average duration, participants, active tasks, errors, trend and summary. Showcasing this set of slides titled Analytics Procedure Dashboard With Start Trend And Summary Infographics PDF. The topics addressed in these templates are Procedure Status, Average Duration, Active Tasks. All the content presented in this PPT design is completely editable. Download it and make adjustments in color, background, font etc. as per your unique business setting.

Marketing Analytics Measurement Procedure With Success Rate Guidelines PDF
This slide showcases performance indicators of marketing required by organizations to analyze data to reach a end goals. Key metrics included are attributing social and content to revenue, aligning business goal and marketing, conversion of leads to revenue and data collection and analysis. Showcasing this set of slides titled Marketing Analytics Measurement Procedure With Success Rate Guidelines PDF. The topics addressed in these templates areMarketing Analytics Measurement, Procedure With Success Rate. All the content presented in this PPT design is completely editable. Download it and make adjustments in color, background, font etc. as per your unique business setting.

Cloud Data Transformation Dashboard For Application Analytics Information PDF
This slide shows data migration best practices dashboard for application analytics. It includes information about software as a service applications, app workload analysis, migration details, document, business unit. Pitch your topic with ease and precision using this Cloud Data Transformation Dashboard For Application Analytics Information PDF. This layout presents information on Software Service Applications, App Workload Analysis, Migration Details. It is also available for immediate download and adjustment. So, changes can be made in the color, design, graphics or any other component to create a unique layout.

Website Analytics Dashboard To Track Business Performance Guidelines PDF
This slide exhibits visual report to track web performance metrics such as bounce rates, conversion rate, etc. It focuses on visualizing how effectively any website is converting traffic. It involves information related to number of users, page visitors, etc. Pitch your topic with ease and precision using this Website Analytics Dashboard To Track Business Performance Guidelines PDF. This layout presents information on Website Analytics, Dashboard To Track, Business Performance. It is also available for immediate download and adjustment. So, changes can be made in the color, design, graphics or any other component to create a unique layout.

Website Analytics Dashboard For Consumer Data Insights Clipart PDF
This slide showcases dashboard for website analytics that can help organization to gather data about visitors and formulate targeted marketing campaigns. It can also help to make individual and group buyer personas. Want to ace your presentation in front of a live audience Our Website Analytics Dashboard For Consumer Data Insights Clipart PDF can help you do that by engaging all the users towards you.. Slidegeeks experts have put their efforts and expertise into creating these impeccable powerpoint presentations so that you can communicate your ideas clearly. Moreover, all the templates are customizable, and easy-to-edit and downloadable. Use these for both personal and commercial use.

Analytics Dashboard To Track Server Administrators Services Demonstration PDF
This slide showcases analytics and consumption software dashboard for business to keep track of their servers and downloads. It presents information related to security alerts, updates, expiring contracts, cases, etc. Showcasing this set of slides titled Analytics Dashboard To Track Server Administrators Services Demonstration PDF. The topics addressed in these templates are Expiring Contracts, Security Updates, Required. All the content presented in this PPT design is completely editable. Download it and make adjustments in color, background, font etc. as per your unique business setting.

Procurement Data Analytics And Business Intelligence Dashboard Pictures PDF
This slide showcases BI dashboard to help company in real time tracking of procurement KPIs. It includes information such as defect rate, supplier availability, lead time, etc. Pitch your topic with ease and precision using this Procurement Data Analytics And Business Intelligence Dashboard Pictures PDF. This layout presents information on Procurement Data Analytics, Business Intelligence Dashboard. It is also available for immediate download and adjustment. So, changes can be made in the color, design, graphics or any other component to create a unique layout.
Projection Model Predictive Analytics Model Performance Tracking Dashboard Microsoft PDF
This slide represents the predictive analytics model performance tracking dashboard, and it covers the details of total visitors, total buyers, total products added to the cart, filters by date and category, visitors to clients conversion rate, and so on. Find a pre-designed and impeccable Projection Model Predictive Analytics Model Performance Tracking Dashboard Microsoft PDF. The templates can ace your presentation without additional effort. You can download these easy-to-edit presentation templates to make your presentation stand out from others. So, what are you waiting for Download the template from Slidegeeks today and give a unique touch to your presentation.

Product Manufacturing Data Analytics Kpis Dashboard Guidelines PDF
This slide represents the data analytics dashboard for production manufacturing and management. It includes details related to KPIs such as rework quantity, labor cost, performance, overall equipment effectiveness etc. Showcasing this set of slides titled Product Manufacturing Data Analytics Kpis Dashboard Guidelines PDF. The topics addressed in these templates are Quantity, Rework Quantity, Manufacturing Cost, Labor Cot. All the content presented in this PPT design is completely editable. Download it and make adjustments in color, background, font etc. as per your unique business setting.
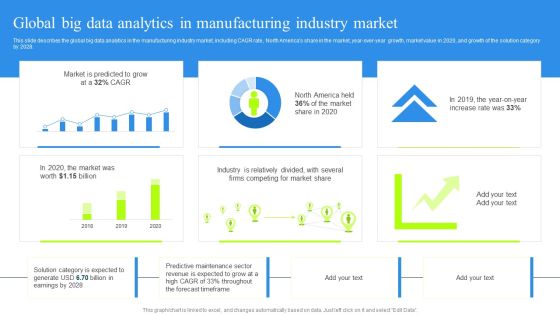
Global Big Data Analytics In Manufacturing Industry Market Pictures PDF
This slide describes the global big data analytics in the manufacturing industry market, including CAGR rate, North Americas share in the market, year-over-year growth, market value in 2020, and growth of the solution category by 2028. Find a pre-designed and impeccable Global Big Data Analytics In Manufacturing Industry Market Pictures PDF. The templates can ace your presentation without additional effort. You can download these easy-to-edit presentation templates to make your presentation stand out from others. So, what are you waiting for Download the template from Slidegeeks today and give a unique touch to your presentation.
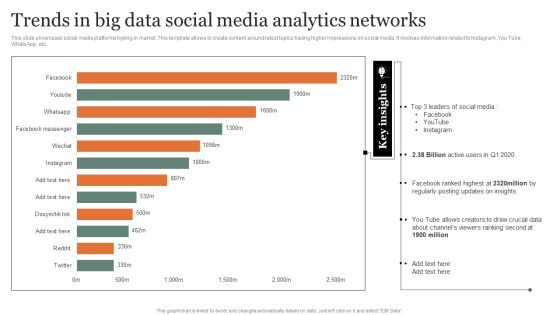
Trends In Big Data Social Media Analytics Networks Guidelines PDF
This slide showcases social media platforms hyping in market. This template allows to create content around latest topics having higher impressions on social media. It involves information related to Instagram, You Tube, WhatsApp, etc. Showcasing this set of slides titled Trends In Big Data Social Media Analytics Networks Guidelines PDF Topics. The topics addressed in these templates are Analytics Networks, Posting Updates, Ranking Second. All the content presented in this PPT design is completely editable. Download it and make adjustments in color, background, font etc. as per your unique business setting.
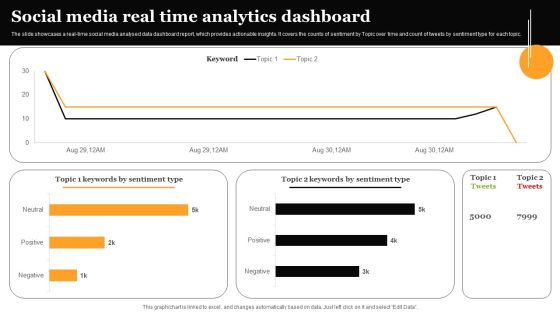
Social Media Real Time Analytics Dashboard Formats PDF
The slide showcases a real-time social media analysed data dashboard report, which provides actionable insights. It covers the counts of sentiment by Topic over time and count of tweets by sentiment type for each topic. Showcasing this set of slides titled Social Media Real Time Analytics Dashboard Formats PDF. The topics addressed in these templates are Social Media Real, Time Analytics, Dashboard. All the content presented in this PPT design is completely editable. Download it and make adjustments in color, background, font etc. as per your unique business setting.
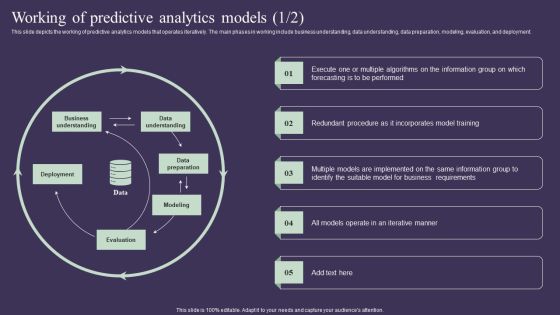
Projection Model Working Of Predictive Analytics Models Background PDF
This slide depicts the working of predictive analytics models that operates iteratively. The main phases in working include business understanding, data understanding, data preparation, modeling, evaluation, and deployment. Slidegeeks is one of the best resources for PowerPoint templates. You can download easily and regulate Projection Model Working Of Predictive Analytics Models Background PDF for your personal presentations from our wonderful collection. A few clicks is all it takes to discover and get the most relevant and appropriate templates. Use our Templates to add a unique zing and appeal to your presentation and meetings. All the slides are easy to edit and you can use them even for advertisement purposes.
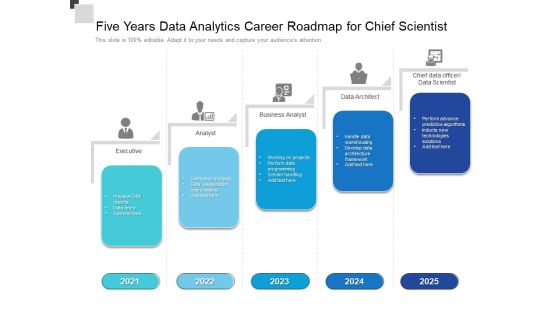
Five Years Data Analytics Career Roadmap For Chief Scientist Microsoft
We present our five years data analytics career roadmap for chief scientist microsoft. This PowerPoint layout is easy-to-edit so you can change the font size, font type, color, and shape conveniently. In addition to this, the PowerPoint layout is Google Slides compatible, so you can share it with your audience and give them access to edit it. Therefore, download and save this well-researched five years data analytics career roadmap for chief scientist microsoft in different formats like PDF, PNG, and JPG to smoothly execute your business plan.

Half Yearly Data Analytics Career Roadmap For Chief Scientist Download
We present our half yearly data analytics career roadmap for chief scientist download. This PowerPoint layout is easy-to-edit so you can change the font size, font type, color, and shape conveniently. In addition to this, the PowerPoint layout is Google Slides compatible, so you can share it with your audience and give them access to edit it. Therefore, download and save this well-researched half yearly data analytics career roadmap for chief scientist download in different formats like PDF, PNG, and JPG to smoothly execute your business plan.
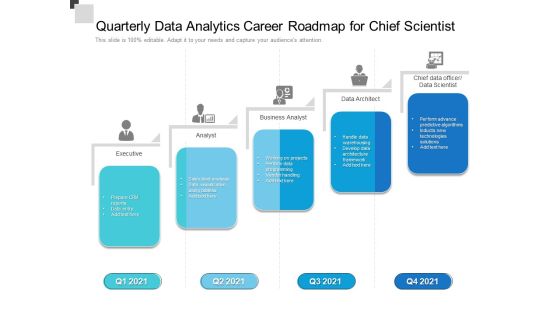
Quarterly Data Analytics Career Roadmap For Chief Scientist Infographics
We present our quarterly data analytics career roadmap for chief scientist infographics. This PowerPoint layout is easy-to-edit so you can change the font size, font type, color, and shape conveniently. In addition to this, the PowerPoint layout is Google Slides compatible, so you can share it with your audience and give them access to edit it. Therefore, download and save this well-researched quarterly data analytics career roadmap for chief scientist infographics in different formats like PDF, PNG, and JPG to smoothly execute your business plan.
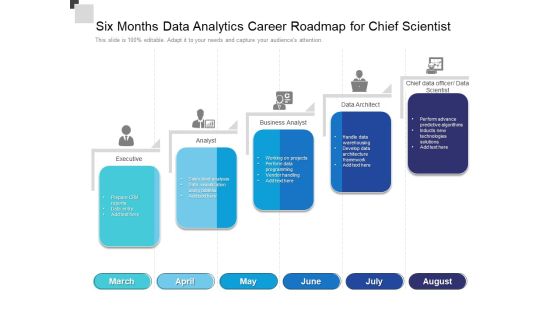
Six Months Data Analytics Career Roadmap For Chief Scientist Portrait
We present our six months data analytics career roadmap for chief scientist portrait. This PowerPoint layout is easy-to-edit so you can change the font size, font type, color, and shape conveniently. In addition to this, the PowerPoint layout is Google Slides compatible, so you can share it with your audience and give them access to edit it. Therefore, download and save this well-researched six months data analytics career roadmap for chief scientist portrait in different formats like PDF, PNG, and JPG to smoothly execute your business plan.

Three Months Data Analytics Career Roadmap For Chief Scientist Graphics
We present our three months data analytics career roadmap for chief scientist graphics. This PowerPoint layout is easy-to-edit so you can change the font size, font type, color, and shape conveniently. In addition to this, the PowerPoint layout is Google Slides compatible, so you can share it with your audience and give them access to edit it. Therefore, download and save this well-researched three months data analytics career roadmap for chief scientist graphics in different formats like PDF, PNG, and JPG to smoothly execute your business plan.
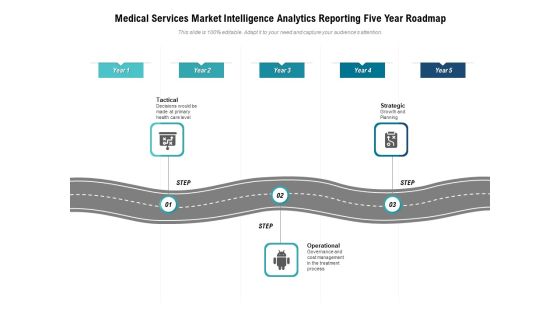
Medical Services Market Intelligence Analytics Reporting Five Year Roadmap Designs
We present our medical services market intelligence analytics reporting five year roadmap designs. This PowerPoint layout is easy to edit so you can change the font size, font type, color, and shape conveniently. In addition to this, the PowerPoint layout is Google Slides compatible, so you can share it with your audience and give them access to edit it. Therefore, download and save this well researched medical services market intelligence analytics reporting five year roadmap designs in different formats like PDF, PNG, and JPG to smoothly execute your business plan.

Five Year Information Technology Security Analytics Improvement Roadmap Infographics
We present our five year information technology security analytics improvement roadmap infographics. This PowerPoint layout is easy to edit so you can change the font size, font type, color, and shape conveniently. In addition to this, the PowerPoint layout is Google Slides compatible, so you can share it with your audience and give them access to edit it. Therefore, download and save this well researched five year information technology security analytics improvement roadmap infographics in different formats like PDF, PNG, and JPG to smoothly execute your business plan.
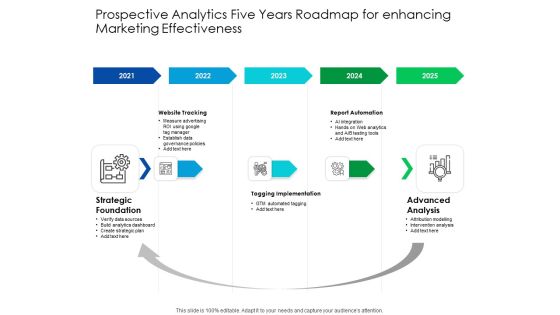
Predictive Analytics Five Years Roadmap For Enhancing Marketing Effectiveness Formats
We present our predictive analytics five years roadmap for enhancing marketing effectiveness formats. This PowerPoint layout is easy to edit so you can change the font size, font type, color, and shape conveniently. In addition to this, the PowerPoint layout is Google Slides compatible, so you can share it with your audience and give them access to edit it. Therefore, download and save this well researched predictive analytics five years roadmap for enhancing marketing effectiveness formats in different formats like PDF, PNG, and JPG to smoothly execute your business plan.
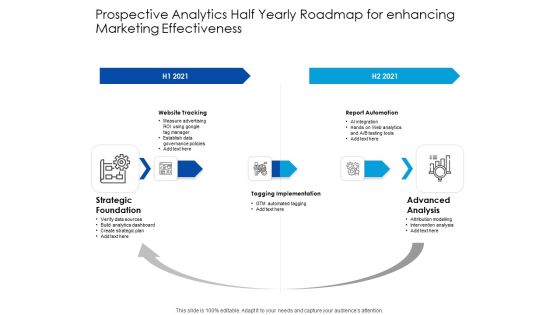
Predictive Analytics Half Yearly Roadmap For Enhancing Marketing Effectiveness Pictures
We present our predictive analytics half yearly roadmap for enhancing marketing effectiveness pictures. This PowerPoint layout is easy to edit so you can change the font size, font type, color, and shape conveniently. In addition to this, the PowerPoint layout is Google Slides compatible, so you can share it with your audience and give them access to edit it. Therefore, download and save this well researched predictive analytics half yearly roadmap for enhancing marketing effectiveness pictures in different formats like PDF, PNG, and JPG to smoothly execute your business plan.

Predictive Analytics Quarterly Roadmap For Enhancing Marketing Effectiveness Inspiration
We present our predictive analytics quarterly roadmap for enhancing marketing effectiveness inspiration. This PowerPoint layout is easy to edit so you can change the font size, font type, color, and shape conveniently. In addition to this, the PowerPoint layout is Google Slides compatible, so you can share it with your audience and give them access to edit it. Therefore, download and save this well researched predictive analytics quarterly roadmap for enhancing marketing effectiveness inspiration in different formats like PDF, PNG, and JPG to smoothly execute your business plan.
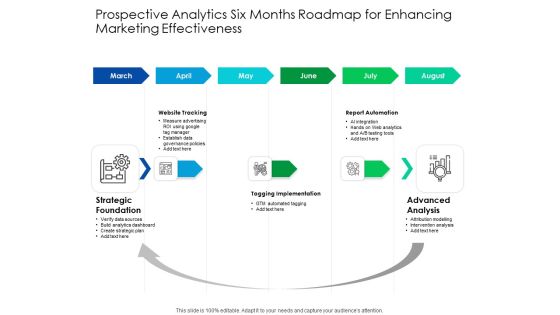
Predictive Analytics Six Months Roadmap For Enhancing Marketing Effectiveness Graphics
We present our predictive analytics six months roadmap for enhancing marketing effectiveness graphics. This PowerPoint layout is easy to edit so you can change the font size, font type, color, and shape conveniently. In addition to this, the PowerPoint layout is Google Slides compatible, so you can share it with your audience and give them access to edit it. Therefore, download and save this well researched predictive analytics six months roadmap for enhancing marketing effectiveness graphics in different formats like PDF, PNG, and JPG to smoothly execute your business plan.

Data Strategy And Analytics Five Years Action Plan Roadmap Graphics
We present our data strategy and analytics five years action plan roadmap graphics. This PowerPoint layout is easy to edit so you can change the font size, font type, color, and shape conveniently. In addition to this, the PowerPoint layout is Google Slides compatible, so you can share it with your audience and give them access to edit it. Therefore, download and save this well researched data strategy and analytics five years action plan roadmap graphics in different formats like PDF, PNG, and JPG to smoothly execute your business plan.

Data Strategy Governance And Analytics Five Year Roadmap Portrait
We present our data strategy governance and analytics five year roadmap portrait. This PowerPoint layout is easy to edit so you can change the font size, font type, color, and shape conveniently. In addition to this, the PowerPoint layout is Google Slides compatible, so you can share it with your audience and give them access to edit it. Therefore, download and save this well researched data strategy governance and analytics five year roadmap portrait in different formats like PDF, PNG, and JPG to smoothly execute your business plan.
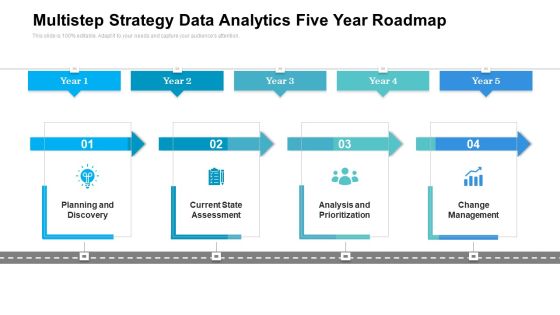
Multistep Strategy Data Analytics Five Year Roadmap Demonstration
We present our multistep strategy data analytics five year roadmap demonstration. This PowerPoint layout is easy to edit so you can change the font size, font type, color, and shape conveniently. In addition to this, the PowerPoint layout is Google Slides compatible, so you can share it with your audience and give them access to edit it. Therefore, download and save this well researched multistep strategy data analytics five year roadmap demonstration in different formats like PDF, PNG, and JPG to smoothly execute your business plan.

Business Analytics And Statistical Science Five Year Roadmap Rules
We present our business analytics and statistical science five year roadmap rules. This PowerPoint layout is easy to edit so you can change the font size, font type, color, and shape conveniently. In addition to this, the PowerPoint layout is Google Slides compatible, so you can share it with your audience and give them access to edit it. Therefore, download and save this well researched business analytics and statistical science five year roadmap rules in different formats like PDF, PNG, and JPG to smoothly execute your business plan.

Analytics Intelligence And IT Innovation Five Year Roadmap Designs
We present our analytics intelligence and it innovation five year roadmap designs. This PowerPoint layout is easy to edit so you can change the font size, font type, color, and shape conveniently. In addition to this, the PowerPoint layout is Google Slides compatible, so you can share it with your audience and give them access to edit it. Therefore, download and save this well researched analytics intelligence and it innovation five year roadmap designs in different formats like PDF, PNG, and JPG to smoothly execute your business plan.

Analytics Organization Five Years Roadmap For Big Data Implementation Portrait
We present our analytics organization five years roadmap for big data implementation portrait. This PowerPoint layout is easy to edit so you can change the font size, font type, color, and shape conveniently. In addition to this, the PowerPoint layout is Google Slides compatible, so you can share it with your audience and give them access to edit it. Therefore, download and save this well researched analytics organization five years roadmap for big data implementation portrait in different formats like PDF, PNG, and JPG to smoothly execute your business plan.

Chart Showing Business Issues In Big Data Analytics Diagrams PDF
Pitch your topic with ease and precision using this chart showing business issues in big data analytics diagrams pdf. This layout presents information on data complexity, data volumes, performance, skills. It is also available for immediate download and adjustment. So, changes can be made in the color, design, graphics or any other component to create a unique layout.

Data Analytics Impact On Business Marketing Plan Mockup PDF
This slide covers benefits of data analytics tool for building effective marketing strategies. It includes decision making, improvement in marketing, improved customer service and smooth operation. Presenting Data Analytics Impact On Business Marketing Plan Mockup PDF to dispense important information. This template comprises four stages. It also presents valuable insights into the topics including Decision Making, Improvement In Marketing, Improved Customer Service. This is a completely customizable PowerPoint theme that can be put to use immediately. So, download it and address the topic impactfully.

Manpower Analytics Strategy For Talent Acquisition And Retention Summary PDF
This slide covers different workforce analytics strategies for talent management. It includes gaining right tracker, collect potential, fix skill gaps, prevent turnover and provide reasonable compensation. Presenting Manpower Analytics Strategy For Talent Acquisition And Retention Summary PDF to dispense important information. This template comprises five stages. It also presents valuable insights into the topics including Gain Right Tracker, Collect Potential, Provide Compensation, Fix Skill Gaps. This is a completely customizable PowerPoint theme that can be put to use immediately. So, download it and address the topic impactfully.

Annual Staffing Data Analytics Of Linkedin Platform Summary PDF
The following slide showcases details related to hire on LinkedIn and provide employers a chance hire best candidate for their firm. It includes users worldwide, monthly active users, recruiters, male and female on LinkedIn. Presenting Annual Staffing Data Analytics Of Linkedin Platform Summary PDF to dispense important information. This template comprises one stages. It also presents valuable insights into the topics including Annual Staffing Data Analytics, Linkedin Platform. This is a completely customizable PowerPoint theme that can be put to use immediately. So, download it and address the topic impactfully.
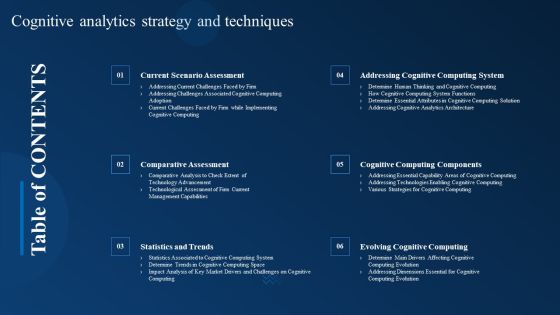
Table Of Contents Cognitive Analytics Strategy And Techniques Introduction PDF
Whether you have daily or monthly meetings, a brilliant presentation is necessary. Table Of Contents Cognitive Analytics Strategy And Techniques Introduction PDF can be your best option for delivering a presentation. Represent everything in detail using Table Of Contents Cognitive Analytics Strategy And Techniques Introduction PDF and make yourself stand out in meetings. The template is versatile and follows a structure that will cater to your requirements. All the templates prepared by Slidegeeks are easy to download and edit. Our research experts have taken care of the corporate themes as well. So, give it a try and see the results.
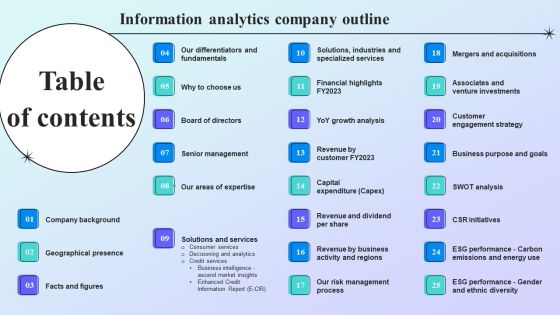
Information Analytics Company Outline Tables Of Content Template PDF
Whether you have daily or monthly meetings, a brilliant presentation is necessary. Information Analytics Company Outline Tables Of Content Template PDF can be your best option for delivering a presentation. Represent everything in detail using Information Analytics Company Outline Tables Of Content Template PDF and make yourself stand out in meetings. The template is versatile and follows a structure that will cater to your requirements. All the templates prepared by Slidegeeks are easy to download and edit. Our research experts have taken care of the corporate themes as well. So, give it a try and see the results.

Key Steps To Develop Effective Data Analytics Infrastructure Inspiration PDF
This slide includes key steps for developing a data analytics ecosystem aimed at improving innovation and customer experience. These steps include understand data ecosystem, collect data, store data, process data, and utilise data. Presenting Key Steps To Develop Effective Data Analytics Infrastructure Inspiration PDF to dispense important information. This template comprises five stages. It also presents valuable insights into the topics including Understand Data Ecosystem, Collect Data, Store Data, Process Data, Utilise Data. This is a completely customizable PowerPoint theme that can be put to use immediately. So, download it and address the topic impactfully.
Income Enablement Process Using Retail Analytics Template PDF
The following slide outlines revenue enablement process aimed at reaping benefits of in store retail analytics to understand customer preferences and patterns. It covers customer insights, improve visual merchandising and inventory management, data driven promoter management and cost optimization. Presenting Income Enablement Process Using Retail Analytics Template PDF to dispense important information. This template comprises five stages. It also presents valuable insights into the topics including Improve Visual Merchandising, Understand Customer Insights, Improve Inventory Management. This is a completely customizable PowerPoint theme that can be put to use immediately. So, download it and address the topic impactfully.

Strategic Talent Procurement Analytics With Cognition Insights Infographics PDF
This slide exhibits various analytics solutions that exist in candidate sourcing and screening which can potentially increase new-hire quality and reduce the impact of selection biases. It includes cognitive insights, cognitive automation, and cognitive engagement. Presenting Strategic Talent Procurement Analytics With Cognition Insights Infographics PDF to dispense important information. This template comprises six stages. It also presents valuable insights into the topics including Data Mining, Artificial Intelligence, Pattern Recognition, Smart Chatbots. This is a completely customizable PowerPoint theme that can be put to use immediately. So, download it and address the topic impactfully.

Various Examples Of Social Media Analytics Applications Mockup PDF
This slide showcases instances giving impact of data in day to day life. This template aims on making better business decisions by analysing large volumes of data. It covers aspects such as public health England, Bank of America, Accenture, etc. Presenting Various Examples Of Social Media Analytics Applications Mockup PDF Structure to dispense important information. This template comprises six stages. It also presents valuable insights into the topics including Weather Analytics, Greater Manchester, Health England. This is a completely customizable PowerPoint theme that can be put to use immediately. So, download it and address the topic impactfully.

Real Time Market Analytics Benefits And Impact Infographics PDF
The slide showcases marketing benefits and impacts of real-time data analytics. It covers improves website performance, removes underperforming elements, keeps track of current trends, optimizes conversions. Presenting Real Time Market Analytics Benefits And Impact Infographics PDF to dispense important information. This template comprises four stages. It also presents valuable insights into the topics including Improves Website Performance, Removes Underperforming Elements, Optimizes Conversions. This is a completely customizable PowerPoint theme that can be put to use immediately. So, download it and address the topic impactfully.

Procedure To Analysis Value From Big Data Analytics Microsoft PDF
This slide showcase process to extract information and useful insights using big data analytics for decision making. It includes elements such as data cleaning and processing, explore and visualize data, data mining, model building etc. Presenting Procedure To Analysis Value From Big Data Analytics Microsoft PDF to dispense important information. This template comprises five stages. It also presents valuable insights into the topics including Data Analysis Process, Processing, Data Mining, Optimize Result. This is a completely customizable PowerPoint theme that can be put to use immediately. So, download it and address the topic impactfully.
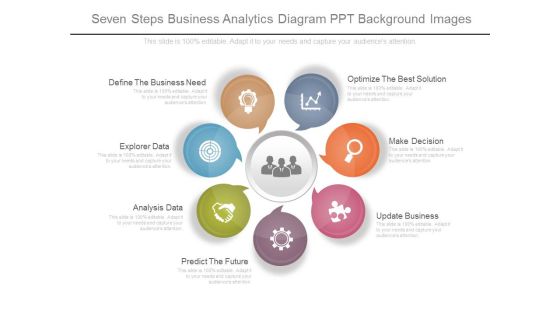
Seven Steps Business Analytics Diagram Ppt Background Images
This is a seven steps business analytics diagram ppt background images. This is a seven stage process. The stages in this process are optimize the best solution, make decision, update business, predict the future, analysis data, explorer data, define the business need.

Statistical Analytics Report Showing Evolution Of Sales Industry Diagrams PDF
The following slide showcases a comprehensive analytical report highlighting the evolution of sales industry over the years. It provides information about sales cycle, state of the sales industry, etc. Showcasing this set of slides titled statistical analytics report showing evolution of sales industry diagrams pdf. The topics addressed in these templates are sales, technologies, system. All the content presented in this PPT design is completely editable. Download it and make adjustments in color, background, font etc. as per your unique business setting.
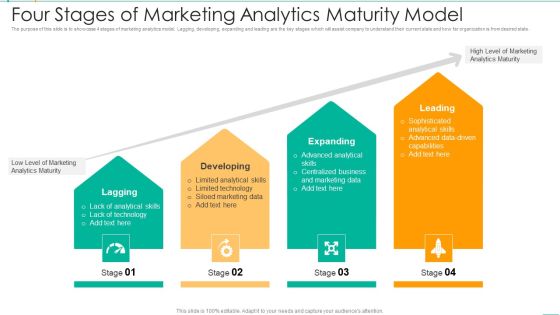
Four Stages Of Marketing Analytics Maturity Model Themes PDF
Persuade your audience using this Four Stages Of Marketing Analytics Maturity Model Themes PDF. This PPT design covers four stages, thus making it a great tool to use. It also caters to a variety of topics including Expanding, Leading, Developing. Download this PPT design now to present a convincing pitch that not only emphasizes the topic but also showcases your presentation skills.

Customer Behavioral Data And Analytics Circular Diagram Download PDF
This is a customer behavioral data and analytics circular diagram download pdf template with various stages. Focus and dispense information on six stages using this creative set, that comes with editable features. It contains large content boxes to add your information on topics like circular diagram. You can also showcase facts, figures, and other relevant content using this PPT layout. Grab it now.

Customer Behavioral Data And Analytics Linear Diagram Microsoft PDF
This is a customer behavioral data and analytics linear diagram microsoft pdf template with various stages. Focus and dispense information on five stages using this creative set, that comes with editable features. It contains large content boxes to add your information on topics like linear diagram. You can also showcase facts, figures, and other relevant content using this PPT layout. Grab it now.

Sales Analytics Dashboard Ppt PowerPoint Presentation Outline Diagrams
Presenting this set of slides with name sales analytics dashboard ppt powerpoint presentation outline diagrams. The topics discussed in these slides are buzz marketing, process, strategy. This is a completely editable PowerPoint presentation and is available for immediate download. Download now and impress your audience.
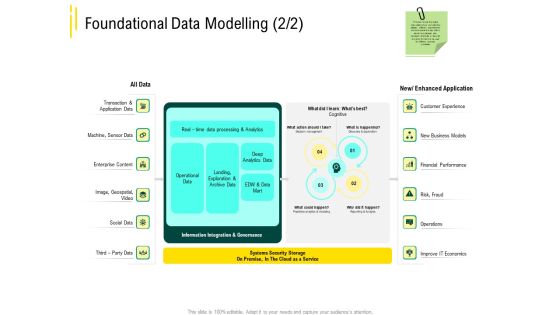
Expert Systems Foundational Data Modelling Analytics Diagrams PDF
Deliver an awe-inspiring pitch with this creative expert systems foundational data modelling analytics diagrams pdf bundle. Topics like socia, edw and data mart, operations, new business models, financial performance can be discussed with this completely editable template. It is available for immediate download depending on the needs and requirements of the user.

Table Of Contents Procurement Analytics Slide Diagrams PDF
Presenting Table Of Contents Procurement Analytics Slide Diagrams PDF to provide visual cues and insights. Share and navigate important information on one stage that need your due attention. This template can be used to pitch topics like Data Analysis, Enterprise Procurement, Budget Analysis. In addtion, this PPT design contains high resolution images, graphics, etc, that are easily editable and available for immediate download.

Agenda Procurement Analytics Tools And Strategies Diagrams PDF
This is a Agenda Procurement Analytics Tools And Strategies Diagrams PDF template with various stages. Focus and dispense information on five stages using this creative set, that comes with editable features. It contains large content boxes to add your information on topics like Agenda. You can also showcase facts, figures, and other relevant content using this PPT layout. Grab it now.

Customer 360 Overview Predictive Analytics Results Ppt Inspiration Infographics PDF
Presenting this set of slides with name customer 360 overview predictive analytics results ppt inspiration infographics pdf. The topics discussed in these slides are achieve competitive advantage, new revenue opportunities, increased profitability, increased customer service, operational efficiencies. This is a completely editable PowerPoint presentation and is available for immediate download. Download now and impress your audience.

Business Analytics Solution Dashboard Ppt PowerPoint Presentation File Clipart PDF
Presenting this set of slides with name business analytics solution dashboard ppt powerpoint presentation file clipart pdf. The topics discussed in these slides are aesthetic, navigation, searchability. This is a completely editable PowerPoint presentation and is available for immediate download. Download now and impress your audience.

Customer Behavioral Data And Analytics Customer Surveys Information PDF
Roll out customer surveys to get detailed customer feedback of their shopping experience, challenges and suggestions. Deliver an awe inspiring pitch with this creative customer behavioral data and analytics customer surveys information pdf bundle. Topics like customer surveys can be discussed with this completely editable template. It is available for immediate download depending on the needs and requirements of the user.

Data Requirements For Analytics Dashboard For Product Initiatives Clipart PDF
Showcasing this set of slides titled data requirements for analytics dashboard for product initiatives clipart pdf. The topics addressed in these templates are product, customer, revenue. All the content presented in this PPT design is completely editable. Download it and make adjustments in color, background, font etc. as per your unique business setting.

Acquiring Big Data Analytics And Visualization Ideas PDF
Presenting acquiring big data analytics and visualization ideas pdf to dispense important information. This template comprises four stages. It also presents valuable insights into the topics including data sources, acquire, manage. This is a completely customizable PowerPoint theme that can be put to use immediately. So, download it and address the topic impactfully.

Big Data Analytics Techniques For Creating Business Value Sample PDF
Presenting big data analytics techniques for creating business value sample pdf to dispense important information. This template comprises five stages. It also presents valuable insights into the topics including association rule learning, classification tree analysis, genetic algorithm. This is a completely customizable PowerPoint theme that can be put to use immediately. So, download it and address the topic impactfully.

Quarterly Business Analytics Career Roadmap With Skills Themes
Introducing our quarterly business analytics career roadmap with skills themes. This PPT presentation is Google Slides compatible, therefore, you can share it easily with the collaborators for measuring the progress. Also, the presentation is available in both standard screen and widescreen aspect ratios. So edit the template design by modifying the font size, font type, color, and shapes as per your requirements. As this PPT design is fully editable it can be presented in PDF, JPG and PNG formats.
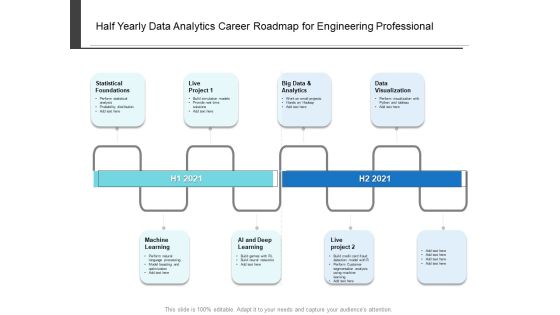
Half Yearly Data Analytics Career Roadmap For Engineering Professional Themes
Presenting our innovatively-structured half yearly data analytics career roadmap for engineering professional themes Template. Showcase your roadmap process in different formats like PDF, PNG, and JPG by clicking the download button below. This PPT design is available in both Standard Screen and Widescreen aspect ratios. It can also be easily personalized and presented with modified font size, font type, color, and shapes to measure your progress in a clear way.

Predictive Analytics Six Months Roadmap With Use Cases Themes
Presenting our jaw dropping predictive analytics six months roadmap with use cases themes. You can alternate the color, font size, font type, and shapes of this PPT layout according to your strategic process. This PPT presentation is compatible with Google Slides and is available in both standard screen and widescreen aspect ratios. You can also download this well researched PowerPoint template design in different formats like PDF, JPG, and PNG. So utilize this visually appealing design by clicking the download button given below.

Data Strategy Governance And Analytics Four Quarter Roadmap Themes
Presenting our innovatively structured data strategy governance and analytics four quarter roadmap themes Template. Showcase your roadmap process in different formats like PDF, PNG, and JPG by clicking the download button below. This PPT design is available in both Standard Screen and Widescreen aspect ratios. It can also be easily personalized and presented with modified font size, font type, color, and shapes to measure your progress in a clear way.
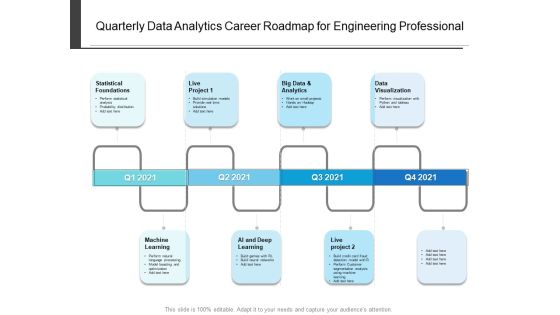
Quarterly Data Analytics Career Roadmap For Engineering Professional Diagrams
Presenting our innovatively-structured quarterly data analytics career roadmap for engineering professional diagrams Template. Showcase your roadmap process in different formats like PDF, PNG, and JPG by clicking the download button below. This PPT design is available in both Standard Screen and Widescreen aspect ratios. It can also be easily personalized and presented with modified font size, font type, color, and shapes to measure your progress in a clear way.
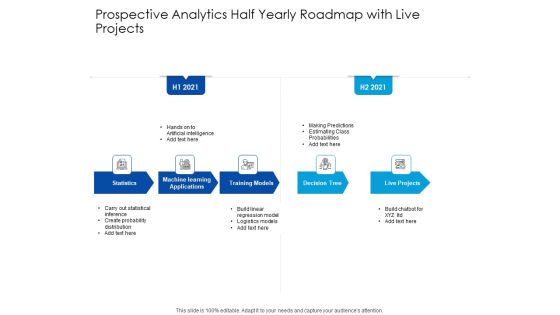
Predictive Analytics Half Yearly Roadmap With Live Projects Diagrams
Presenting our innovatively structured predictive analytics half yearly roadmap with live projects diagrams Template. Showcase your roadmap process in different formats like PDF, PNG, and JPG by clicking the download button below. This PPT design is available in both Standard Screen and Widescreen aspect ratios. It can also be easily personalized and presented with modified font size, font type, color, and shapes to measure your progress in a clear way.
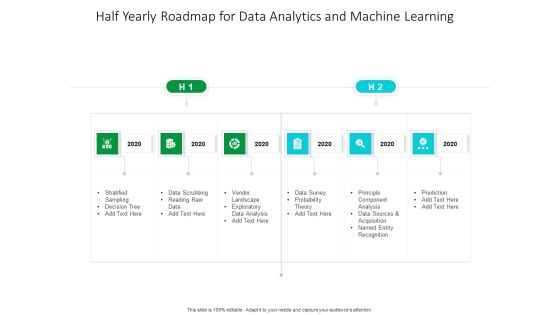
Half Yearly Roadmap For Data Analytics And Machine Learning Diagrams
Introducing our half yearly roadmap for data analytics and machine learning diagrams. This PPT presentation is Google Slides compatible, therefore, you can share it easily with the collaborators for measuring the progress. Also, the presentation is available in both standard screen and widescreen aspect ratios. So edit the template design by modifying the font size, font type, color, and shapes as per your requirements. As this PPT design is fully editable it can be presented in PDF, JPG and PNG formats.

Checklist For Big Data Analytics Procedure Graphics PDF
This slide showcase checklist for development of big data analysis process for various phases. It includes phases such as business understanding, data understanding, data preparation, modeling, evaluation and deployment Presenting Checklist For Big Data Analytics Procedure Graphics PDF to dispense important information. This template comprises three stages. It also presents valuable insights into the topics including Procedure, Big Data, Checklist. This is a completely customizable PowerPoint theme that can be put to use immediately. So, download it and address the topic impactfully.

Global Working Capital Market Investment Analytics Diagrams PDF
This slide showcases an analysis of top trends in the global venture capital investment market. It also includes market gains in IPO, venture capital growth, government focus, etc. Presenting Global Working Capital Market Investment Analytics Diagrams PDF to dispense important information. This template comprises four stages. It also presents valuable insights into the topics including Key Trend, Key Trend, Market Drivers This is a completely customizable PowerPoint theme that can be put to use immediately. So, download it and address the topic impactfully.
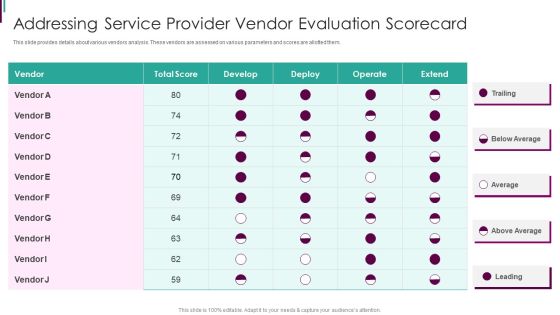
Developing Business Analytics Framework Addressing Service Provider Vendor Themes PDF
This slide provides details about various vendors analysis. These vendors are assessed on various parameters and scores are allotted them. Deliver an awe inspiring pitch with this creative Developing Business Analytics Framework Addressing Service Provider Vendor Themes PDF bundle. Topics like Addressing Service, Provider Vendor, Evaluation Scorecard can be discussed with this completely editable template. It is available for immediate download depending on the needs and requirements of the user.

Human Resource Analytics Employee Engagement Key Performance Metrics Inspiration PDF
This slide represents key metrics dashboard to analyze the engagement of employees in the organization. It includes details related to KPIs such as engagement score, response rate, net promoter score etc. Crafting an eye-catching presentation has never been more straightforward. Let your presentation shine with this tasteful yet straightforward Human Resource Analytics Employee Engagement Key Performance Metrics Inspiration PDF template. It offers a minimalistic and classy look that is great for making a statement. The colors have been employed intelligently to add a bit of playfulness while still remaining professional. Construct the ideal Human Resource Analytics Employee Engagement Key Performance Metrics Inspiration PDF that effortlessly grabs the attention of your audience Begin now and be certain to wow your customers.

Social Media Analytics Dashboard To Track Viral Keywords Structure PDF
This slides showcases social media analytics dashboard to track viral keywords. It provides details about daily volume, keyword searches, keyword volume, etc. which can effectively guide digital marketers to craft potential campaigns. Slidegeeks is one of the best resources for PowerPoint templates. You can download easily and regulate Social Media Analytics Dashboard To Track Viral Keywords Structure PDF for your personal presentations from our wonderful collection. A few clicks is all it takes to discover and get the most relevant and appropriate templates. Use our Templates to add a unique zing and appeal to your presentation and meetings. All the slides are easy to edit and you can use them even for advertisement purposes.

Warehouse Fleet And Transportation Performance Analytics Dashboard Pictures PDF
This slide represents a warehouse fleet and transportation management dashboard to visualize and optimize logistics operations through advanced data analyses. It monitors KPIs such as fleet status, delivery status, deliveries by location, average delivery time hours0 and route Km, loading time and weight, and profit by location. Do you have to make sure that everyone on your team knows about any specific topic I yes, then you should give Warehouse Fleet And Transportation Performance Analytics Dashboard Pictures PDF a try. Our experts have put a lot of knowledge and effort into creating this impeccable Warehouse Fleet And Transportation Performance Analytics Dashboard Pictures PDF. You can use this template for your upcoming presentations, as the slides are perfect to represent even the tiniest detail. You can download these templates from the Slidegeeks website and these are easy to edit. So grab these today
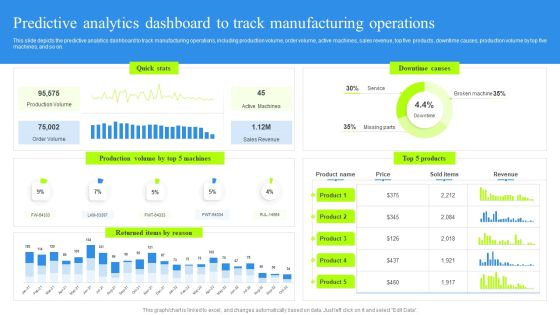
Predictive Analytics Dashboard To Track Manufacturing Operations Rules PDF
This slide depicts the predictive analytics dashboard to track manufacturing operations, including production volume, order volume, active machines, sales revenue, top five products, downtime causes, production volume by top five machines, and so on. Present like a pro with Predictive Analytics Dashboard To Track Manufacturing Operations Rules PDF Create beautiful presentations together with your team, using our easy-to-use presentation slides. Share your ideas in real-time and make changes on the fly by downloading our templates. So whether you are in the office, on the go, or in a remote location, you can stay in sync with your team and present your ideas with confidence. With Slidegeeks presentation got a whole lot easier. Grab these presentations today.
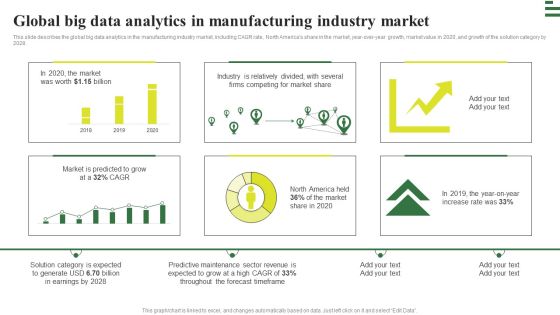
Transforming Manufacturing With Automation Global Big Data Analytics Rules PDF
This slide describes the global big data analytics in the manufacturing industry market, including CAGR rate, North Americas share in the market, year-over-year growth, market value in 2020, and growth of the solution category by 2028. Are you in need of a template that can accommodate all of your creative concepts This one is crafted professionally and can be altered to fit any style. Use it with Google Slides or PowerPoint. Include striking photographs, symbols, depictions, and other visuals. Fill, move around, or remove text boxes as desired. Test out color palettes and font mixtures. Edit and save your work, or work with colleagues. Download Transforming Manufacturing With Automation Global Big Data Analytics Rules PDF and observe how to make your presentation outstanding. Give an impeccable presentation to your group and make your presentation unforgettable.

 Home
Home