Analysis

Business Diagram Infographic For Business Analysis Presentation Template
This business diagram contains business infographic. Our professionally designed business diagram helps to depict business analysis. Enlighten your audience with your breathtaking ideas.

Venn Circles Infographic For Financial Analysis PowerPoint Templates
This PowerPoint template has been designed with Venn circles infographic. This infographic template useful for financial analysis. Accelerate the impact of your ideas using this template.
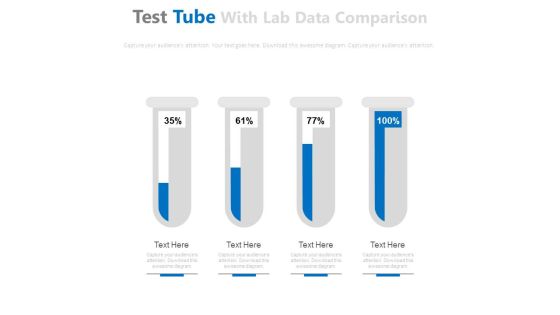
Test Tubes For Financial Ratio Analysis Powerpoint Slides
This PowerPoint template has been designed with graphics of test tubes. Use this PPT slide to depict financial ratio analysis. Download this PPT template to make impressive presentations.

Infographic Diagram For Business Process Analysis Powerpoint Slides
This PowerPoint slide contains business infographic diagram. This professional slide may be used to display business process analysis. Use this business template to make impressive presentations.

World Map For Global Business Analysis Powerpoint Slides
This professionally designed PowerPoint template displays diagram of world map. You can download this diagram to exhibit global business analysis. Above PPT slide is suitable for business presentation.

Venn Diagram For Business Intelligence And Predictive Analysis Powerpoint Slides
This power point template has been designed with two steps Venn diagram. Use this Venn diagram for business intelligence and predictive analysis. Illustrate your ideas and imprint them in the minds of your team with this template.
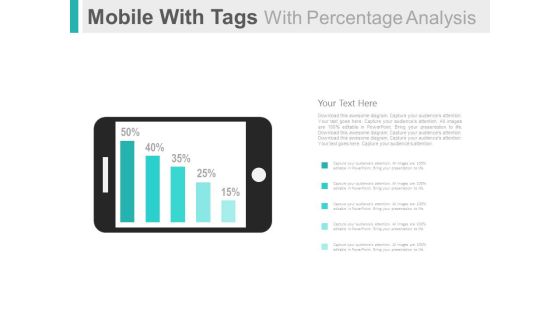
Mobile For Online Survey And Analysis Powerpoint Slides
This PowerPoint template has been designed with graphics of mobile and percentage bar graph. This PPT slide can be used to display online survey and analysis. You can download finance PowerPoint template to prepare awesome presentations.

Dashboard To Simplify Business Data Analysis Powerpoint Slides
This PowerPoint template graphics of meter chart. Download this PPT chart to simplify business data analysis. This PowerPoint slide is of great help in the business sector to make realistic presentations and provides effective way of presenting your newer thoughts.

Data Driven Comparison Charts For Analysis Powerpoint Slides
You can download this PowerPoint template to display statistical data and analysis. This PPT slide contains data driven comparison charts. Draw an innovative business idea using this professional diagram.

Three Arrow Tags For Data Analysis PowerPoint Template
Our professionally designed business diagram is as an effective tool to display data analysis. It contains graphics of three arrow tags. This template is specifically created to highlight you points.

Five Steps For Data Compare And Analysis Powerpoint Template
Our above slide contains graphics of five steps chart. This PowerPoint template is useful for data compare and analysis. Use this diagram to impart more clarity to subject and to create more sound impact on viewers.
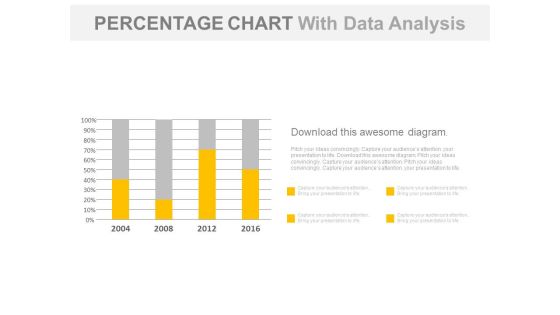
Year Based Chart With Percentage Data Analysis Powerpoint Slides
Our above business slide contains year based statistical chart. This PowerPoint template can be used to display percentage data analysis. Capture the attention of your audience with this slide.

Four Steps For Financial Data Analysis Powerpoint Slides
This PowerPoint contains four circles with percentage values. Download this diagram slide to display financial data analysis. This template is editable, You can edit text, color, shade and style of this diagram as per you need.

Finger Print Circuit For Security Analysis Powerpoint Template
This PowerPoint template has been designed with finder print circuit diagram. Download this diagram to display technology and security analysis. Download this diagram slide to make impressive yet unique presentations.
Idea Generation Process Control Growth Analysis Application PowerPoint Template
The template can be used to represent the concepts of idea generation, process control and growth analysis. Our above slide contains various icons for apps. Capture the attention of your audience.
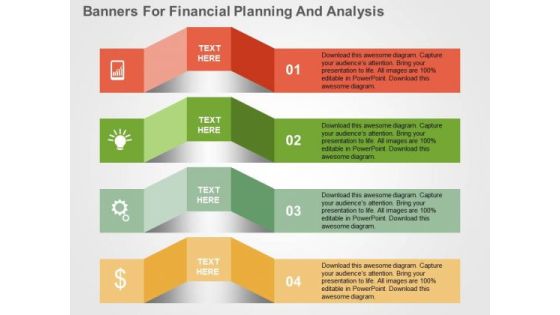
Banners For Financial Planning And Analysis PowerPoint Template
Visually support your presentation with our above template illustrating diagram of banners. It contains graphics of concepts of financial planning and analysis. Etch your views in the brains of your audience with this diagram slide.

Test Tubes And Beaker For Ratio Analysis Powerpoint Template
Visually support your presentation with our above template containing diagram of test tubes and beaker. This diagram is excellent visual tools for explaining ratio analysis. Use this diagram to make interactive presentations.
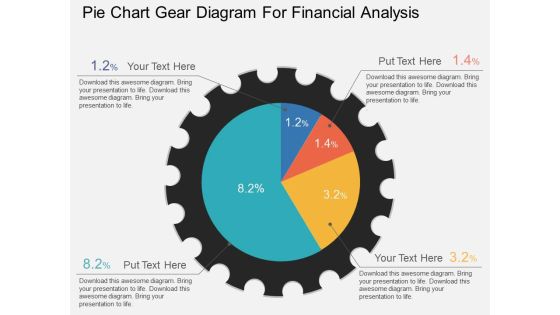
Pie Chart Gear Diagram For Financial Analysis Powerpoint Template
This PowerPoint template has been designed with graphic of pie chart gear diagram. This PPT slide can be used to display financial analysis. Download this PPT diagram slide to make your presentations more effective.

Pie Charts For Financial Ratio Analysis Powerpoint Slides
This PowerPoint template has been designed with diagram of pie charts. This PPT slide can be used to prepare presentations for profit growth report and also for financial data analysis. You can download finance PowerPoint template to prepare awesome presentations.

Board With Bar Graph For Financial Analysis Powerpoint Slides
You can download this PowerPoint template to display statistical data and analysis. This PPT slide contains display board with bar graph. Draw an innovative business idea using this professional diagram.

Business Diagram Colorful Gear For Swot Analysis Presentation Template
This business slide has been designed with graphics of colorful gear divided into four parts. Download this diagram to present SWOT analysis. Cement your ideas in the minds of your listeners with this slide.

Business Diagram Test Tubes For Research And Analysis Presentation Template
This diagram is suitable for research and analysis. This diagram template contains the graphic of test tubes. Adjust the above diagram into your Presentations to visually support your contents.

Timeline With Year Based Analysis And Business Apps PowerPoint Template
Create dynamic presentations with our professional template containing graphics of timeline with business icons. This diagram may be used to display planning and analysis. Download this template to leave permanent impression on your audience.

Pie Chart On Magnifying Glass For Business Analysis PowerPoint Template
Visually support your presentation with our above template showing pie chart on magnifying glass. This slide has been professionally designed to emphasize the concept of market research and analysis. Deliver amazing presentations to mesmerize your audience.
Circles With Icons For Swot Analysis PowerPoint Template
Visually support your presentation with our above template showing four circles with icons. This slide has been professionally designed to present SWOT analysis. This template offers an excellent background to build impressive presentation.
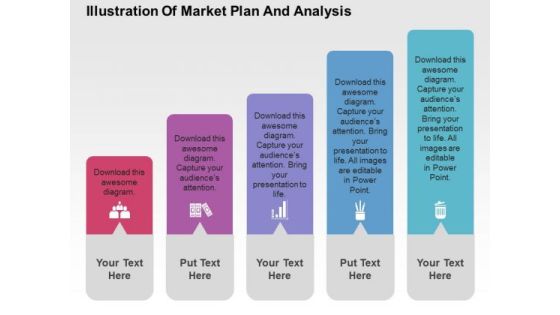
Illustration Of Market Plan And Analysis PowerPoint Templates
The above slide displays five text boxes with icons. This template has been designed to present market plan and analysis. Imprint your concepts with this PPT slide in your presentations.

Fish Bone For Cause And Effect Analysis PowerPoint Templates
This PPT slide has been designed with graphic fish bone diagram. Download this fishbone slide to present cause and effect analysis. Accelerate the impact of your ideas using this image.

Pie Chart For Financial Ratio Analysis PowerPoint Templates
Create visually amazing presentations with this slide of pie chart. This PPT slide of pie chart for financial ratio analysis. Add this diagram in your presentations to visually support your content.

Dashboard Diagram For Finance And Strategic Analysis Powerpoint Slides
This PowerPoint template display graphics of clock with arrows around it and dollar symbol in center. You may use this PPT slide for financial and strategic analysis. This dashboard slide may useful for multilevel status report creation and approval process.
Four Cubes For Financial Ratio Analysis Powerpoint Template
This business slide displays graphics of four cubes. This PPT slide has been designed to portray concept of financial ratio analysis. Download this PPT slide design to make interactive presentations.
Four Cubes For Fnancial Ratio Analysis Powerpoint Template
This business slide displays graphics of four cubes. This PPT slide has been designed to portray concept of financial ratio analysis. Download this PPT slide design to make interactive presentations.

Business Meeting For Planning And Analysis Powerpoint Template
Graphic of business meeting has been used to design this power point template diagram. This PPT diagram contains the concept of business planning and analysis. Use this PPT diagram for business and marketing related presentations.
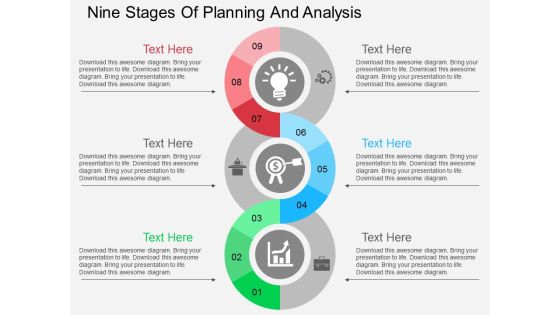
Nine Stages Of Planning And Analysis Powerpoint Templates
Our above business diagram has been designed with spiral info graphic diagram. This slide is suitable to present planning and analysis. Use this business diagram to present your work in a more smart and precise manner.

Alphabet Steps For Financial Strategy Analysis Powerpoint Slides
This PowerPoint template has been designed with alphabet steps with icons. This PPT slide may be used to display financial strategy analysis. Make outstanding business presentation with this template.
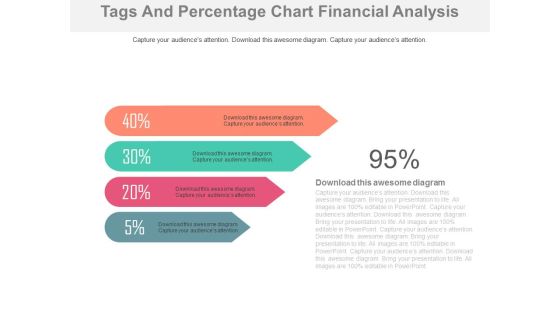
Four Percentage Tags For Financial Analysis Powerpoint Slides
This PowerPoint template contains design of four percentage tags. You may download this PPT slide to display financial analysis. You can easily customize this template to make it more unique as per your need.
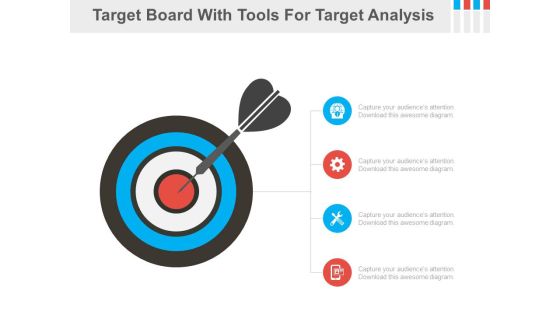
Four Tools For Marketing Target Analysis Powerpoint Slides
This PPT slide contains graphics of target board with four icons. You may download this PPT slide as tool for marketing target analysis. Impress your audiences by using this PPT slide.
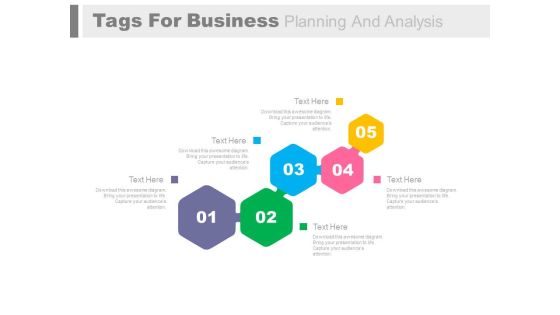
Five Steps For Business Process And Analysis Powerpoint Slides
Five steps process flow have been displayed in this business slide. This business diagram helps to exhibit business process and analysis. Use PowerPoint template to build an exclusive presentation.

Four Text Boxes For Swot Analysis Powerpoint Slides
This PPT slide has been designed with graphics of four steps text boxes diagram. This business diagram helps to exhibit SWOT analysis. Use this PowerPoint template to build an exclusive presentation.
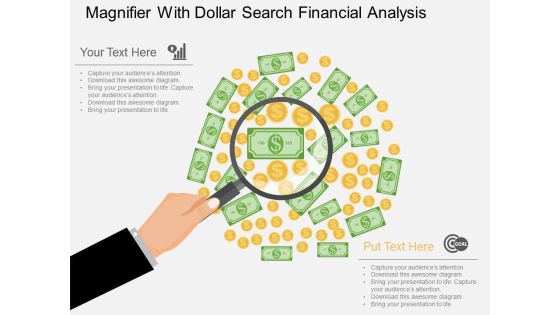
Magnifier With Dollar Search Financial Analysis Powerpoint Template
Our above business slide contains graphics of magnifier on dollar notes. This diagram can be used to display dollar search and financial analysis. Capture the attention of your audience with this professional slide.

Business Vision And Mission Strategy Analysis Powerpoint Slides
This PowerPoint template displays pictures of corporate team member. You may download this PPT slide to depict corporate vision, mission and strategy analysis. Add this slide to your presentation and impress your superiors.

Linear Timeline Steps For Year Based Analysis Powerpoint Slides
This PowerPoint template has been designed with linear timeline steps. This PPT slide may be helpful to display year based business analysis. Download this PowerPoint timeline template to make impressive presentations.
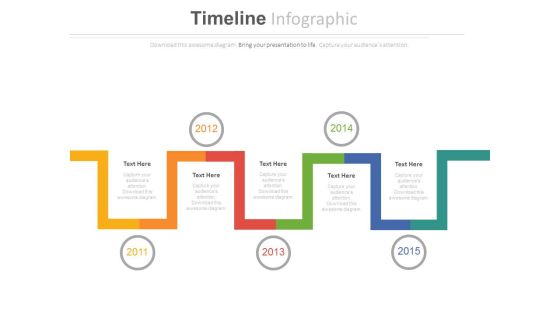
Timeline Steps For Year Based Analysis Powerpoint Slides
This PowerPoint timeline template can be used for multiple purposes including vision planning, new milestones and tasks. This PPT slide may be helpful to display timeline steps and year based analysis. Download this PowerPoint timeline template to make impressive presentations.

Bar Graph With Yearly Statistical Analysis Powerpoint Slides
This PowerPoint template contains diagram of bar graph with yearly percentage ratios. You may download this slide to display statistical analysis. You can easily customize this template to make it more unique as per your need.

Three Person Tags For Management Analysis Powerpoint Slides
This PowerPoint template has been designed with three persons tags. You may use this slide to display management analysis. Make your mark with this unique slide and create an impression that will endure.
Four Steps And Icons For Business Analysis Powerpoint Template
Our above PPT slide contains four steps with icons. This PowerPoint template helps to display business strategy and analysis. Use this diagram to impart more clarity to subject and to create more sound impact on viewers.

Bar Graph For Year Based Analysis Powerpoint Slides
This PowerPoint template has been designed with year based bar graph. This diagram may be used to display yearly statistical analysis. Use this PPT slide design to make impressive presentations.

Circle Chart With Percentage Value Analysis Powerpoint Slides
This PowerPoint template has been designed with circular process diagram. This business diagram helps to exhibit financial process control and analysis. Use this diagram to visually support your content.

Four Tags For Financial Review And Analysis Powerpoint Slides
This PowerPoint template has been designed with four tags and financial values. This PowerPoint template helps to exhibit financial review and analysis. Use this diagram slide to build an exclusive presentation.

Pie Chart For Financial Ratio Analysis Powerpoint Slides
This PPT slide contains graphics of eight stage pie chart. Download this PowerPoint template slide for financial ratio analysis. This diagram is editable you can edit text, color, shade and style as per you need.

Five Bars For Marketing Research And Analysis Powerpoint Template
This business slide contains diagram of five colorful bars. This diagram provides schematic representation of marketing research and analysis. Visual effect this slide helps in maintaining the flow of the discussion and provides more clarity to the subject.
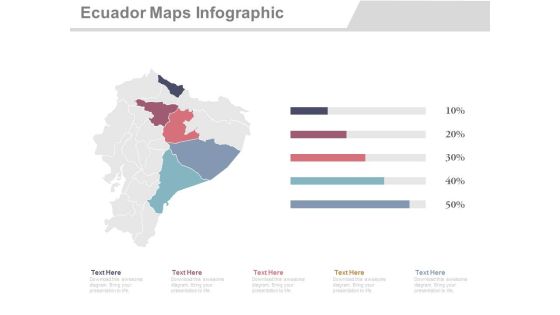
Ecuador Map With States Economic Analysis Powerpoint Slides
This PowerPoint template displays graphics of Ecuador map with different locations and percentage values. This Map template can be used in business presentations to depict economic analysis. This slide can also be used by school students for educational projects.

Four Balls On Scales For Comparison And Analysis Powerpoint Slides
This PowerPoint template has been designed with four balls on scales. You may download this PPT slide to depict comparison and analysis. Add this slide to your presentation and impress your superiors.
Four Arrows With Icons For Business Analysis Powerpoint Slides
This professional slide contains graphics of four arrows with icons. You may use this PowerPoint template for business analysis. Add this PPT slide to your presentation and impress your superiors.

Pie Charts For Percentage Value Analysis Powerpoint Slides
Our above PPT slide displays graphics of Pie charts. This PowerPoint template may be used to display percentage value analysis. Download this template to leave permanent impression on your audience.

Bar Graph For Profit Growth Analysis Powerpoint Slides
This PowerPoint template has been designed with bar graph with percentage values. This diagram is useful to exhibit profit growth analysis. This diagram slide can be used to make impressive presentations.

Bar Graph For Yearly Statistical Analysis Powerpoint Slides
This PowerPoint template has been designed with bar graph. This PowerPoint diagram is useful to exhibit yearly statistical analysis. This diagram slide can be used to make impressive presentations.
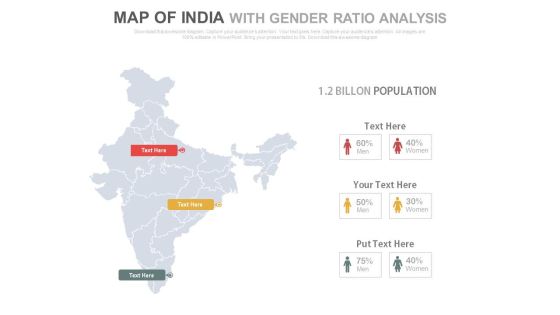
India Map Of With Gender Ratio Analysis Powerpoint Slides
This PowerPoint template displays graphics of India map with male female icons. This Map template can be used in presentations to depict gender ratio analysis. This slide can also be used by school students for educational projects.

World Map With Global Economic Analysis Powerpoint Slides
This PowerPoint template has been designed with graphics of world map. You can download this diagram to exhibit global business analysis. Above PPT slide is suitable for business presentation.

Five Year Tags Analysis Timeline Diagram Powerpoint Slides
This PowerPoint template has been designed with five years tags. This PPT slide may be helpful to display year based business analysis. Download this PowerPoint timeline template to make impressive presentations.
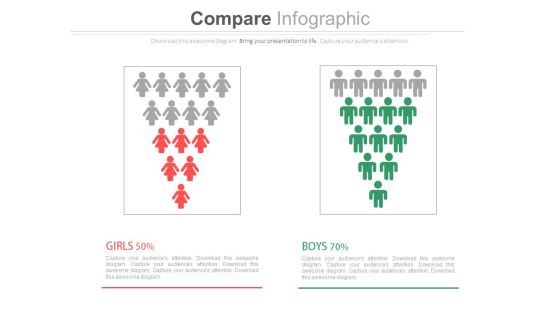
Male Female Gender Ratio Analysis Comparison Chart Powerpoint Slides
This PowerPoint template has been designed with graphics of male and female icons. Download this PPT slide to depict gender ratio analysis. Grab the attention of your team with this eye catching template.

Two Test Tubes For Compare Analysis Powerpoint Slides
This PPT slide contains graphics of two test tubes. Download this PowerPoint template for comparison and analysis. Deliver amazing presentations to mesmerize your audience by using this PPT slide design.

Bar Graph On Blackboard For Growth Analysis Powerpoint Template
Visually support your presentation with our above template containing bar graph on blackboard. This PowerPoint template helps to display growth analysis. Etch your views in the brains of your audience with this diagram slide.

Circular Diagram For Business Deal And Growth Analysis Powerpoint Template
This PowerPoint template has been designed with graphics of circular diagram. You may download this PPT diagram slide to display business deal and growth analysis. Chart the course you intend to take with this slide

Four Banners For Business Growth Analysis Powerpoint Template
This PPT slide contains graphics of four banners with icons. Download this diagram slide to display business growth analysis. This diagram is editable you can edit text, color, shade and style as per you need.
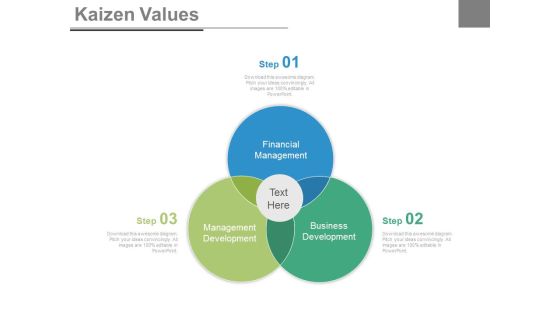
Venn Diagram For Kaizen Values Analysis Powerpoint Slides
This power point template has been designed with graphic of Venn diagram. Use this Venn diagram to display kaizen value analysis. Illustrate your ideas and imprint them in the minds of your team with this template.

Finland Map With Economic Data Analysis Powerpoint Slides
This PowerPoint template has been designed with Finland Map and areas highlighted. You may use this slide to display financial strategy analysis. This diagram provides an effective way of displaying information you can edit text, color, shade and style as per you need.
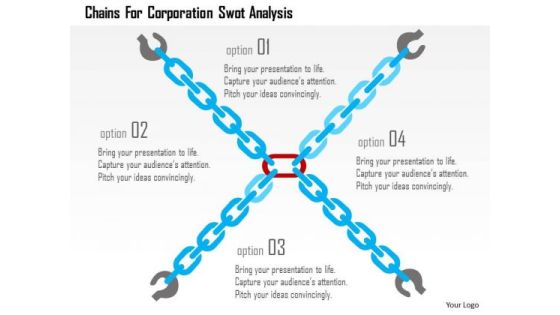
Business Diagram Chains For Corporation Swot Analysis Presentation Template
This image is designed with four interconnected chains graphics. You can use this slide to present SWOT analysis. This diagram provides an effective way of displaying information you can edit text, color, shade and style as per you need. Present your views using this innovative slide and be assured of leaving a lasting impression

Business Target Analysis Timeline With Year Tags Powerpoint Slides
This timeline slide design can be used for project planning and project management. It contains time line diagram with years tags. This timeline template can be used in presentations where you need to display a roadmap or it may be used for business target analysis.

Four Staged Linear Timeline For Growth Analysis Powerpoint Slides
This timeline slide design can be used to display yearly business growth. It contains timeline diagram with four years. This timeline template can be used in presentations where you need to display a roadmap or it may be used for business target analysis.
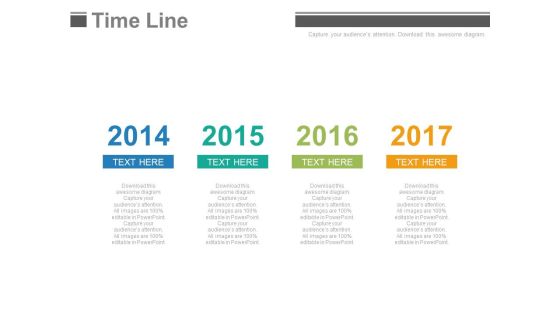
Year Base Timeline For Business Strategy And Analysis Powerpoint Slides
This PowerPoint template has been designed with year based timeline diagram. This timeline template can be used in presentations where you need to display business strategy and analysis. You can modify the template like add new milestones and tasks, or change the colors and shapes.

Year Based Linear Timeline For Sales Analysis Powerpoint Slides
This PowerPoint template has been designed with linear timeline diagram. This timeline template can be used in presentations where you need to display sales planning and analysis. You can modify the template like add new milestones and tasks, or change the colors and shapes.
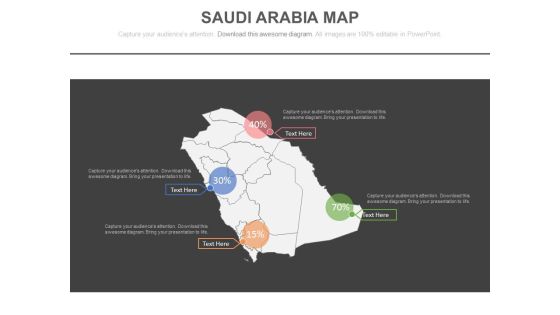
Saudi Arabia Map For Financial Strategy Analysis Powerpoint Slides
This PowerPoint template has been designed with Saudi Arabia Map. You may use this slide to display financial strategy analysis. This diagram provides an effective way of displaying information you can edit text, color, shade and style as per you need.
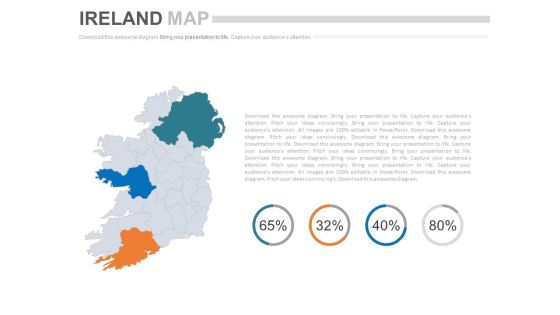
Ireland Map With Financial Ratio Analysis Powerpoint Slides
This PowerPoint template has been designed with Ireland Map and areas highlighted. You may use this slide to display financial strategy analysis. This diagram provides an effective way of displaying information you can edit text, color, shade and style as per you need.

Map Of India With Population Analysis Powerpoint Slides
This PowerPoint template has been designed with graphics of India map. You may use this slide to display population analysis. This diagram provides an effective way of displaying information you can edit text, color, shade and style as per you need.

Three Teams Skill Analysis Comparison Chart Powerpoint Slides
Create visually stunning and define your PPT presentations in a unique and inspiring manner using our above template. It contains graphics of comparison chart. This business slide helps to display teams skill analysis. Deliver amazing presentations to mesmerize your audience by using this PPT slide design.

Venn Diagram For Business Deal And Analysis Powerpoint Slides
This power point template contains graphic of two circles with handshake and bar chart icons. Use this Venn diagram for business deal planning and strategy analysis. Illustrate your ideas and imprint them in the minds of your team with this template.

Industry Analysis To Understand Business Position Among Competitors Diagrams PDF
This slide provides overview of industry analysis, evaluating business culture of competitors to understand business position among relative participants in market. It includes key components such as employee retention rate, recruitment cost, employee satisfaction rate and employee turnover rate. great for business strategies, office conferences, capital raising or task suggestions. If you desire to acquire more customers for your tech business and ensure they stay satisfied, create your own sales presentation with these plain slides.
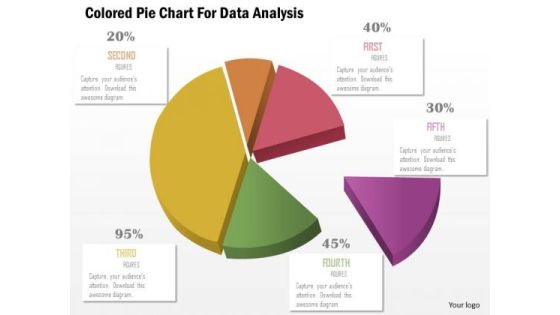
Business Diagram Colored Pie Chart For Data Analysis Presentation Template
This business slide displays pie chart. This diagram is a data visualization tool that gives you a simple way to present statistical information. This slide helps your audience examine and interpret the data you present.
Business Diagram Up Down Slider For Data Analysis Presentation Template
This business diagram has been designed with graphics of slider. You may download this professional slide to display data trends. Transmit your thoughts via this slide.

Abc Steps Chart For Data Analysis Powerpoint Slides
Our above PPT slide contains graphics of ABC steps chart. This business diagram helps to depict business information for strategic management. Use this diagram to impart more clarity to data and to create more sound impact on viewers.
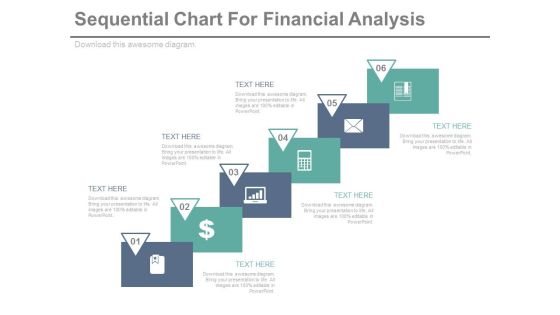
Sequential Steps Chart For Data Analysis Powerpoint Slides
This PowerPoint template has been designed sequential steps chart with icons. This PPT slide can be used to display corporate level financial strategy. You can download finance PowerPoint template to prepare awesome presentations.
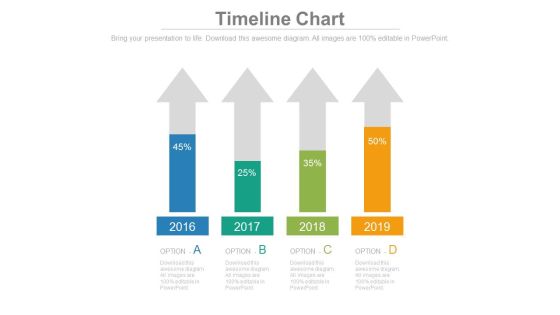
Four Arrows With Percentage Data Analysis Powerpoint Slides
This timeline template can be used for multiple purposes including financial planning, new milestones and tasks. It contains four upward arrows with percentage values. Download this PowerPoint timeline template to make impressive presentations.

Bar Graph Of Lego Blocks For Data Analysis Powerpoint Slides
This PowerPoint template contains bar graph made of Lego blocks. You may use this slide to display growth process. This diagram provides an effective way of displaying information you can edit text, color, shade and style as per you need.

Retirement Income Analysis Ppt PowerPoint Presentation Complete Deck With Slides
This complete presentation has PPT slides on wide range of topics highlighting the core areas of your business needs. It has professionally designed templates with relevant visuals and subject driven content. This presentation deck has total of fifty seven slides. Get access to the customizable templates. Our designers have created editable templates for your convenience. You can edit the colour, text and font size as per your need. You can add or delete the content if required. You are just a click to away to have this ready made presentation. Click the download button now.

Merchandising Industry Analysis Ppt PowerPoint Presentation Complete Deck With Slides
This complete presentation has PPT slides on wide range of topics highlighting the core areas of your business needs. It has professionally designed templates with relevant visuals and subject driven content. This presentation deck has total of sixty seven slides. Get access to the customizable templates. Our designers have created editable templates for your convenience. You can edit the colour, text and font size as per your need. You can add or delete the content if required. You are just a click to away to have this ready made presentation. Click the download button now.

Business Analysis Method Ppt PowerPoint Presentation Complete Deck With Slides
This complete presentation has PPT slides on wide range of topics highlighting the core areas of your business needs. It has professionally designed templates with relevant visuals and subject driven content. This presentation deck has total of one hundred two slides. Get access to the customizable templates. Our designers have created editable templates for your convenience. You can edit the colour, text and font size as per your need. You can add or delete the content if required. You are just a click to away to have this ready made presentation. Click the download button now.
Business Diagram Tablet With Icons For Analysis Presentation Template
Download this diagram to display concept of technology. This business diagram contains the graphic of tablet with icons. Use this template to highlight the key issues of your presentation.
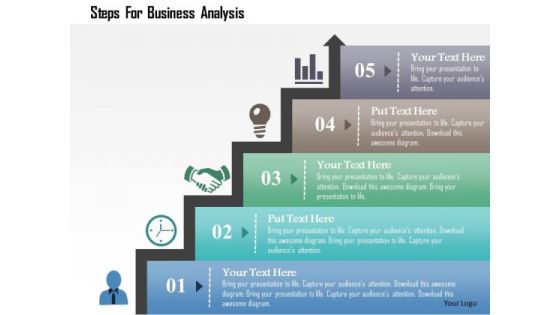
Business Diagram Steps For Business Analysis Presentation Template
Concept of time management has been defined in this power point template diagram. This diagram contains the graphic of bar graph. Amplify your thoughts via this appropriate business template.

Competitor Analysis And Seo Strategy Template Ppt Images
This is a change management key points ppt powerpoint slides show. This is a five stage process. The stages in this process are link building, select keywords, competitor keywords, combine keywords, add keywords, submit pages to search engines, community intent, check search engine ranking.

Tablet For Finance Planning And Analysis PowerPoint Template
Our professionally designed business diagram is as an effective tool for communicating ideas and planning. It contains graphics of tablet with various symbols. Convey your views with this diagram slide. It will amplify the strength of your logic.

Diagram Of Market Research And Analysis Powerpoint Template
Our above PPT slide contains circular web diagram with men icon in center holding megaphone. This business diagram helps to exhibit business strategic model design. Use this diagram to impart more clarity to subject and to create more sound impact on viewers.

Tablet With Charts For Business Analysis Powerpoint Templates
Our compelling template consists with a design of four gear tags and icons. This slide has been professionally designed to exhibit process control. This template offers an excellent background to build impressive presentation.
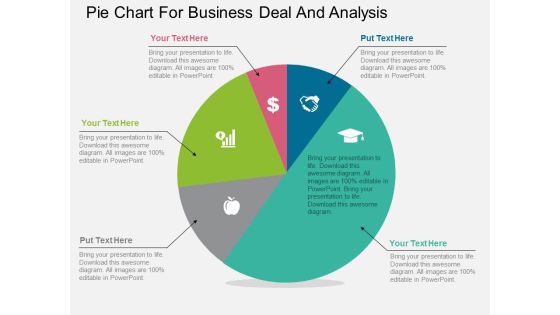
Pie Chart For Business Deal And Analysis Powerpoint Template
Our above PPT slide contains diagram of pentagon infographic. It helps to display steps of corporate marketing. Use this diagram to impart more clarity to data and to create more sound impact on viewers.
Five Key Steps For Business Analysis Powerpoint Template
This PowerPoint template has been designed with five icons around key. This PowerPoint template helps to exhibit directions for strategic planning. Use this diagram slide to build an exclusive presentation.

Graph Analysis Arrow Business PowerPoint Templates And PowerPoint Backgrounds 0211
Microsoft PowerPoint Template and Background with a man analyzing a graph showing growth

Swot Analysis Business PowerPoint Templates And PowerPoint Backgrounds 0811
Microsoft PowerPoint Template and Background with a set of project management buttons

Graph Analysis Arrow Business PowerPoint Themes And PowerPoint Slides 0211
Microsoft PowerPoint Theme and Slide with a man analyzing a graph showing growth

Swot Analysis Business PowerPoint Themes And PowerPoint Slides 0811
Microsoft PowerPoint Theme and slide with a set of project management buttons
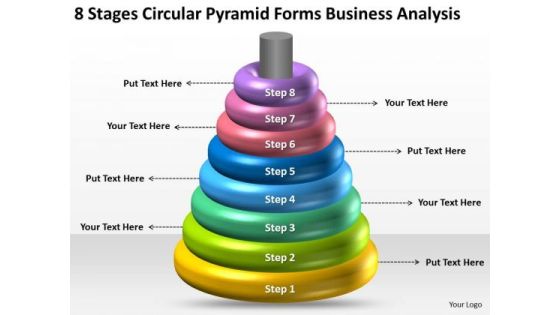
Circular Pyramid Forms Business Analysis Ppt Professional Plans PowerPoint Templates
We present our circular_pyramid_forms_business_analysis_ppt_professional_plans_PowerPoint_templates.Present our Process and Flows PowerPoint Templates because They will Put the wind in your sails. Skim smoothly over the choppy waters of the market. Use our Circle Charts PowerPoint Templates because Our PowerPoint Templates and Slides will definately Enhance the stature of your presentation. Adorn the beauty of your thoughts with their colourful backgrounds. Present our Business PowerPoint Templates because Our PowerPoint Templates and Slides offer you the widest possible range of options. Download and present our Marketing PowerPoint Templates because Watching this your Audience will Grab their eyeballs, they wont even blink. Present our Shapes PowerPoint Templates because Our PowerPoint Templates and Slides are created with admirable insight. Use them and give your group
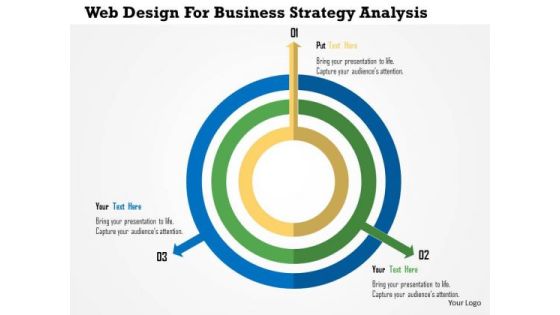
Business Diagram Web Design For Business Strategy Analysis Presentation Template
This business diagram has been designed with concentric circles with three arrows. This slide displays three steps of business process. Download this diagram slide to make professional presentations.

Bank Bar Graph Business Deal Result Analysis Ppt Slides Graphics
This power point icon slide has been designed with four different icons. Icons of bank, bar graph and business deal have been displayed in this slide. Use these icons in your presentations to add professional impact.

Five Vertical Steps For Agenda Analysis Powerpoint Slides
This PPT slide contains five vertical steps diagram. Download this PowerPoint template to depict agenda points in informative and descriptive manner. Deliver amazing presentations to mesmerize your audience by using this agenda slide design.
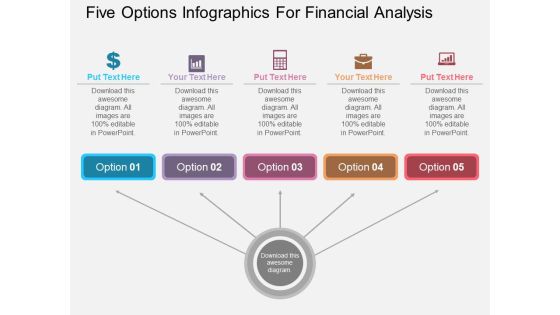
Five Options Infographics For Financial Analysis Powerpoint Template
Visually support your presentation with our above template showing five options infographic. This slide has been professionally designed to present money and finance management. This template offers an excellent background to build impressive presentation.

Management Meeting For Business Agenda Analysis Powerpoint Template
Our professionally designed business diagram is as an effective tool for communicating ideas and planning. It contains diagram of management meeting. Convey innovative ideas relating to business agenda using this PPT slide.
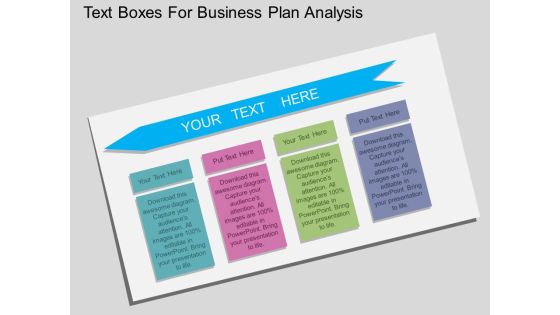
Text Boxes For Business Plan Analysis Powerpoint Template
This PowerPoint template contains diagram of four text boxes. You may download this slide to present quick marketing plan. Use this PPT diagram slide to organize the logic of your views.
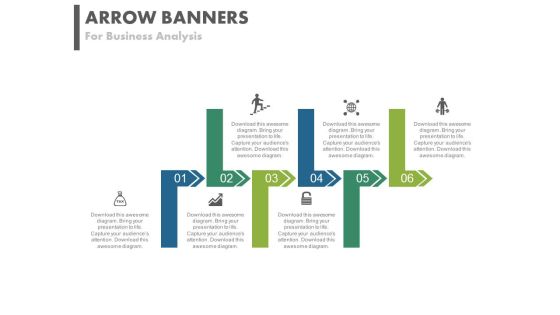
Six Arrows For Global Business Growth And Analysis Powerpoint Template
Deliver amazing presentations with our above template showing six arrow tags with icons. You may download this PPT slide to organize information. Capture the attention of your audience using this PPT diagram slide.
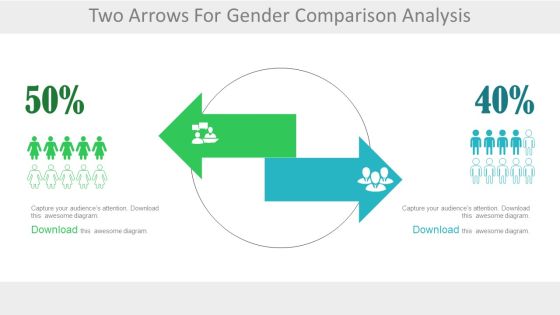
Two Arrows For Male Female Ratio Analysis Powerpoint Slides
Use this professionally created PowerPoint template to create the perfect slide to educate your audience about comparisons between choices and opinions of different genders. The slide can be used to denote the sex ratio or the changes occurring in the same. The 2 colored arrows can be used to refer to the 2 genders or even 2 teams or groups. This slide can be effectively used in corporate or business presentations to demonstrate the conversion of probable customers to sale. Other concepts like brain drain or brand preference or people making different choices can also be demonstrated using this template. A human resource manager can use this slide to demonstrate the transfer of employees to other locations or companies.
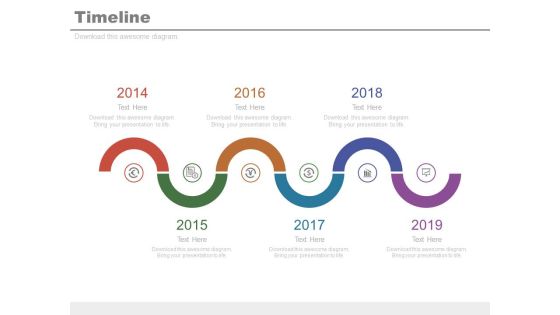
Six Staged Spiral Timeline For Financial Analysis Powerpoint Slides
This infographic template contains graphics of six staged spiral timeline diagram. This PPT slide may be helpful to display financial strategy timeline. Download this PowerPoint timeline template to make impressive presentations.

Banners With Icons For Information Analysis Powerpoint Templates
Communicate with your group through this slide of banners. It will facilitate understanding of your views. This diagram can be used to explain the process steps in business presentations.
Upward Arrow With Growth Analysis Icons PowerPoint Slides
Now talk about your company?s growth in a more creative manner. This innovatively designed PPT slide will help you. Show your company?s growth to your colleagues or to your clients with the help of this slide. Two step arrows clearly depicts the achievements of the organization. You can also use this slide to show how high you are aiming or your company. This diagram has two icons in it which are editable. You can also add color of your own choice in the diagram. Use this PowerPoint template and let world see your achievements.

World Map With Gender Ratio Analysis PowerPoint Slides
This slide can be the perfect slide to demonstrate the comparison or changes between the different genders. This PowerPoint slide will be useful to show the ratio of males and females in different parts of the world. Have business abroad? Let your clients and investors know that visually. Above is the PowerPoint slide which can help you explain where all you have your empire. Now isn?t this great. Well yes. You can also use the above template to tell your colleagues or teammates about the places or countries where you plan to further expand your business or open a franchise. This would be an apt background template if you have tourism business. This PPT template is completely customizable. You can adjust the icons present in the slide. Color, icon and text can be modified the way you want. Download this and include it in your presentation to make it more impactful than before.
Progressive Arrows With Icons For Growth Analysis Powerpoint Slides
This PowerPoint template has been designed with diagram of progressive arrows with icons. The PowerPoint template has a high quality design. You can download this PowerPoint slide for corporate presentations or annual meeting and business plans.

Corporate Vision And Mission Analysis Diagram Powerpoint Slides
This PPT slide contains corporate vision diagram slide. Use this PPT slide to depict companys vision and strategy. This PowerPoint template can be customized as per your requirements.

Bar Graph With Line Chart For Analysis Powerpoint Slides
This PowerPoint template contains design of bar graph with line chart. You may download this slide to display strategy steps for business growth. You can easily customize this template to make it more unique as per your need.

Circle Infographics For Market Research Analysis Powerpoint Template
This PowerPoint template has been designed with circular infographic diagram. You can use this PPT diagram slide to visually support your content. Above slide is suitable for business presentation.
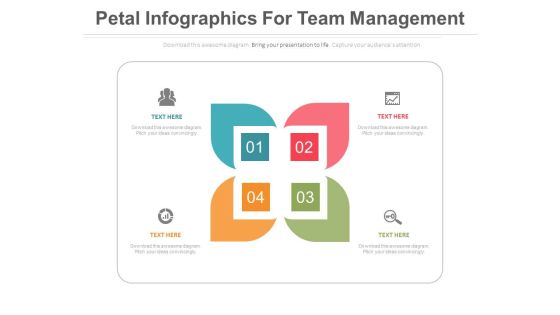
Petal Infographics For Value Chain Analysis Powerpoint Template
This business slide contains diagram of petals infographic. This diagram provides schematic representation of any information. Visual effect this slide helps in maintaining the flow of the discussion and provides more clarity to the subject.
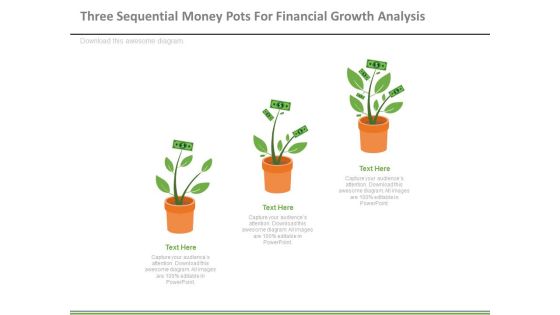
Money Plants For Financial Growth Analysis Powerpoint Slides
This PowerPoint slide contains graphics of three money plants. This professional slide may be used to display ideas for financial growth. Use this template to highlight to make impressive presentations.
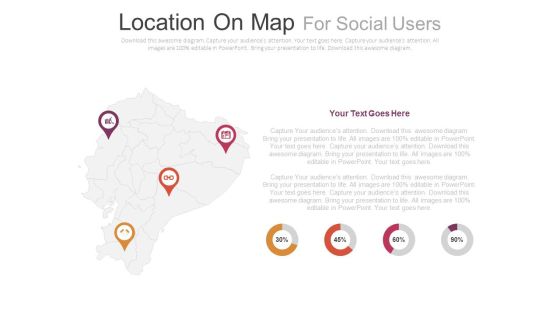
Four Locations On Map With Percentage Analysis Powerpoint Slides
This PowerPoint slide contains diagram of map with location pointers and icons. This professional slide helps to exhibit demographics of social media users. Use this PowerPoint template to make impressive presentations.
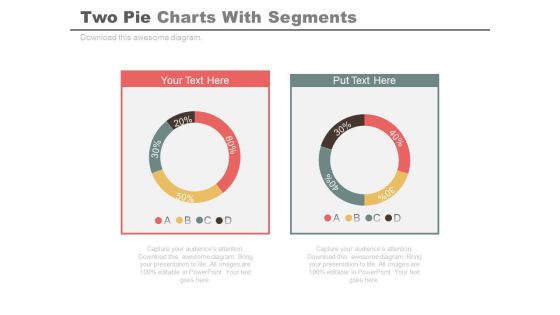
Two Pie Charts For Comparison And Analysis Powerpoint Slides
Develop competitive advantage with our above template of two pie charts. This PowerPoint diagram provides an effective way of displaying business information. You can edit text, color, shade and style as per you need.

Nine Points Of Business Agenda Analysis Powerpoint Slides
This PowerPoint template has been designed with list of nine agenda points. Download this PPT slide to keep discussions focused on relevant topics and to work through the items listed on the agenda. Deliver amazing presentations to mesmerize your audience by using this agenda slide design.
 Home
Home