Analysis

Business Diagram Infographic For Business Analysis Presentation Template
This business diagram contains business infographic. Our professionally designed business diagram helps to depict business analysis. Enlighten your audience with your breathtaking ideas.

Venn Circles Infographic For Financial Analysis PowerPoint Templates
This PowerPoint template has been designed with Venn circles infographic. This infographic template useful for financial analysis. Accelerate the impact of your ideas using this template.
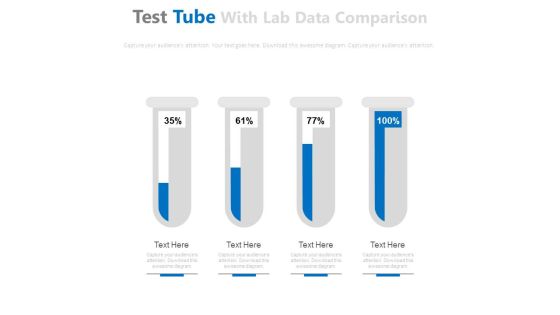
Test Tubes For Financial Ratio Analysis Powerpoint Slides
This PowerPoint template has been designed with graphics of test tubes. Use this PPT slide to depict financial ratio analysis. Download this PPT template to make impressive presentations.

Infographic Diagram For Business Process Analysis Powerpoint Slides
This PowerPoint slide contains business infographic diagram. This professional slide may be used to display business process analysis. Use this business template to make impressive presentations.

World Map For Global Business Analysis Powerpoint Slides
This professionally designed PowerPoint template displays diagram of world map. You can download this diagram to exhibit global business analysis. Above PPT slide is suitable for business presentation.

Venn Diagram For Business Intelligence And Predictive Analysis Powerpoint Slides
This power point template has been designed with two steps Venn diagram. Use this Venn diagram for business intelligence and predictive analysis. Illustrate your ideas and imprint them in the minds of your team with this template.
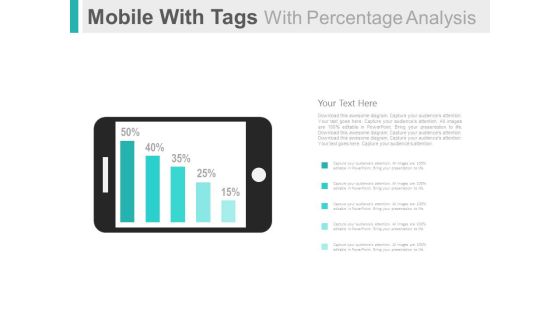
Mobile For Online Survey And Analysis Powerpoint Slides
This PowerPoint template has been designed with graphics of mobile and percentage bar graph. This PPT slide can be used to display online survey and analysis. You can download finance PowerPoint template to prepare awesome presentations.

Dashboard To Simplify Business Data Analysis Powerpoint Slides
This PowerPoint template graphics of meter chart. Download this PPT chart to simplify business data analysis. This PowerPoint slide is of great help in the business sector to make realistic presentations and provides effective way of presenting your newer thoughts.

Data Driven Comparison Charts For Analysis Powerpoint Slides
You can download this PowerPoint template to display statistical data and analysis. This PPT slide contains data driven comparison charts. Draw an innovative business idea using this professional diagram.

Three Arrow Tags For Data Analysis PowerPoint Template
Our professionally designed business diagram is as an effective tool to display data analysis. It contains graphics of three arrow tags. This template is specifically created to highlight you points.

Five Steps For Data Compare And Analysis Powerpoint Template
Our above slide contains graphics of five steps chart. This PowerPoint template is useful for data compare and analysis. Use this diagram to impart more clarity to subject and to create more sound impact on viewers.
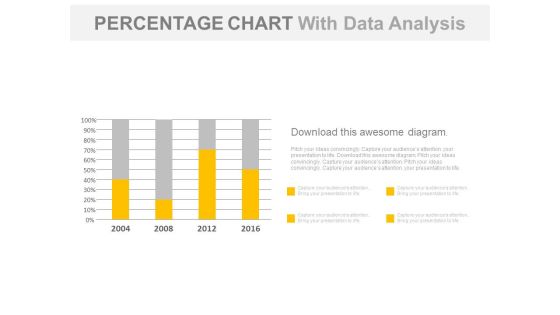
Year Based Chart With Percentage Data Analysis Powerpoint Slides
Our above business slide contains year based statistical chart. This PowerPoint template can be used to display percentage data analysis. Capture the attention of your audience with this slide.

Four Steps For Financial Data Analysis Powerpoint Slides
This PowerPoint contains four circles with percentage values. Download this diagram slide to display financial data analysis. This template is editable, You can edit text, color, shade and style of this diagram as per you need.

Finger Print Circuit For Security Analysis Powerpoint Template
This PowerPoint template has been designed with finder print circuit diagram. Download this diagram to display technology and security analysis. Download this diagram slide to make impressive yet unique presentations.
Idea Generation Process Control Growth Analysis Application PowerPoint Template
The template can be used to represent the concepts of idea generation, process control and growth analysis. Our above slide contains various icons for apps. Capture the attention of your audience.
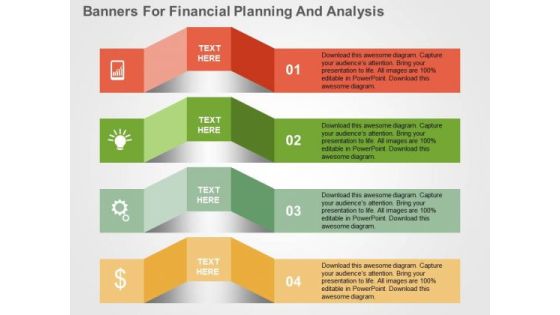
Banners For Financial Planning And Analysis PowerPoint Template
Visually support your presentation with our above template illustrating diagram of banners. It contains graphics of concepts of financial planning and analysis. Etch your views in the brains of your audience with this diagram slide.

Test Tubes And Beaker For Ratio Analysis Powerpoint Template
Visually support your presentation with our above template containing diagram of test tubes and beaker. This diagram is excellent visual tools for explaining ratio analysis. Use this diagram to make interactive presentations.
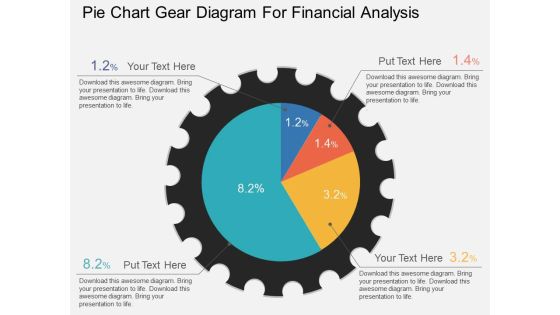
Pie Chart Gear Diagram For Financial Analysis Powerpoint Template
This PowerPoint template has been designed with graphic of pie chart gear diagram. This PPT slide can be used to display financial analysis. Download this PPT diagram slide to make your presentations more effective.

Pie Charts For Financial Ratio Analysis Powerpoint Slides
This PowerPoint template has been designed with diagram of pie charts. This PPT slide can be used to prepare presentations for profit growth report and also for financial data analysis. You can download finance PowerPoint template to prepare awesome presentations.

Board With Bar Graph For Financial Analysis Powerpoint Slides
You can download this PowerPoint template to display statistical data and analysis. This PPT slide contains display board with bar graph. Draw an innovative business idea using this professional diagram.

Business Diagram Colorful Gear For Swot Analysis Presentation Template
This business slide has been designed with graphics of colorful gear divided into four parts. Download this diagram to present SWOT analysis. Cement your ideas in the minds of your listeners with this slide.

Business Diagram Test Tubes For Research And Analysis Presentation Template
This diagram is suitable for research and analysis. This diagram template contains the graphic of test tubes. Adjust the above diagram into your Presentations to visually support your contents.

Timeline With Year Based Analysis And Business Apps PowerPoint Template
Create dynamic presentations with our professional template containing graphics of timeline with business icons. This diagram may be used to display planning and analysis. Download this template to leave permanent impression on your audience.

Pie Chart On Magnifying Glass For Business Analysis PowerPoint Template
Visually support your presentation with our above template showing pie chart on magnifying glass. This slide has been professionally designed to emphasize the concept of market research and analysis. Deliver amazing presentations to mesmerize your audience.
Circles With Icons For Swot Analysis PowerPoint Template
Visually support your presentation with our above template showing four circles with icons. This slide has been professionally designed to present SWOT analysis. This template offers an excellent background to build impressive presentation.
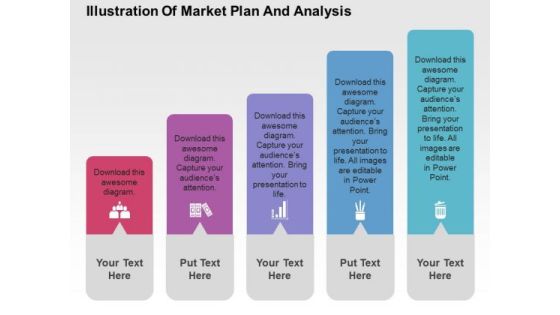
Illustration Of Market Plan And Analysis PowerPoint Templates
The above slide displays five text boxes with icons. This template has been designed to present market plan and analysis. Imprint your concepts with this PPT slide in your presentations.

Fish Bone For Cause And Effect Analysis PowerPoint Templates
This PPT slide has been designed with graphic fish bone diagram. Download this fishbone slide to present cause and effect analysis. Accelerate the impact of your ideas using this image.

Pie Chart For Financial Ratio Analysis PowerPoint Templates
Create visually amazing presentations with this slide of pie chart. This PPT slide of pie chart for financial ratio analysis. Add this diagram in your presentations to visually support your content.

Dashboard Diagram For Finance And Strategic Analysis Powerpoint Slides
This PowerPoint template display graphics of clock with arrows around it and dollar symbol in center. You may use this PPT slide for financial and strategic analysis. This dashboard slide may useful for multilevel status report creation and approval process.
Four Cubes For Financial Ratio Analysis Powerpoint Template
This business slide displays graphics of four cubes. This PPT slide has been designed to portray concept of financial ratio analysis. Download this PPT slide design to make interactive presentations.
Four Cubes For Fnancial Ratio Analysis Powerpoint Template
This business slide displays graphics of four cubes. This PPT slide has been designed to portray concept of financial ratio analysis. Download this PPT slide design to make interactive presentations.

Business Meeting For Planning And Analysis Powerpoint Template
Graphic of business meeting has been used to design this power point template diagram. This PPT diagram contains the concept of business planning and analysis. Use this PPT diagram for business and marketing related presentations.
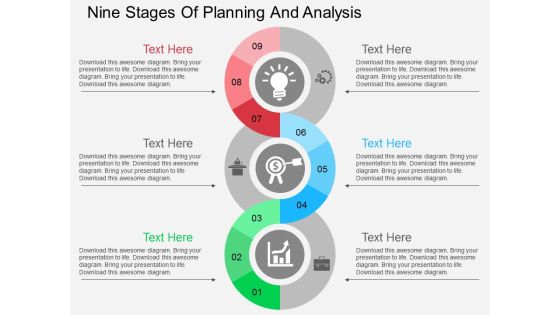
Nine Stages Of Planning And Analysis Powerpoint Templates
Our above business diagram has been designed with spiral info graphic diagram. This slide is suitable to present planning and analysis. Use this business diagram to present your work in a more smart and precise manner.

Alphabet Steps For Financial Strategy Analysis Powerpoint Slides
This PowerPoint template has been designed with alphabet steps with icons. This PPT slide may be used to display financial strategy analysis. Make outstanding business presentation with this template.
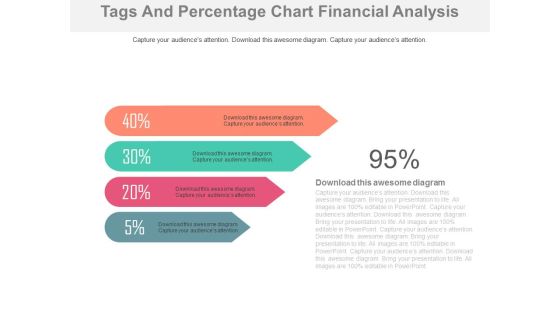
Four Percentage Tags For Financial Analysis Powerpoint Slides
This PowerPoint template contains design of four percentage tags. You may download this PPT slide to display financial analysis. You can easily customize this template to make it more unique as per your need.
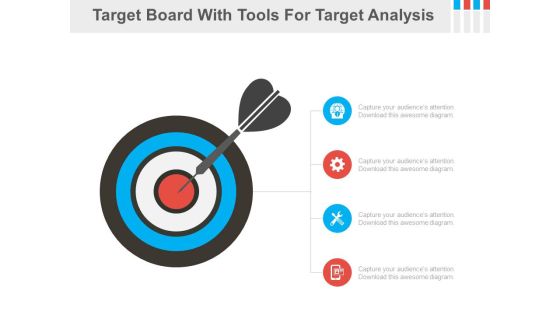
Four Tools For Marketing Target Analysis Powerpoint Slides
This PPT slide contains graphics of target board with four icons. You may download this PPT slide as tool for marketing target analysis. Impress your audiences by using this PPT slide.
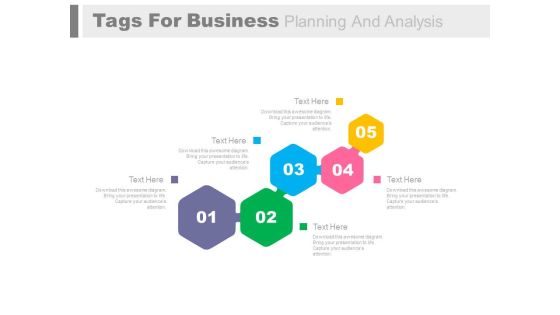
Five Steps For Business Process And Analysis Powerpoint Slides
Five steps process flow have been displayed in this business slide. This business diagram helps to exhibit business process and analysis. Use PowerPoint template to build an exclusive presentation.

Four Text Boxes For Swot Analysis Powerpoint Slides
This PPT slide has been designed with graphics of four steps text boxes diagram. This business diagram helps to exhibit SWOT analysis. Use this PowerPoint template to build an exclusive presentation.
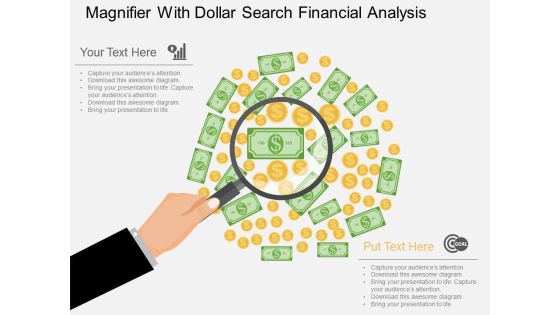
Magnifier With Dollar Search Financial Analysis Powerpoint Template
Our above business slide contains graphics of magnifier on dollar notes. This diagram can be used to display dollar search and financial analysis. Capture the attention of your audience with this professional slide.

Business Vision And Mission Strategy Analysis Powerpoint Slides
This PowerPoint template displays pictures of corporate team member. You may download this PPT slide to depict corporate vision, mission and strategy analysis. Add this slide to your presentation and impress your superiors.

Linear Timeline Steps For Year Based Analysis Powerpoint Slides
This PowerPoint template has been designed with linear timeline steps. This PPT slide may be helpful to display year based business analysis. Download this PowerPoint timeline template to make impressive presentations.
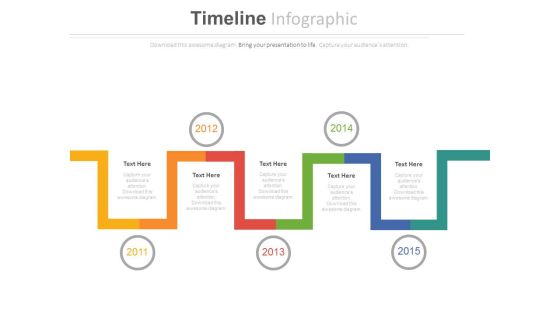
Timeline Steps For Year Based Analysis Powerpoint Slides
This PowerPoint timeline template can be used for multiple purposes including vision planning, new milestones and tasks. This PPT slide may be helpful to display timeline steps and year based analysis. Download this PowerPoint timeline template to make impressive presentations.

Bar Graph With Yearly Statistical Analysis Powerpoint Slides
This PowerPoint template contains diagram of bar graph with yearly percentage ratios. You may download this slide to display statistical analysis. You can easily customize this template to make it more unique as per your need.

Three Person Tags For Management Analysis Powerpoint Slides
This PowerPoint template has been designed with three persons tags. You may use this slide to display management analysis. Make your mark with this unique slide and create an impression that will endure.
Four Steps And Icons For Business Analysis Powerpoint Template
Our above PPT slide contains four steps with icons. This PowerPoint template helps to display business strategy and analysis. Use this diagram to impart more clarity to subject and to create more sound impact on viewers.

Bar Graph For Year Based Analysis Powerpoint Slides
This PowerPoint template has been designed with year based bar graph. This diagram may be used to display yearly statistical analysis. Use this PPT slide design to make impressive presentations.

Circle Chart With Percentage Value Analysis Powerpoint Slides
This PowerPoint template has been designed with circular process diagram. This business diagram helps to exhibit financial process control and analysis. Use this diagram to visually support your content.

Four Tags For Financial Review And Analysis Powerpoint Slides
This PowerPoint template has been designed with four tags and financial values. This PowerPoint template helps to exhibit financial review and analysis. Use this diagram slide to build an exclusive presentation.

Pie Chart For Financial Ratio Analysis Powerpoint Slides
This PPT slide contains graphics of eight stage pie chart. Download this PowerPoint template slide for financial ratio analysis. This diagram is editable you can edit text, color, shade and style as per you need.

Five Bars For Marketing Research And Analysis Powerpoint Template
This business slide contains diagram of five colorful bars. This diagram provides schematic representation of marketing research and analysis. Visual effect this slide helps in maintaining the flow of the discussion and provides more clarity to the subject.
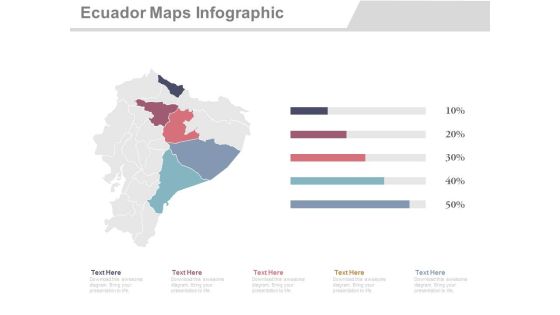
Ecuador Map With States Economic Analysis Powerpoint Slides
This PowerPoint template displays graphics of Ecuador map with different locations and percentage values. This Map template can be used in business presentations to depict economic analysis. This slide can also be used by school students for educational projects.

Four Balls On Scales For Comparison And Analysis Powerpoint Slides
This PowerPoint template has been designed with four balls on scales. You may download this PPT slide to depict comparison and analysis. Add this slide to your presentation and impress your superiors.
Four Arrows With Icons For Business Analysis Powerpoint Slides
This professional slide contains graphics of four arrows with icons. You may use this PowerPoint template for business analysis. Add this PPT slide to your presentation and impress your superiors.

Pie Charts For Percentage Value Analysis Powerpoint Slides
Our above PPT slide displays graphics of Pie charts. This PowerPoint template may be used to display percentage value analysis. Download this template to leave permanent impression on your audience.

Bar Graph For Profit Growth Analysis Powerpoint Slides
This PowerPoint template has been designed with bar graph with percentage values. This diagram is useful to exhibit profit growth analysis. This diagram slide can be used to make impressive presentations.

Bar Graph For Yearly Statistical Analysis Powerpoint Slides
This PowerPoint template has been designed with bar graph. This PowerPoint diagram is useful to exhibit yearly statistical analysis. This diagram slide can be used to make impressive presentations.
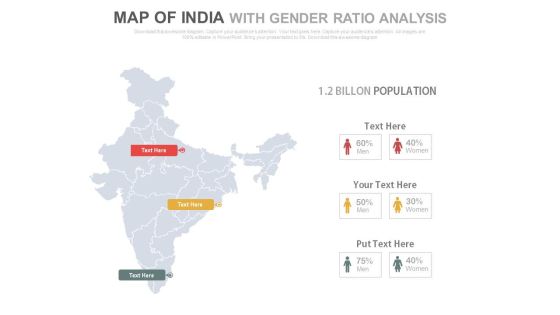
India Map Of With Gender Ratio Analysis Powerpoint Slides
This PowerPoint template displays graphics of India map with male female icons. This Map template can be used in presentations to depict gender ratio analysis. This slide can also be used by school students for educational projects.

World Map With Global Economic Analysis Powerpoint Slides
This PowerPoint template has been designed with graphics of world map. You can download this diagram to exhibit global business analysis. Above PPT slide is suitable for business presentation.

Five Year Tags Analysis Timeline Diagram Powerpoint Slides
This PowerPoint template has been designed with five years tags. This PPT slide may be helpful to display year based business analysis. Download this PowerPoint timeline template to make impressive presentations.
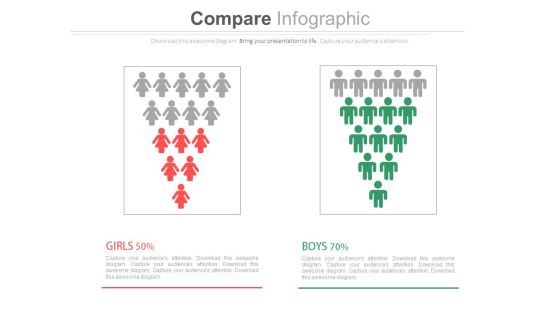
Male Female Gender Ratio Analysis Comparison Chart Powerpoint Slides
This PowerPoint template has been designed with graphics of male and female icons. Download this PPT slide to depict gender ratio analysis. Grab the attention of your team with this eye catching template.
 Home
Home