Analysis
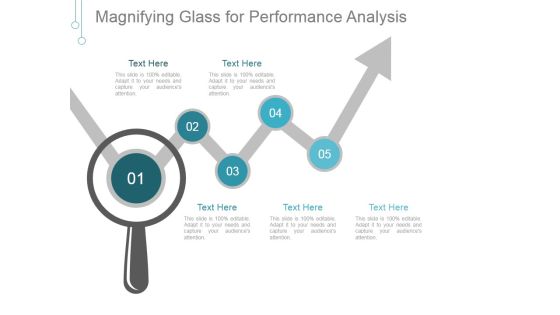
Magnifying Glass For Performance Analysis Ppt PowerPoint Presentation Slides
This is a magnifying glass for performance analysis ppt powerpoint presentation slides. This is a five stage process. The stages in this process are magnifying glass, arrows, management, marketing, business.
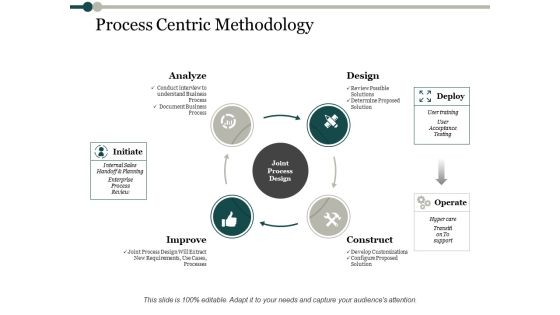
Process Centric Methodology Process Analysis Ppt PowerPoint Presentation Infographics Infographics
This is a process centric methodology process analysis ppt powerpoint presentation infographics infographics. This is a four stage process. The stages in this process are process centric methodology, design, construct, improve, analyze.
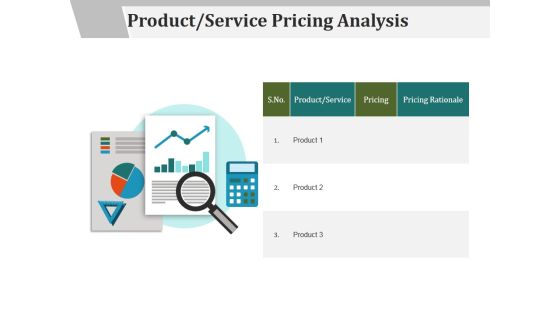
Product Service Pricing Analysis Ppt PowerPoint Presentation Styles Graphics Example
This is a product service pricing analysis ppt powerpoint presentation styles graphics example. This is a one stage process. The stages in this process are product service, pricing, pricing rationale.

Marketing Survey Analysis For Understanding Target Market Inspiration PDF
Persuade your audience using this Marketing Survey Analysis For Understanding Target Market Inspiration PDF. This PPT design covers three stages, thus making it a great tool to use. It also caters to a variety of topics including Marketing Survey Analysis, Understanding Target Market. Download this PPT design now to present a convincing pitch that not only emphasizes the topic but also showcases your presentation skills.
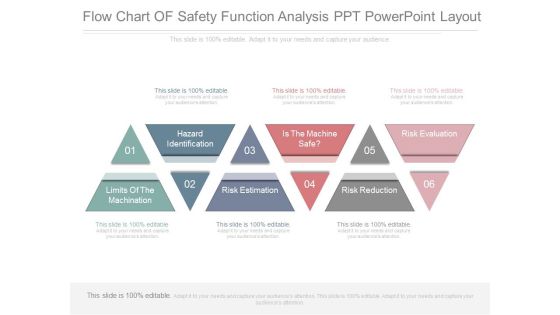
Flow Chart Of Safety Function Analysis Ppt Powerpoint Layout
This is a flow chart of safety function analysis ppt powerpoint layout. This is a six stage process. The stages in this process are hazard identification, limits of the machination, risk estimation, is the machine safe, risk reduction, risk evaluation.

Business Research And Analysis Ppt PowerPoint Presentation Ideas Graphics Design
This is a business research and analysis ppt powerpoint presentation ideas graphics design. This is a three stage process. The stages in this process are support, assistance, hand holding.

Competitor Profiling And Analysis Ppt PowerPoint Presentation Layouts
This is a competitor profiling and analysis ppt powerpoint presentation layouts. This is a five stage process. The stages in this process are founded, employees, experience, location, repeat business.
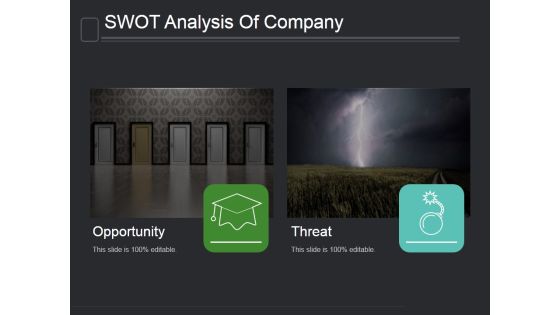
Swot Analysis Of Company Template 1 Ppt PowerPoint Presentation Template
This is a swot analysis of company template 1 ppt powerpoint presentation template. This is a two stage process. The stages in this process are opportunity, threat, strategy, management.
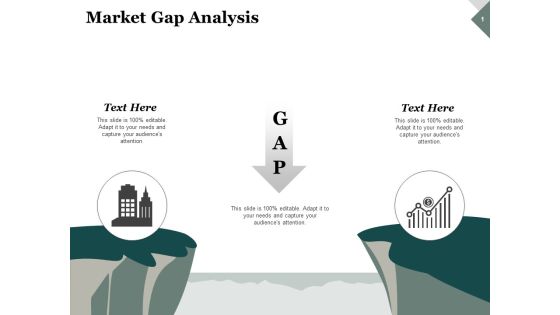
Market Gap Analysis Ppt PowerPoint Presentation Infographic Template Infographics
This is a market gap analysis ppt powerpoint presentation infographic template infographics. This is a two stage process. The stages in this process are business, planning, strategy, marketing, management.

Working Capital Analysis Supplier Management Ppt PowerPoint Presentation Model Grid
This is a working capital analysis supplier management ppt powerpoint presentation model grid. This is a nine stage process. The stages in this process are financial capital, working capital management, companys managerial accounting.
Cost Benefit Analysis Vector Icon Ppt PowerPoint Presentation Icon Designs
This is a cost benefit analysis vector icon ppt powerpoint presentation icon designs. This is a four stage process. The stages in this process are cost saving icon, expenses saving icon, cost reduction icon.
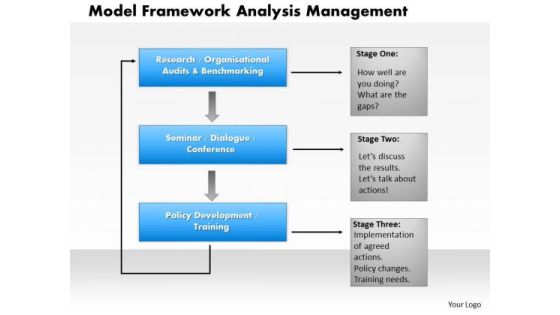
Business Framework Model Framework Analysis Management PowerPoint Presentation
A three layered framework flow chart has been used to design this business framework PPT. This PPT contains the concept of analysis management. Analyze any management system with this unique PPT and deliver a best presentation.
Mobile Data Analysis Vector Ppt PowerPoint Presentation Icon Slide
This is a mobile data analysis vector ppt powerpoint presentation icon slide. This is a four stage process. The stages in this process are mobile analytics, mobile tracking, mobile web analytics.

Mobile Data And Statistical Analysis Ppt PowerPoint Presentation Slides Portrait
This is a mobile data and statistical analysis ppt powerpoint presentation slides portrait. This is a two stage process. The stages in this process are mobile analytics, mobile tracking, mobile web analytics.
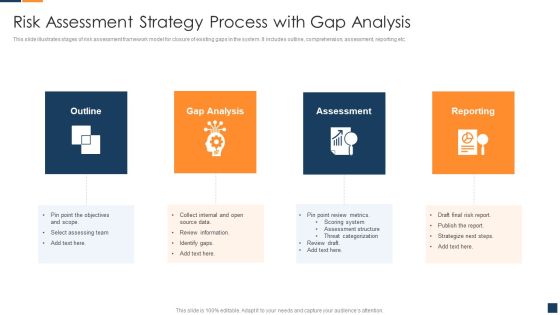
Risk Assessment Strategy Process With Gap Analysis Structure PDF
This slide illustrates stages of risk assessment framework model for closure of existing gaps in the system. It includes outline, comprehension, assessment, reporting etc. Presenting Risk Assessment Strategy Process With Gap Analysis Structure PDF to dispense important information. This template comprises four stages. It also presents valuable insights into the topics including Gap Analysis, Assessment, Reporting. This is a completely customizable PowerPoint theme that can be put to use immediately. So, download it and address the topic impactfully.

Enterprise Risk And Compliance Analysis Reporting Software Rules PDF
This slide showcases the impact of multi-dimensional risk factors on compliance and firm operations. It also includes a matrix depicting duration and rating of risk occurrences. Pitch your topic with ease and precision using this Enterprise Risk And Compliance Analysis Reporting Software Rules PDF. This layout presents information on Enterprise Risk, Compliance Analysis Reporting Software. It is also available for immediate download and adjustment. So, changes can be made in the color, design, graphics or any other component to create a unique layout.
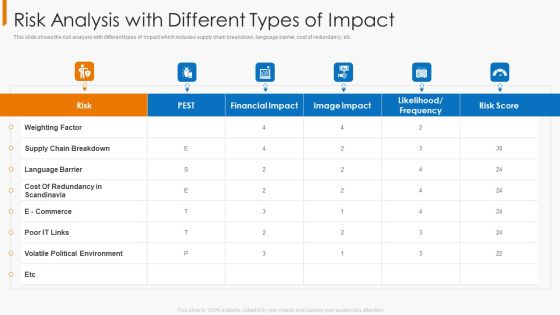
Risk Analysis With Different Types Of Impact Information PDF
This slide shows the risk analysis with different types of impact which includes supply chain breakdown, language barrier, cost of redundancy, etc. Deliver an awe inspiring pitch with this creative risk analysis with different types of impact information pdf bundle. Topics like financial impact, risk score, e commerce can be discussed with this completely editable template. It is available for immediate download depending on the needs and requirements of the user.

Hazard Analysis And Organizational Risk Assessment Grid Topics PDF
The following slide highlight the KPIs of organizational risks. It includes elements such as severity, consequences, likelihood highly unlikely, unlikely, possible, likely and very likely. Showcasing this set of slides titled Hazard Analysis And Organizational Risk Assessment Grid Topics PDF. The topics addressed in these templates are Hazard Analysis And Organizational, Risk Assessment Grid. All the content presented in this PPT design is completely editable. Download it and make adjustments in color, background, font etc. as per your unique business setting.
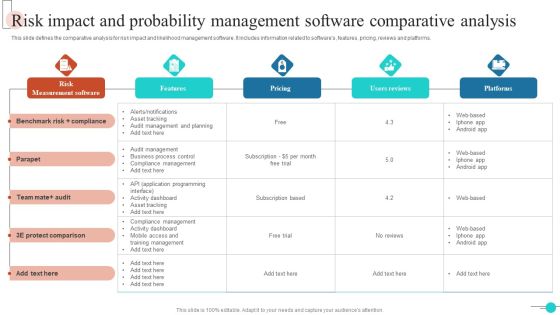
Risk Impact And Probability Management Software Comparative Analysis Mockup PDF
This slide defines the comparative analysis for risk impact and likelihood management software. It includes information related to softwares, features, pricing, reviews and platforms. Showcasing this set of slides titled Risk Impact And Probability Management Software Comparative Analysis Mockup PDF. The topics addressed in these templates are Benchmark Risk Compliance, Parapet, Team Mate Audit . All the content presented in this PPT design is completely editable. Download it and make adjustments in color, background, font etc. as per your unique business setting.
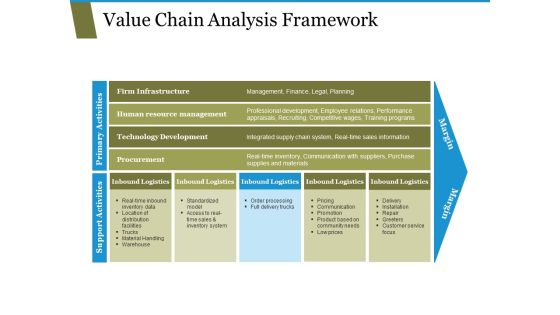
Value Chain Analysis Framework Ppt PowerPoint Presentation Infographic Template Themes
This is a value chain analysis framework ppt powerpoint presentation infographic template themes. This is a one stage process. The stages in this process are procurement, technology development, human resource management, infrastructure, inbound logistics.
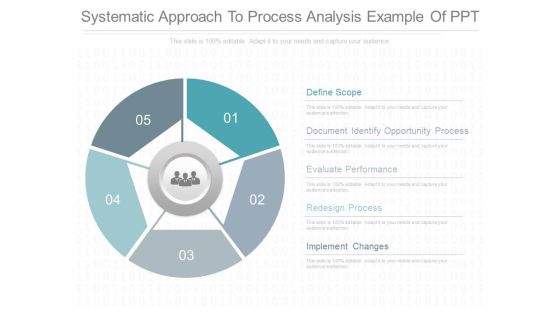
Systematic Approach To Process Analysis Example Of Ppt
This is a systematic approach to process analysis example of ppt. This is a five stage process. The stages in this process are define scope, document identify opportunity process, evaluate performance, redesign process, implement changes.
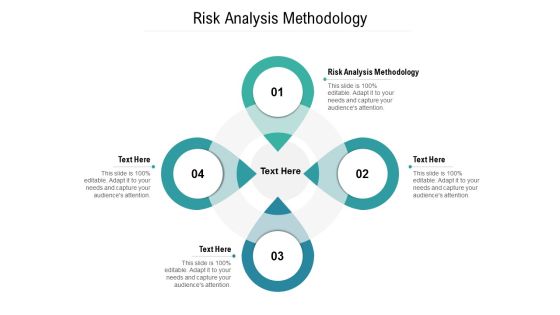
Risk Analysis Methodology Ppt PowerPoint Presentation Pictures Graphics Cpb
Presenting this set of slides with name risk analysis methodology ppt powerpoint presentation pictures graphics cpb. This is an editable Powerpoint four stages graphic that deals with topics like risk analysis methodology to help convey your message better graphically. This product is a premium product available for immediate download and is 100 percent editable in Powerpoint. Download this now and use it in your presentations to impress your audience.

Swot Analysis Of Company Template 2 Ppt PowerPoint Presentation Picture
This is a swot analysis of company template 2 ppt powerpoint presentation picture. This is a two stage process. The stages in this process are strength, weakness, icons, marketing, business.

Healthcare Company SEO Approach Perform Competitor Analysis Training Ppt
This slide covers competitor analysis as SEO strategy for healthcare industry. It also depicts that this research will assist businesses in better identifying opportunities and preparing for potential threats.
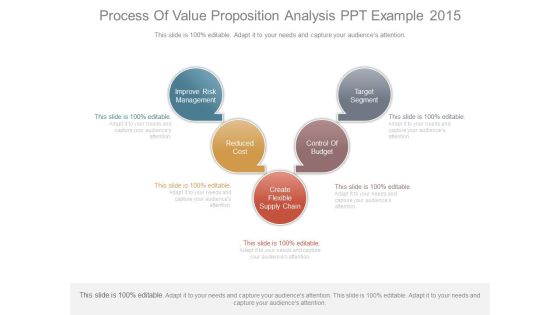
Process Of Value Proposition Analysis Ppt Example 2015
This is a process of value proposition analysis ppt example 2015. This is a five stage process. The stages in this process are improve risk management, reduced cost, create flexible supply chain, control of budget, target segment.

Gap Analysis Graph Ppt PowerPoint Presentation Slides Graphics Pictures
This is a gap analysis graph ppt powerpoint presentation slides graphics pictures. This is a five stage process. The stages in this process are revenue, time, high, low, risk.
Business Analysis Objectives And Strategy Diagram Presentation Portfolio
This is a business analysis objectives and strategy diagram presentation portfolio. This is a five stage process. The stages in this process are investigate solution, consider perspectives, analyze needs, evaluate options, define requirements.

Business Strategy And Objectives Business Analysis Process Model Ppt Icon
This is a business strategy and objectives business analysis process model ppt icon. This is a five stage process. The stages in this process are investigate solution, consider perspectives, analyze needs, evaluate options, define requirements, business strategy and objectives.

Business Operation Modeling Approaches Assumption And Constraint Analysis Pictures PDF
This slide provides the glimpse about the assumption and constraint analysis involved in project management which focuses on various proven false, affecting project and converting risks.Deliver an awe inspiring pitch with this creative business operation modeling approaches assumption and constraint analysis pictures pdf bundle. Topics like assumption or constraint, relevant shareholders, achieving the first milestone can be discussed with this completely editable template. It is available for immediate download depending on the needs and requirements of the user.

Proprietary Technology Expertise For Competition Analysis Powerpoint Slide Backgrounds
This is a proprietary technology expertise for competition analysis powerpoint slide backgrounds. This is a two stage process. The stages in this process are business, marketing, management, technology, strategy.
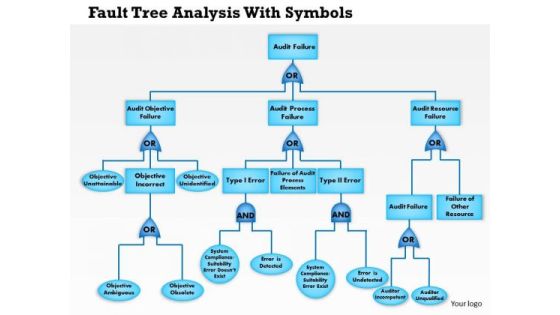
Business Framework Fault Tree Analysis With Symbols PowerPoint Presentation
Explain the concept of fault tree analysis with symbols. This business framework has been crafted with graphic of organizational chart. Use this PPT diagram for your audit objective and failure related topics.
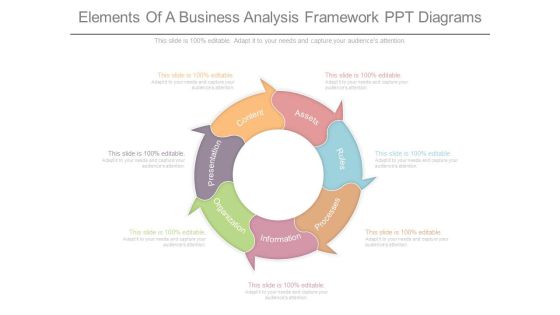
Elements Of A Business Analysis Framework Ppt Diagrams
This is an elements of a business analysis framework ppt diagrams. This is an seven stage process. The stages in this process are presentation, content, assets, rules, processes, information, organization.
Value Chain Analysis Framework Ppt PowerPoint Presentation Icon Graphics Tutorials
This is a value chain analysis framework ppt powerpoint presentation icon graphics tutorials. This is a one stage process. The stages in this process are primary activities, support activities, operations, outbound logistics, inbound logistics.
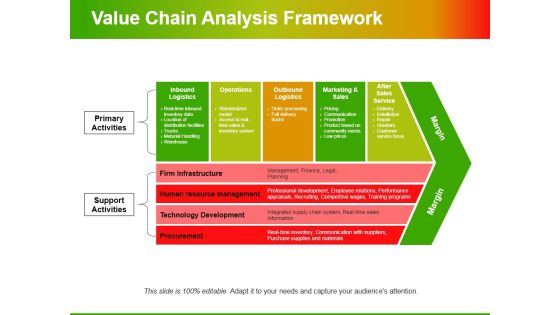
Value Chain Analysis Framework Ppt PowerPoint Presentation Infographic Template Shapes
This is a value chain analysis framework ppt powerpoint presentation infographic template shapes. This is a one stage process. The stages in this process are operations, after sales service, margin, firm infrastructure, primary activities.

Technology Trend Analysis Ppt PowerPoint Presentation Summary Sample
This is a technology trend analysis ppt powerpoint presentation summary sample. This is a five stage process. The stages in this process are adoption curve, crossing the chasm, hype cycle.

Data Collection Processing And Analysis Ppt PowerPoint Presentation Pictures Infographics
This is a data collection processing and analysis ppt powerpoint presentation pictures infographics. This is a five stage process. The stages in this process are data flow, data management, big data.

Big Data Sources Analysis Concept Diagram Template Powerpoint Slides
This is a big data sources analysis concept diagram template powerpoint slides. This is a eight stage process. The stages in this process are public web, data storage, social media, business app, machine data, sensor, archives.

Information Sources For Big Data Analysis Diagram Ppt Slides
This is a information sources for big data analysis diagram ppt slides. This is a three stage process. The stages in this process are big data, value, volume, velocity, variety, information sources.

Data Analysis Vector Icons Ppt Powerpoint Presentation Layouts Gridlines
This is a data analysis vector icons ppt powerpoint presentation layouts gridlines. This is a two stage process. The stages in this process are data presentation, content presentation, information presentation.
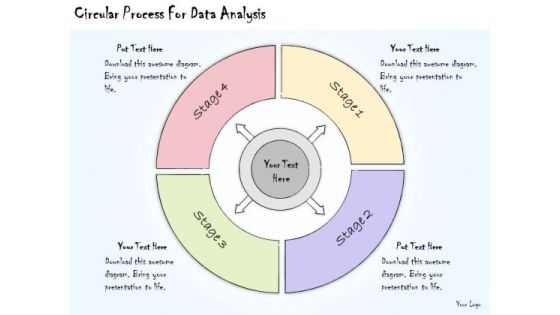
Ppt Slide Circular Process For Data Analysis Marketing Plan
Our PPT Slide circular process for data analysis marketing plan Powerpoint Templates Deliver At Your Doorstep. Let Them In For A Wonderful Experience. Dig Out The Dope With Our Business Plan Powerpoint Templates. Your Thoughts Will Expose The Truth.

Bar Graph For Data Distribution And Analysis Powerpoint Slides
This PowerPoint template has been designed with bar graph. This PowerPoint diagram is useful for data distribution and analysis This diagram slide can be used to make impressive presentations.

Big Data Source Analysis Ppt PowerPoint Presentation Ideas
This is a big data source analysis ppt powerpoint presentation ideas. This is a eight stage process. The stages in this process are images and media, click stream, social network, html, sensors, email.

Data Collection And Analysis Flow Chart Ppt PowerPoint Presentation Sample
This is a data collection and analysis flow chart ppt powerpoint presentation sample. This is a five stage process. The stages in this process are business, strategy, marketing, process, growth strategy, finance.

Mis For Data Analysis Ppt PowerPoint Presentation Pictures Graphics Download
This is a mis for data analysis ppt powerpoint presentation pictures graphics download. This is a three stage process. The stages in this process are management information system, mis, decision making system.

Data Collection And Analysis Ppt Powerpoint Presentation Icon Example Topics
This is a data collection and analysis ppt powerpoint presentation icon example topics. This is a four stage process. The stages in this process are productivity improvement, output improvement, productivity enhancement.

Demographics And Economic Development Analysis Ppt PowerPoint Presentation File Icon
This is a demographics and economic development analysis ppt powerpoint presentation file icon. This is a six stage process. The stages in this process are environmental scan, environmental study, environmental examine.
Environmental Analysis For Strategic Planning Ppt PowerPoint Presentation Icon Objects
This is a environmental analysis for strategic planning ppt powerpoint presentation icon objects. This is a five stage process. The stages in this process are environmental scan, environmental study, environmental examine.
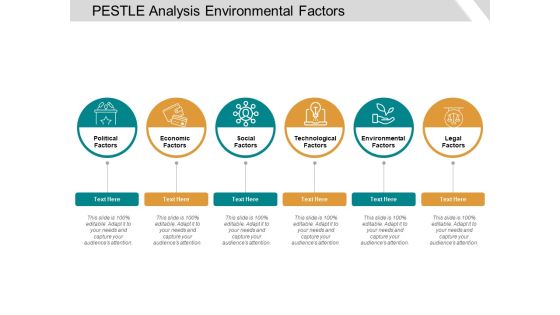
Pestle Analysis Environmental Factors Ppt PowerPoint Presentation Inspiration Visuals
This is a pestle analysis environmental factors ppt powerpoint presentation inspiration visuals. This is a six stage process. The stages in this process are environmental scan, environmental study, environmental examine.

Pestle Analysis For Business Planning Ppt PowerPoint Presentation Slides Model
This is a pestle analysis for business planning ppt powerpoint presentation slides model. This is a six stage process. The stages in this process are environmental scan, environmental study, environmental examine.

Business Analysis Methods And Toolkit Diagram Ppt Templates
This is a business analysis methods and toolkit diagram ppt templates. This is a four stage process. The stages in this process are methodologies, standards, tools, heuristics, guidelines, patterns, practices, rules, software products applications, notations, practices.

Product Analysis Ppt PowerPoint Presentation Infographics Graphic Images
This is a product analysis ppt powerpoint presentation infographics graphic images. This is a one stage process. The stages in this process are function, materials, cost, aesthetics, customer, environment, safety.

Business Analysis Chart Vector Icon Ppt PowerPoint Presentation Professional Display
This is a business analysis chart vector icon ppt powerpoint presentation professional display. This is a four stage process. The stages in this process are business marketing plan, business marketing strategies, business marketing approach.
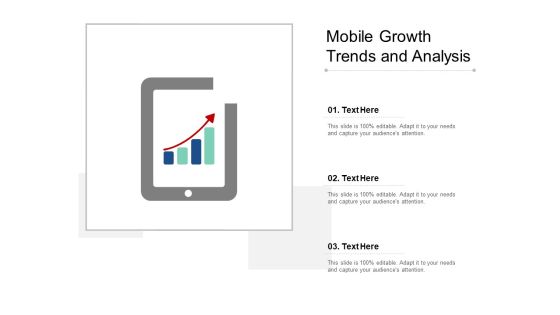
Mobile Growth Trends And Analysis Ppt PowerPoint Presentation File Graphics
This is a mobile growth trends and analysis ppt powerpoint presentation file graphics. This is a two stage process. The stages in this process are mobile analytics, mobile tracking, mobile web analytics.
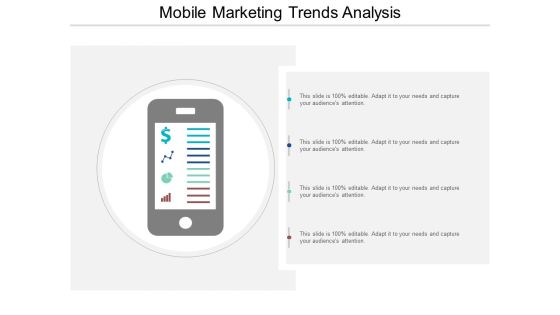
Mobile Marketing Trends Analysis Ppt PowerPoint Presentation Professional Example
This is a mobile marketing trends analysis ppt powerpoint presentation professional example. This is a four stage process. The stages in this process are mobile analytics, mobile tracking, mobile web analytics.

Business Kaizen Method Analysis Ppt Powerpoint Slide Designs
This is a business kaizen method analysis ppt powerpoint slide designs. This is a six stage process. The stages in this process are teamwork, standardized work, hypothesize solution, implement solution, improved morale, 5s framework.
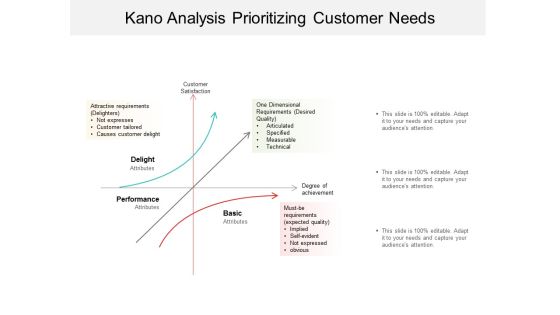
Kano Analysis Prioritizing Customer Needs Ppt Powerpoint Presentation Show Slide
This is a kano analysis prioritizing customer needs ppt powerpoint presentation show slide. This is a three stage process. The stages in this process are product development, kano model, kano framework.

Advanced Email Metrics And Analysis Services Diagram Slide
This is a advanced email metrics and analysis services diagram slide. This is a four stage process. The stages in this process are analytics data warehouse, data mining, financial modeling.
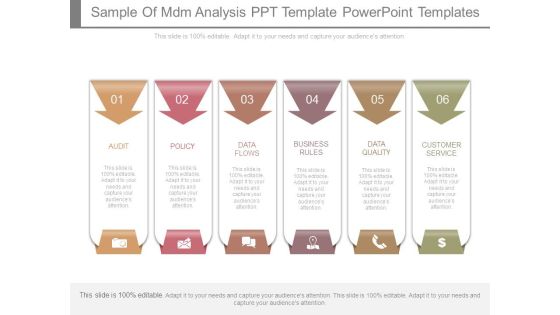
Sample Of Mdm Analysis Ppt Template Powerpoint Templates
This is a sample of mdm analysis ppt template powerpoint templates. This is a six stage process. The stages in this process are audit, policy, data flows, business rules, data quality, customer service.
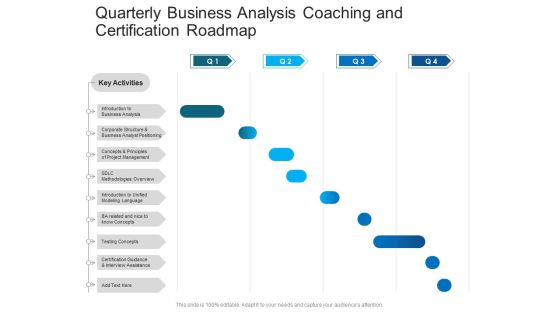
Quarterly Business Analysis Coaching And Certification Roadmap Download
We present our quarterly business analysis coaching and certification roadmap download. This PowerPoint layout is easy-to-edit so you can change the font size, font type, color, and shape conveniently. In addition to this, the PowerPoint layout is Google Slides compatible, so you can share it with your audience and give them access to edit it. Therefore, download and save this well-researched quarterly business analysis coaching and certification roadmap download in different formats like PDF, PNG, and JPG to smoothly execute your business plan.

Gap Analysis And Documentation Example Ppt Slide Templates
This is a gap analysis and documentation example ppt slide templates. This is a four stage process. The stages in this process are fact finding, documentation review, report and recommendations, results.

Data Analysis Research Methodology Ppt PowerPoint Presentation Model Graphics Cpb
Presenting this set of slides with name data analysis research methodology ppt powerpoint presentation model graphics cpb. This is an editable Powerpoint six stages graphic that deals with topics like data analysis research methodology to help convey your message better graphically. This product is a premium product available for immediate download and is 100 percent editable in Powerpoint. Download this now and use it in your presentations to impress your audience.
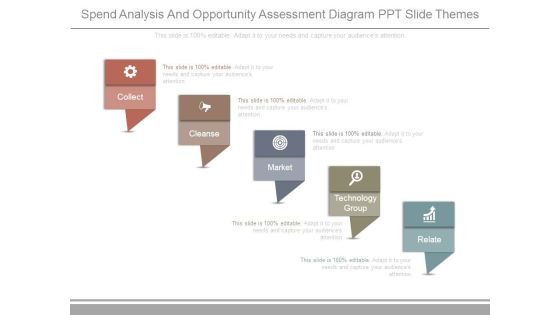
Spend Analysis And Opportunity Assessment Diagram Ppt Slide Themes
This is a spend analysis and opportunity assessment diagram ppt slide themes. This is a five stage process. The stages in this process are collect, cleanse, market, technology group, relate.

Value Chain Analysis In Strategic Management Ppt Examples
This is a value chain analysis in strategic management ppt examples. This is a four stage process. The stages in this process are firm infrastructure, hr management, technology development, procurement.

Market Opportunity Analysis Template 2 Ppt PowerPoint Presentation Summary Guidelines
This is a market opportunity analysis template 2 ppt powerpoint presentation summary guidelines. This is a seven stage process. The stages in this process are customer, competition, company, technology.

Market Opportunity Analysis Template 2 Ppt PowerPoint Presentation Infographics Tips
This is a market opportunity analysis template 2 ppt powerpoint presentation infographics tips. This is a seven stage process. The stages in this process are technology, company, competition, customer.
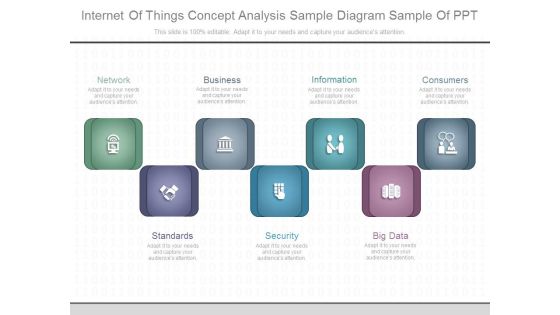
Internet Of Things Concept Analysis Sample Diagram Sample Of Ppt
This is a internet of things concept analysis sample diagram sample of ppt. This is a seven stage process. The stages in this process are network, business, information, consumers, standards, security, big data.

Process Of Web Security Testing And Analysis Ppt Design
This is a process of web security testing and analysis ppt design. This is a six stage process. The stages in this process are error handing, controlled access, session management, network security, server and code management, data access.

Competitive Analysis Template 6 Scatter Chart Ppt PowerPoint Presentation Shapes
This is a competitive analysis template 6 scatter chart ppt powerpoint presentation shapes. This is a one stage process. The stages in this process are users interface, data import, example, pricing, support update, tutorials, easy to use.

Competitive Analysis Scatter Chart Template 2 Ppt PowerPoint Presentation Files
This is a competitive analysis scatter chart template 2 ppt powerpoint presentation files. This is a nine stage process. The stages in this process are users interface, data import, example, pricing, support, update.

Competitive Analysis Template 6 Scatter Chart Ppt PowerPoint Presentation Slides
This is a competitive analysis template 6 scatter chart ppt powerpoint presentation slides. This is a eight stage process. The stages in this process are users interface, data import, example, pricing, support, update, tutorials, easy to use, table.

Competitive Analysis Template 7 Bubble Chart Ppt PowerPoint Presentation Deck
This is a competitive analysis template 7 bubble chart ppt powerpoint presentation deck. This is a six stage process. The stages in this process are users interface, data import, example, pricing, support, update, tutorials, easy to use, table.

Competitive Analysis Scatter Chart Radar Chart Ppt PowerPoint Presentation Model
This is a competitive analysis scatter chart radar chart ppt powerpoint presentation model. This is a eight stage process. The stages in this process are users interface, data import, example, pricing, support, update, tutorials, easy to use.

Funds Risk Analysis With Investor Persona Ppt Outline Templates PDF
This slide shows funds risk analysis with investor persona. It provides information such as conservative, moderate, aggressive, higher risk, medium risk, lower risk, potential returns, etc. Presenting Funds Risk Analysis With Investor Persona Ppt Outline Templates PDF to dispense important information. This template comprises three stages. It also presents valuable insights into the topics including Moderately Low, Low, Moderate, High. This is a completely customizable PowerPoint theme that can be put to use immediately. So, download it and address the topic impactfully.

Univariate Analysis Techniques For Data Visualization Introduction PDF
This slide depicts the univariate analysis technique for data visualization, including distribution, box and whisker, and the violin plot. If your project calls for a presentation, then Slidegeeks is your go to partner because we have professionally designed, easy to edit templates that are perfect for any presentation. After downloading, you can easily edit Univariate Analysis Techniques For Data Visualization Introduction PDF and make the changes accordingly. You can rearrange slides or fill them with different images. Check out all the handy templates.

Survey Analysis Of Brand Impression With Total Mean Template PDF
This slide shows the graphical representation of the data collected through a survey of brand impression on public. It includes data like reliable, practical, trustworthy, affordable, eco friendly etc. Showcasing this set of slides titled Survey Analysis Of Brand Impression With Total Mean Template PDF. The topics addressed in these templates are Brand Impression, Survey Analysis. All the content presented in this PPT design is completely editable. Download it and make adjustments in color, background, font etc. as per your unique business setting.

Stakeholder Project Management Plan Analysis Ppt File Background Image PDF
This slide defines the analysis of the stakeholder project management plan . it includes information related to stakeholder, risk, influence, interest, project phase and engagement level. Showcasing this set of slides titled Stakeholder Project Management Plan Analysis Ppt File Background Image PDF. The topics addressed in these templates are Stakeholder, Risk, Influence, Project Level. All the content presented in this PPT design is completely editable. Download it and make adjustments in color, background, font etc. as per your unique business setting.
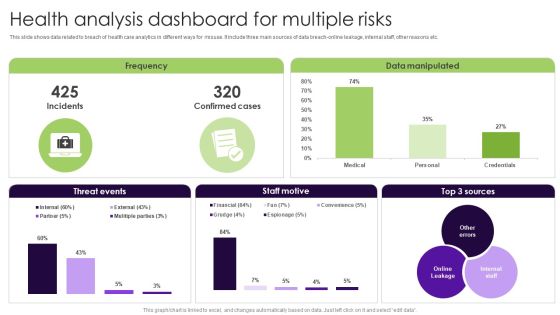
Health Analysis Dashboard For Multiple Risks Elements PDF
This slide shows data related to breach of health care analytics in different ways for misuse. It include three main sources of data breach-online leakage, internal staff, other reasons etc. Showcasing this set of slides titled Health Analysis Dashboard For Multiple Risks Elements PDF. The topics addressed in these templates are Health Analysis Dashboard, Multiple Risks. All the content presented in this PPT design is completely editable. Download it and make adjustments in color, background, font etc. as per your unique business setting.

Ppt Slide Statistical Analysis With Parallel Arrows Business Diagrams
Draw It Out On Our PPT Slide statistical analysis with parallel arrows business diagrams Powerpoint Templates. Provide Inspiration To Your Colleagues. Motivate The Disheartened With Our Business Plan Powerpoint Templates. Inspire Them With The Goodness In You.

Colored Swot Analysis For Strength And Weakness PowerPoint Template
Concept of SWOT analysis has been displayed in this power point template. This PPT contains the graphic of colored square. This PPT diagram contains the weakness and strength. Use this PPT for your management and business related presentations.
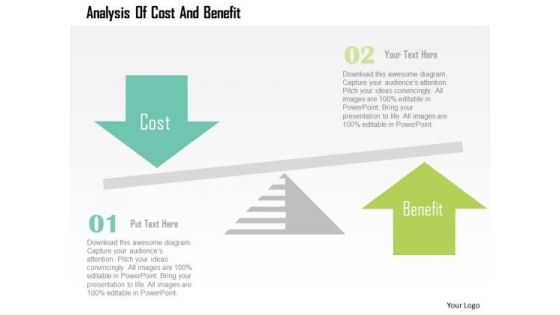
Business Diagram Analysis Of Cost And Benefit Presentation Template
This business diagram contains graphics of balancing scale with arrows of cost and benefit. You may use this diagram for analysis of cost and benefit. Communicate effectively with your group through this slide.
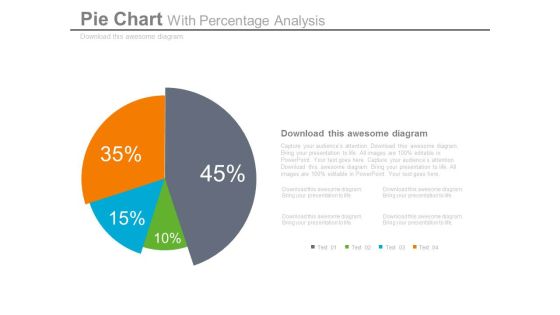
Pie Chart Dashboard Style For Percentage Analysis Powerpoint Slides
This dashboard PPT template contains graphics of pie chart. This dashboard PowerPoint template helps to display percentage analysis in a visual manner. Download this PPT slide for quick decision-making.
Pie Chart With Icons For Business Analysis Powerpoint Slides
This dashboard template contains graphics of pie chart with icons. This dashboard PowerPoint template helps to display business analysis in a visual manner. Download this template to make impressive presentations.
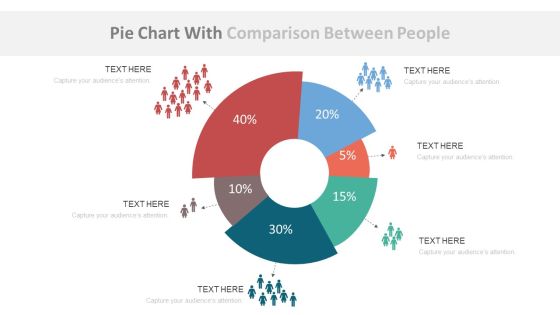
Pie Chart With Population Ratio Analysis Powerpoint Slides
This dashboard template contains graphics of pie chart with icons. This dashboard PowerPoint template helps to display population ratio analysis in a visual manner. Download this template to make impressive presentations.
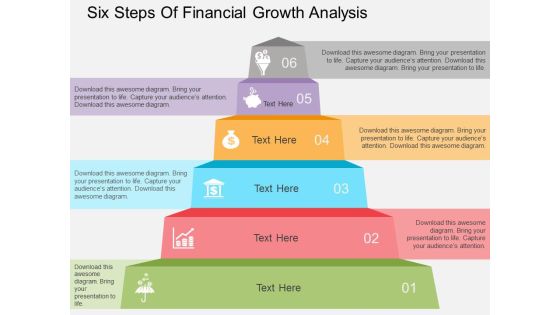
Six Steps Of Financial Growth Analysis Powerpoint Templates
Financial growth analysis can be defined with this business diagram slide. This PowerPoint template contains the graphic of six steps with business icons. Download this editable diagram slide to build unique presentations.
Five Mountain Chart With Icons For Financial Analysis Powerpoint Slides
Our above PPT slide contains five mountains with icons and financial values. This PowerPoint template helps to exhibit financial analysis for business growth. Use this diagram to impart more clarity to subject and to create more sound impact on viewers.
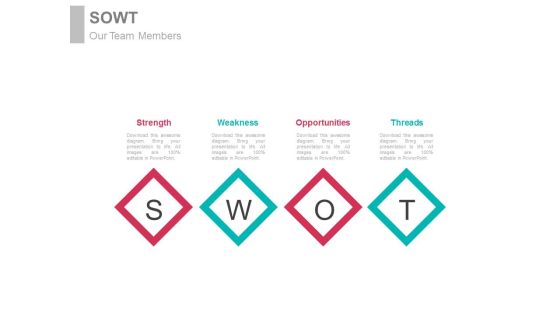
Swot Analysis Design For Management Studies Powerpoint Template
This Power Point template has been designed with SWOT analysis diagram. This PPT diagram may be used for projects in management studies. Use this PPT diagram for business and education related presentations.
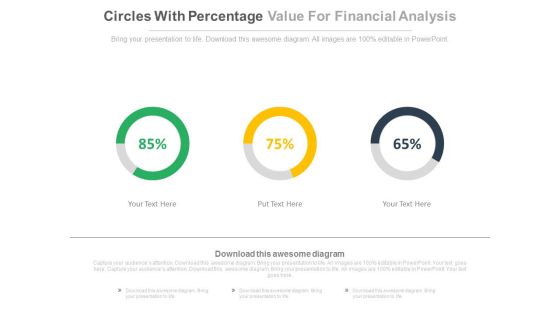
Three Circles With Percentage Values For Financial Analysis Powerpoint Slides
This PowerPoint template has been designed with three circles and percentage values. This PPT slide may be used to display financial analysis for business. Download this slide to build unique presentation.
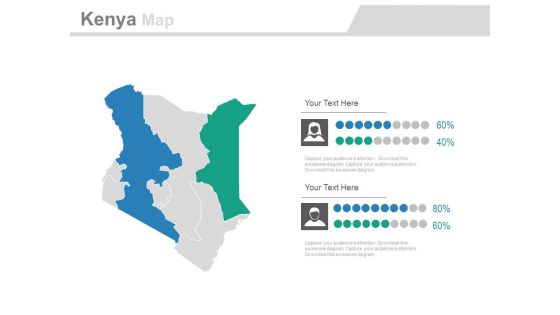
Map Of Kenya With Gender Population Analysis Powerpoint Slides
This PowerPoint map template has been designed with map of Kenya and male female icons. Use these maps to display gender population analysis in your presentations. Any text can be entered at any point in the PowerPoint map slide.
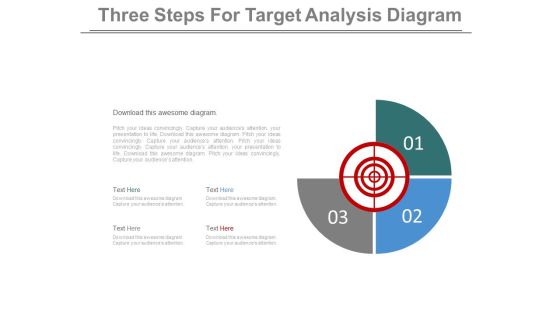
Three Steps For Target Analysis Diagram Powerpoint Slides
Our above business slide contains circular graphics of with three steps. This slide is suitable to present target analysis steps. Develop your strategy and communicate with your team with this professional slide design.

Banners With Business Growth Analysis And Deal Icons Powerpoint Template
This PowerPoint slide contains graphics of text banners with icons. This professional slide helps to exhibit business growth, analysis and deals. Use this professional template to make impressive presentations.

Example Of Cause And Effect Analysis Example Of Ppt
This is an example of cause and effect analysis example of ppt. This is a one stage process. The stages in this process are product positioning, consumer research, target consumer, product concept, product testing, distribution, and publicity, creative.\n\n
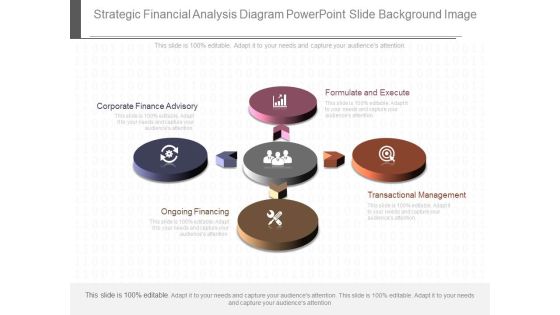
Strategic Financial Analysis Diagram Powerpoint Slide Background Image
This is a strategic financial analysis diagram powerpoint slide background image. This is a four stage process. The stages in this process are formulate and execute, transactional management, ongoing financing, corporate finance advisory.

Go To Market Swot Analysis Diagram Ppt Powerpoint Guide
This is a go to market swot analysis diagram ppt powerpoint guide. This is a six stage process. The stages in this process are strengths, weaknesses, internal factors, external factors, threats, opportunities.

Five Forces Analysis Template Diagram Example Of Ppt
This is a five forces analysis template diagram example of ppt. This is a four stage process. The stages in this process are potential entrants, buyer power, supplier power, threat of substitutes.
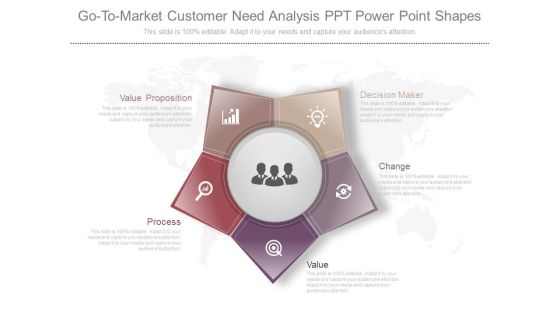
Go To Market Customer Need Analysis Ppt Powerpoint Shapes
This is a go to market customer need analysis ppt powerpoint shapes. This is a five stage process. The stages in this process are decision maker, change, value, process, value proposition.

Global And Local Challenges In Business Analysis Diagram Powerpoint Templates
This is a global and local challenges in business analysis diagram powerpoint templates. This is a four stage process. The stages in this process are regulations, education, immigration, infrastructure, r and d.

Example Of Go To Market Strategy Analysis Ppt Model
This is an example of go to market strategy analysis ppt model. This is a four stage process. The stages in this process are internal factors, external factors, strengths, weaknesses, threats, opportunities\n.
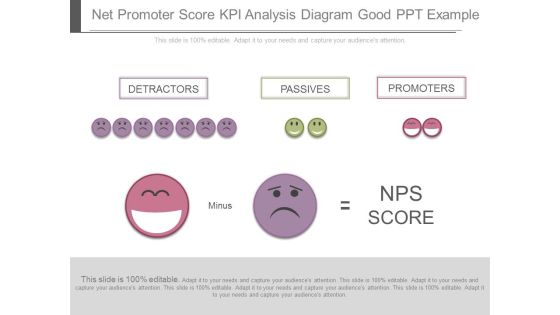
Net Promoter Score Kpi Analysis Diagram Good Ppt Example
This is a net promoter score kpi analysis diagram good ppt example. This is a three stage process. The stages in this process are detractors, passives, promoters, minus, nps score.
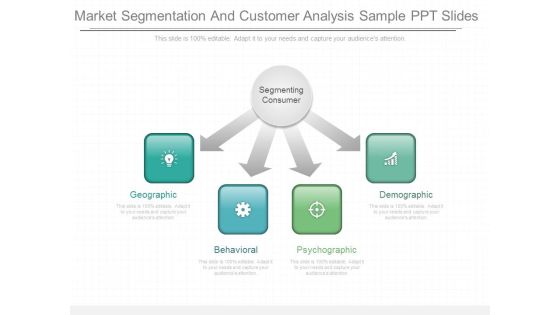
Market Segmentation And Customer Analysis Sample Ppt Slides
This is a market segmentation and customer analysis sample ppt slides. This is a four stage process. The stages in this process are segmenting consumer, geographic, behavioral, psychographic, demographic.
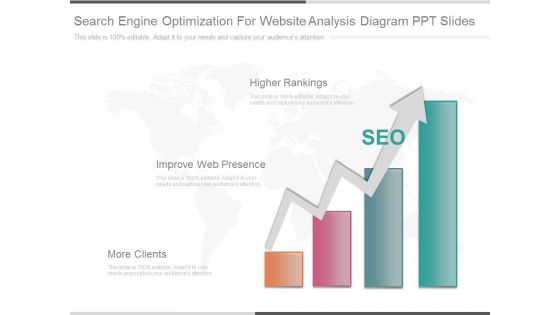
Search Engine Optimization For Website Analysis Diagram Ppt Slides
This is a search engine optimization for website analysis diagram ppt slides. This is a four stage process. The stages in this process are higher rankings, improve web presence, more clients.
Face Book Brand Analysis Ppt Powerpoint Slide Images
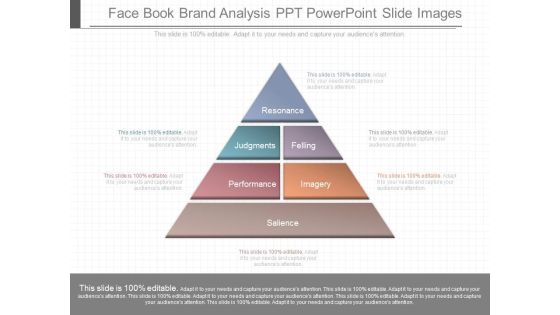
This is a face book brand analysis ppt powerpoint slide images. This is a four stage process. The stages in this process are resonance, judgments, felling, performance, imagery, salience.\n\n\n\n\n \n
Search Engine Optimization Marketing Analysis Diagram Ppt Slides
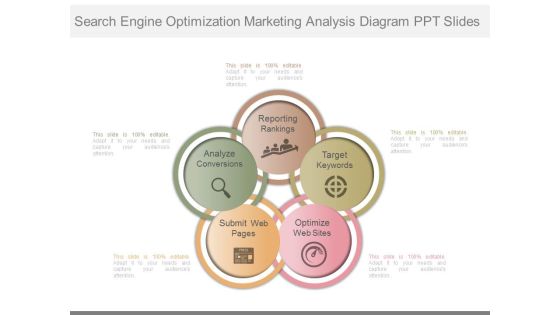
This is a search engine optimization marketing analysis diagram ppt slides. This is a five stage process. The stages in this process are reporting rankings, analyze conversions, submit web pages, optimize web sites, target keywords.
Link Building And Off Page Seo Analysis Diagram Ppt Slides
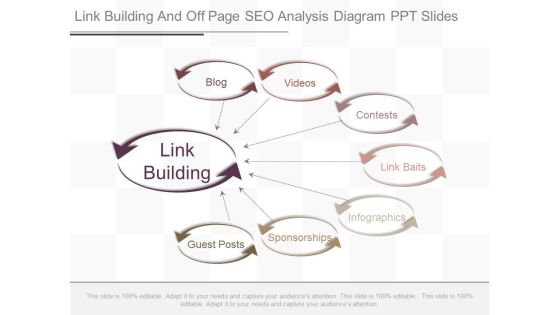
This is a link building and off page seo analysis diagram ppt slides. This is a seven stage process. The stages in this process are link building, blog, videos, contests, link baits, infographics, sponsorships, guest posts.\n\n\n\n\n\n
Principles Of Business Analysis Ppt Powerpoint Slide Designs
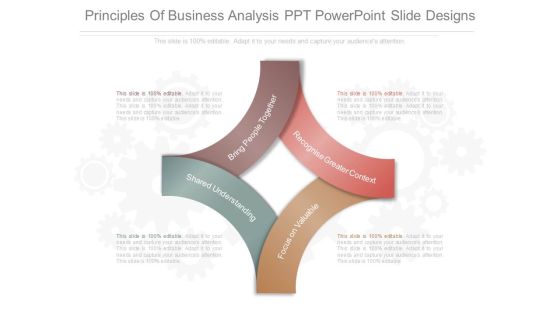
This is a principles of business analysis ppt powerpoint slide designs. This is a four stage process. The stages in this process are bring people together, recognise greater context, shared understanding, focus on valuable.

Sales Management Analysis And Decision Making Ppt Slide Examples
This is a sales management analysis and decision making ppt slide examples. This is a six stage process. The stages in this process are the decision maker, decision, action, forecasts, interaction, resources, performance.
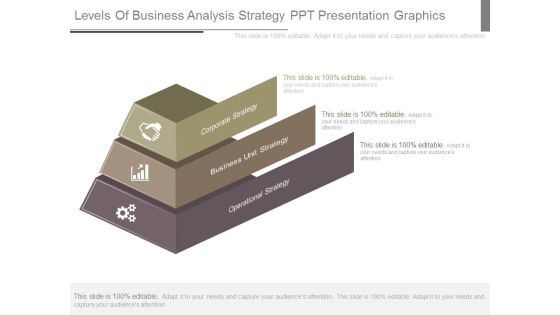
Levels Of Business Analysis Strategy Ppt Presentation Graphics
This is a levels of business analysis strategy ppt presentation graphics. This is a three stage process. The stages in this process are corporate strategy, business unit strategy, operational strategy.

Business Analysis In Agile Environment Diagram Presentation Portfolio
This is a business analysis in agile environment diagram presentation portfolio. This is a eight stage process. The stages in this process are requirement, planning, evaluation, analyze and design, implementation, test, initial planning, deployment.

Change Analysis For Business Diagram Powerpoint Slide Themes
This is a change analysis for business diagram powerpoint slide themes. This is a four stage process. The stages in this process are sustains, assess, implement, begins, vision, results.
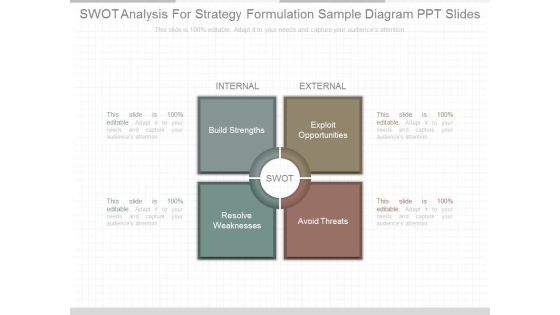
Swot Analysis For Strategy Formulation Sample Diagram Ppt Slides
This is a swot analysis for strategy formulation sample diagram ppt slides. This is a four stage process. The stages in this process are build strengths, exploit opportunities, resolve weaknesses, avoid threats.

Timeline Generator For Sales Growth Analysis Ppt Example File
This is a timeline generator for sales growth analysis ppt example file. This is a four stage process. The stages in this process are business, management, strategy, marketing, year.
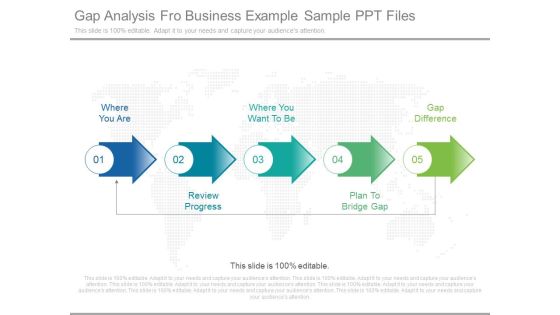
Gap Analysis Fro Business Example Sample Ppt Files
This is a gap analysis fro business example sample ppt files. This is a five stage process. The stages in this process are where you are, review progress, where you want to be, plan to bridge gap, gap difference.

Net Promoter Score Report Analysis Ppt Powerpoint Show
This is a net promoter score report analysis ppt powerpoint show. This is a three stage process. The stages in this process are detractors, passives, promoters, your nps, nps, percentage promoters, percentage detractors.

Cro With Marketing Targets Analysis Ppt Powerpoint Slides
This is a cro with marketing targets analysis ppt powerpoint slides. This is a four stage process. The stages in this process are measure and optimize, retain and grow customers, attract visitors, convert visitors to customers.
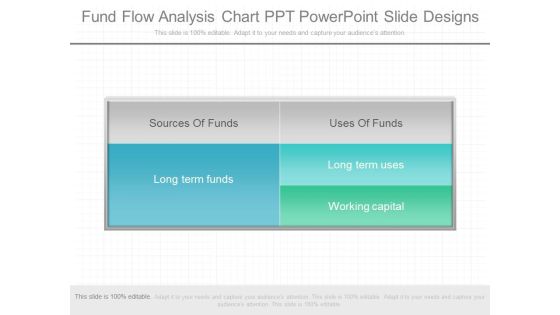
Fund Flow Analysis Chart Ppt Powerpoint Slide Designs
This is a fund flow analysis chart ppt powerpoint slide designs. This is a five stage process. The stages in this process are sources of funds, long term funds, uses of funds, long term uses, working capital.

Analysis Of Marketing System With Reference Strategy Ppt Powerpoint Guide
This is a analysis of marketing system with reference strategy ppt powerpoint guide. This is a four stage process. The stages in this process are email marketing, direct mail marketing, social media marketing, contact management.

B2b Marketing Plan For Analysis Ppt Presentation Visual Aids
This is a b2b marketing plan for analysis ppt presentation visual aids. This is a five stage process. The stages in this process are marketing strategy, business goals, activity prioritization, execute, 12 month activity plan.
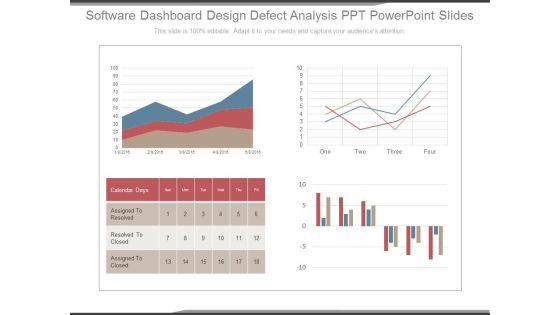
Software Dashboard Design Defect Analysis Ppt Powerpoint Slides
This is a software dashboard design defect analysis ppt powerpoint slides. This is a four stage process. The stages in this process are calendar days, assigned to resolved, resolved to closed, assigned to closed.

Process Of Marketing Campaign Analysis Ppt Powerpoint Guide
This is a process of marketing campaign analysis ppt powerpoint guide. This is a seven stage process. The stages in this process are offer, email, blogs, press releases, search engines, owned, email marketing.

Cyber Threat Analysis Sample Diagram Cyber Powerpoint Guide
This is a cyber threat analysis sample diagram cyber powerpoint guide. This is a three stage process. The stages in this process are system susceptibility, threat capability, threat accessibility.
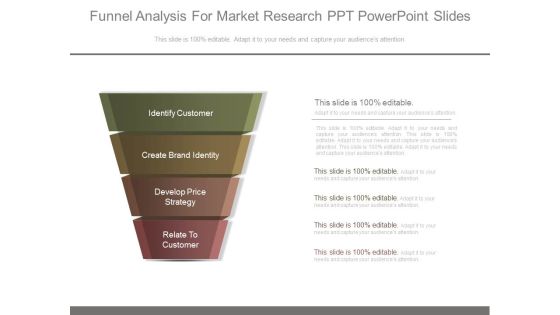
Funnel Analysis For Market Research Ppt Powerpoint Slides
This is a funnel analysis for market research ppt powerpoint slides. This is a four stage process. The stages in this process are identify customer, create brand identity, develop price strategy, relate to customer.
 Home
Home